DataLibraryResearch is tracking the market dynamics of the crisis in the Construction & Manufacturing industry amid lock-down changes in the supply chain.
Get detailed analysis of the COVID-19 impact on the IE4 Permanent Magnet Market
Global IE4 Permanent Magnet Market Opportunities and Forecast 2023-2030
IE4 permanent magnet synchronous motors are used to minimize the consumption of energy and lessen CO2 emissions. These motors are also used to boost the usage of industrial compressors, pumps, fans, and several other mechanical applications. The global IE4 Permanent Magnet Synchronous Motors market is expected to grow at a significant rate in the forecast period.
In a variety of robotic procedures, IE4 motors are used. Control, torque needs, acceleration, angular movements, and speed make IE4 motors an excellent choice for robotic system designers. This key fact supports the development of the global IE4 Permanent Magnet Synchronous Motors market.
Green technology is being more widely adopted around the world. High-quality insulation and lamination, as well as low fan losses, are two advantages of energy-efficient IE4 motors over ordinary motors. Such considerations have a major and visible impact on the expanding demand for energy-efficient IE4 motors in a variety of end-use sectors. Eventually, it propels the growth of the IE4 Permanent Magnet Synchronous Motors market. Also, the implementation of stringent environmental standards and rules are escalating the growth of the market.
Furthermore, end-users of energy-efficient and high-performing IE4 motors include ventilation, HVAC, material handling systems, refrigerators, compressed air, and pumps, which are propelling the growth of the global IE4 Permanent Magnet Synchronous Motors market. Furthermore, substantial demand for IE4 motors is expected in the wind power and blower sectors in the next years.
On the downside, there is a growing preference for the installation of IE2 motors by many domestic manufacturers, due to domestic production constraints, these manufacturers may not be able to adapt IE4 motors. This key fact may hamper the growth of the global IE4 Permanent Magnet Synchronous Motors market.
Report Metric
Details
Market size available for years
2019–2027
Base year considered
2019
Forecast period
2020–2027
Forecast unit
Value (USD Million)
Segments covered
Product, Application, and Region
Regions covered
North America (the U.S. and Canada), Europe (UK, Germany, France, Italy, Spain, Russia, Rest of Europe), Asia-Pacific (China, India, Japan, Australia, South East Asia, Rest of Asia Pacific), Latin America and the Middle East and Africa (Brazil, Saudi Arabia, UAE, Rest of LAMEA)
Covid-19 Impact on IE4 Permanent Magnet Synchronous Motors Market
The ongoing COVID-19 pandemic conditions have severely affected every sector around the world. Whereas, the chemicals and materials sectors were moderately affected during the pandemic. This is primarily due to the uncut demand for chemicals for healthcare, life science, and cleaning agents. However, other elements of chemical and material sectors such as paints, industrial oil, construction materials are facing diminution in demand. Strict lockdown resulted in a nearly 50-60% reduction in supply for raw materials, which directly affected the manufacturing process. Further, halt on many end-use industries directly affected the chemical demand all around the world.
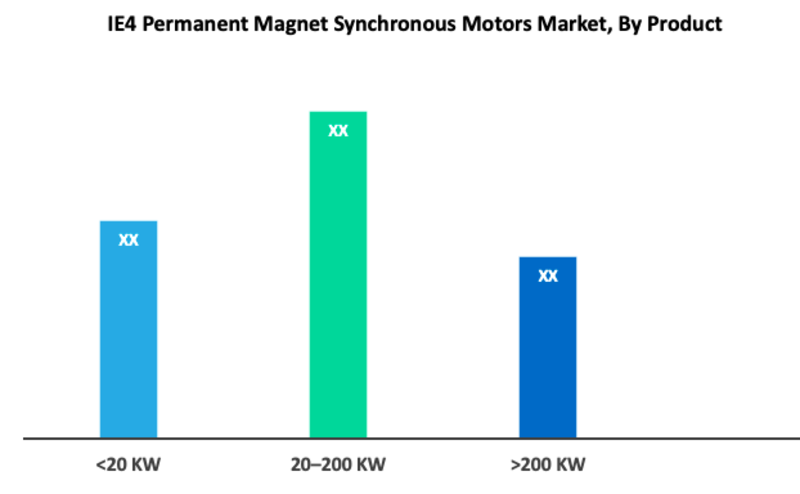
Based on Product, the 20–200 kW segment held the largest share in the global IE4 Permanent Magnet Synchronous Motors Market. This is mainly due to an increase in demand for energy-efficient conveyor systems in the manufacturing and automotive industries. Furthermore, according to the application, the Air Compressors & Vacuum Pumps is the most prominent segment in the market. This is because of the increase in demand for compressors systems in the manufacturing and automotive industries.
IE4 Permanent Magnet Synchronous Motors Market, By Product
· <20 kW · 20–200 kW · >200 kW
IE4 Permanent Magnet Synchronous Motors Market, By Application
In terms of geography, Asia-Pacific accounted for the highest share in the IE4 Permanent Magnet Synchronous Motors market and is estimated to continue with its dominant position in the forecast period. This is primarily attributed to industrial growth in developing countries such as India and China. In the market for IE4 permanent magnet synchronous motors, China is a market leader. As a result, the Asia-Pacific countries have the biggest market share for IE4 permanent magnet synchronous motors.
IE4 Permanent Magnet Synchronous Motors Market, By Geography
· North America (US & Canada) · Europe (UK, Germany, France, Italy, Spain, Russia & Rest of Europe) · Asia-Pacific (Japan, China, India, Australia, & South Korea, & Rest of Asia-Pacific) · LAMEA (Brazil, Saudi Arabia, UAE & Rest of LAMEA)
Q1. What is the total CAGR expected to be recorded for the IE4 Permanent Magnet Synchronous Motors market during the forecast period?
A. The IE4 Permanent Magnet Synchronous Motors market is expected to record a CAGR of ~ 9 % during the forecast period
Q2. What are the driving factors for the IE4 Permanent Magnet Synchronous Motors market?
A. High-quality insulation and lamination, as well as low fan losses, are two advantages of energy-efficient IE4 motors over ordinary motors. Such considerations have a major and visible impact on the expanding demand for energy-efficient IE4 motors in a variety of end-use sectors. Eventually it propels the growth of the IE4 Permanent Magnet Synchronous Motors market
Q3. What are the restraining factors for the IE4 Permanent Magnet Synchronous Motors market?
A. There is growing preference for installation of IE2 motors by many domestic manufacturers, due to domestic production constraints, these manufacturers may not be able to adapt IE4 motors. This key fact may hamper the growth of the global IE4 Permanent Magnet Synchronous Motors market.
Q4. Which segment is projected to hold the largest share in the IE4 Permanent Magnet Synchronous Motors Market. ?
A. The 20–200 kW segment is projected to hold the largest share in the IE4 Permanent Magnet Synchronous Motors Market.
Q5. Which are the prominent players in the IE4 Permanent Magnet Synchronous Motors Market?
A. Fuji Electric Co., Ltd., Kienle + Spiess GmbH, ABB, Anhui Wannan Electric Machine Co., Ltd., Toshiba Corporation, Motori Elettrici s.r.l., Altra Industrial Motion Corp, Bharat Bijlee, CG global, Danfoss, Hitachi Ltd., Kaeser Kompressoren, KSB SE & Co. KGaA, Lafert, Merkes GmbH. are some key players in the IE4 Permanent Magnet Synchronous Motors Market.
IE4 Permanent Magnet Synchronous Motors Market Study Global Market Analysis, Insights and Forecast, 2020-2027
1. Introduction
1.1. Research Scope
1.2. Market Segmentation
1.3. Research Methodology
1.4. Definitions and Assumptions
2. Executive Summary
3. Market Dynamics
3.1. Market Drivers
3.2. Market Restraints
3.3. Market Opportunities
4. Key Insights
4.1. Key Emerging Trends – For Major Countries
4.2. Latest Technological Advancement
4.3. Regulatory Landscape
4.4. Industry SWOT Analysis
4.5. Porters Five Forces Analysis
5. Global IE4 Permanent Magnet Synchronous Motors Market Analysis (USD Billion), Insights and Forecast, 2020-2027
5.1. Key Findings / Summary
5.2. Market Analysis, Insights and Forecast – By Product
5.2.1. <20 kW
5.2.2. 20–200 kW
5.2.3. >200 kW
5.3. Market Analysis, Insights and Forecast – By Application
5.3.1. Material Handling
5.3.2. Liquid Pumps
5.3.3. Fans & Ventilation
5.3.4. Cooling Compressors
5.3.5. Air Compressors & Vacuum Pumps
5.3.6. Blowers
5.3.7. Coolers
5.4. Market Analysis, Insights and Forecast – By Region
5.4.1. North America
5.4.2. Europe
5.4.3. Asia Pacific
5.4.4. Latin America, Middle East and Africa
6. North America IE4 Permanent Magnet Synchronous Motors Market Analysis (USD Billion), Insights and Forecast, 2020-2027
6.1. Key Findings / Summary
6.2. Market Analysis, Insights and Forecast – By Product
6.2.1. <20 kW
6.2.2. 20–200 kW
6.2.3. >200 kW
6.3. Market Analysis, Insights and Forecast – By Application
6.3.1. Material Handling
6.3.2. Liquid Pumps
6.3.3. Fans & Ventilation
6.3.4. Cooling Compressors
6.3.5. Air Compressors & Vacuum Pumps
6.3.6. Blowers
6.3.7. Coolers
6.4. Market Analysis, Insights and Forecast – By Country
6.4.1. U.S.
6.4.2. Canada
7. Europe IE4 Permanent Magnet Synchronous Motors Market Analysis (USD Billion), Insights and Forecast, 2020-2027
7.1. Key Findings / Summary
7.2. Market Analysis, Insights and Forecast – By Product
7.2.1. <20 kW
7.2.2. 20–200 kW
7.2.3. >200 kW
7.3. Market Analysis, Insights and Forecast – By Application
7.3.1. Material Handling
7.3.2. Liquid Pumps
7.3.3. Fans & Ventilation
7.3.4. Cooling Compressors
7.3.5. Air Compressors & Vacuum Pumps
7.3.6. Blowers
7.3.7. Coolers
7.4. Market Analysis, Insights and Forecast – By Country
7.4.1. UK
7.4.2. Germany
7.4.3. France
7.4.4. Italy
7.4.5. Spain
7.4.6. Russia
7.4.7. Rest of Europe
8. Asia Pacific IE4 Permanent Magnet Synchronous Motors Market Analysis (USD Billion), Insights and Forecast, 2020-2027
8.1. Key Findings / Summary
8.2. Market Analysis, Insights and Forecast – By Product
8.2.1. <20 kW
8.2.2. 20–200 kW
8.2.3. >200 kW
8.3. Market Analysis, Insights and Forecast – By Application
8.3.1. Material Handling
8.3.2. Liquid Pumps
8.3.3. Fans & Ventilation
8.3.4. Cooling Compressors
8.3.5. Air Compressors & Vacuum Pumps
8.3.6. Blowers
8.3.7. Coolers
8.4. Market Analysis, Insights and Forecast – By Country
8.4.1. China
8.4.2. India
8.4.3. Japan
8.4.4. Australia
8.4.5. South East Asia
8.4.6. Rest of Asia Pacific
9. Latin America, Middle East and Africa IE4 Permanent Magnet Synchronous Motors Market Analysis (USD Billion), Insights and Forecast, 2020-2027
9.1. Key Findings / Summary
9.2. Market Analysis, Insights and Forecast – By Product
9.2.1. <20 kW
9.2.2. 20–200 kW
9.2.3. >200 kW
9.3. Market Analysis, Insights and Forecast – By Application
9.3.1. Material Handling
9.3.2. Liquid Pumps
9.3.3. Fans & Ventilation
9.3.4. Cooling Compressors
9.3.5. Air Compressors & Vacuum Pumps
9.3.6. Blowers
9.3.7. Coolers
9.4. Market Analysis, Insights and Forecast – By Country
9.4.1. Brazil
9.4.2. Saudi Arabia
9.4.3. UAE
9.4.4. Rest of LAMEA
10. Competitive Analysis
10.1. Company Market Share Analysis, 2018
10.2. Key Industry Developments
10.3. Company Profile
10.4. Fuji Electric Co., Ltd.
10.4.1. Business Overview
10.4.2. Segment 1 & Service Offering
10.4.3. Overall Revenue
10.4.4. Geographic Presence
10.4.5. Recent Development
*Similar details will be provided for the following companies
10.5. Kienle + Spiess GmbH
10.6. ABB
10.7. Anhui Wannan Electric Machine Co., Ltd.
10.8. Toshiba Corporation
10.9. Motori Elettrici s.r.l.
10.10. Altra Industrial Motion Corp
10.11. Bharat Bijlee
10.12. CG global
10.13. Danfoss
10.14. Hitachi Ltd.
10.15. Kaeser Kompressoren
10.16. KSB SE & Co. KGaA
10.17. Lafert
List of Figures
Figure 1: Global IE4 Permanent Magnet Market Revenue Breakdown (USD Billion, %) by Region, 2019 & 2027
Figure 2: Global Market Value Share (%), By Segment 1, 2019 & 2027
Figure 3: Global Market Forecast (USD Billion), by Sub-Segment 1, 2016-2027
Figure 4: Global Market Forecast (USD Billion), by Sub-Segment 2, 2016-2027
Figure 5: Global Market Value Share (%), By Segment 2, 2019 & 2027
Figure 6: Global Market Forecast (USD Billion), by Sub-Segment 1, 2016-2027
Figure 7: Global Market Forecast (USD Billion), by Sub-Segment 2, 2016-2027
Figure 8: Global Market Forecast (USD Billion), by Sub-Segment 3, 2016-2027
Figure 9: Global IE4 Permanent Magnet Market Forecast (USD Billion), by Others, 2016-2027
Figure 10: Global Market Value Share (%), By Segment 3, 2019 & 2027
Figure 11: Global Market Forecast (USD Billion), by Sub-Segment 1, 2016-2027
Figure 12: Global Market Forecast (USD Billion), by Sub-Segment 2, 2016-2027
Figure 13: Global Market Forecast (USD Billion), by Sub-Segment 3, 2016-2027
Figure 14: Global Market Forecast (USD Billion), by Others, 2016-2027
Figure 15: Global Market Value (USD Billion), by Region, 2019 & 2027
Figure 16: North America IE4 Permanent Magnet Market Value Share (%), By Segment 1, 2019 & 2027
Figure 17: North America Market Forecast (USD Billion), by Sub-Segment 1, 2016-2027
Figure 18: North America Market Forecast (USD Billion), by Sub-Segment 2, 2016-2027
Figure 19: North America Market Value Share (%), By Segment 2, 2019 & 2027
Figure 20: North America Market Forecast (USD Billion), by Sub-Segment 1, 2016-2027
Figure 21: North America Market Forecast (USD Billion), by Sub-Segment 2, 2016-2027
Figure 22: North America Market Forecast (USD Billion), by Sub-Segment 3, 2016-2027
Figure 23: North America Market Forecast (USD Billion), by Others, 2016-2027
Figure 24: North America Market Value Share (%), By Segment 3, 2019 & 2027
Figure 25: North America Market Forecast (USD Billion), by Sub-Segment 1, 2016-2027
Figure 26: North America Market Forecast (USD Billion), by Sub-Segment 2, 2016-2027
Figure 27: North America Market Forecast (USD Billion), by Sub-Segment 3, 2016-2027
Figure 28: North America Market Forecast (USD Billion), by Others, 2016-2027
Figure 29: North America Market Forecast (USD Billion), by U.S., 2016-2027
Figure 30: North America Market Forecast (USD Billion), by Canada, 2016-2027
Figure 31: Latin America IE4 Permanent Magnet Market Value Share (%), By Segment 1, 2019 & 2027
Figure 32: Latin America Market Forecast (USD Billion), by Sub-Segment 1, 2016-2027
Figure 33: Latin America Market Forecast (USD Billion), by Sub-Segment 2, 2016-2027
Figure 34: Latin America Market Value Share (%), By Segment 2, 2019 & 2027
Figure 35: Latin America Market Forecast (USD Billion), by Sub-Segment 1, 2016-2027
Figure 36: Latin America Market Forecast (USD Billion), by Sub-Segment 2, 2016-2027
Figure 37: Latin America Market Forecast (USD Billion), by Sub-Segment 3, 2016-2027
Figure 38: Latin America Market Forecast (USD Billion), by Others, 2016-2027
Figure 39: Latin America Market Value Share (%), By Segment 3, 2019 & 2027
Figure 40: Latin America Market Forecast (USD Billion), by Sub-Segment 1, 2016-2027
Figure 41: Latin America Market Forecast (USD Billion), by Sub-Segment 2, 2016-2027
Figure 42: Latin America Market Forecast (USD Billion), by Sub-Segment 3, 2016-2027
Figure 43: Latin America Market Forecast (USD Billion), by Others, 2016-2027
Figure 44: Latin America Market Forecast (USD Billion), by Brazil, 2016-2027
Figure 45: Latin America Market Forecast (USD Billion), by Mexico, 2016-2027
Figure 46: Latin America Market Forecast (USD Billion), by Rest of Latin America, 2016-2027
Figure 47: Europe IE4 Permanent Magnet Market Value Share (%), By Segment 1, 2019 & 2027
Figure 48: Europe Market Forecast (USD Billion), by Sub-Segment 1, 2016-2027
Figure 49: Europe Market Forecast (USD Billion), by Sub-Segment 2, 2016-2027
Figure 50: Europe Market Value Share (%), By Segment 2, 2019 & 2027
Figure 51: Europe Market Forecast (USD Billion), by Sub-Segment 1, 2016-2027
Figure 52: Europe Market Forecast (USD Billion), by Sub-Segment 2, 2016-2027
Figure 53: Europe Market Forecast (USD Billion), by Sub-Segment 3, 2016-2027
Figure 54: Europe Market Forecast (USD Billion), by Others, 2016-2027
Figure 55: Europe Market Value Share (%), By Segment 3, 2019 & 2027
Figure 56: Europe Market Forecast (USD Billion), by Sub-Segment 1, 2016-2027
Figure 57: Europe Market Forecast (USD Billion), by Sub-Segment 2, 2016-2027
Figure 58: Europe Market Forecast (USD Billion), by Sub-Segment 3, 2016-2027
Figure 59: Europe Market Forecast (USD Billion), by Others, 2016-2027
Figure 60: Europe Market Forecast (USD Billion), by U.K., 2016-2027
Figure 61: Europe Market Forecast (USD Billion), by Germany, 2016-2027
Figure 62: Europe Market Forecast (USD Billion), by France, 2016-2027
Figure 63: Europe Market Forecast (USD Billion), by Italy, 2016-2027
Figure 64: Europe Market Forecast (USD Billion), by Spain, 2016-2027
Figure 65: Europe Market Forecast (USD Billion), by Russia, 2016-2027
Figure 66: Europe Market Forecast (USD Billion), by Rest of Europe, 2016-2027
Figure 67: Asia Pacific IE4 Permanent Magnet Market Value Share (%), By Segment 1, 2019 & 2027
Figure 68: Asia Pacific Market Forecast (USD Billion), by Sub-Segment 1, 2016-2027
Figure 69: Asia Pacific Market Forecast (USD Billion), by Sub-Segment 2, 2016-2027
Figure 70: Asia Pacific Market Value Share (%), By Segment 2, 2019 & 2027
Figure 71: Asia Pacific Market Forecast (USD Billion), by Sub-Segment 1, 2016-2027
Figure 72: Asia Pacific Market Forecast (USD Billion), by Sub-Segment 2, 2016-2027
Figure 73: Asia Pacific Market Forecast (USD Billion), by Sub-Segment 3, 2016-2027
Figure 74: Asia Pacific Market Forecast (USD Billion), by Others, 2016-2027
Figure 75: Asia Pacific Market Value Share (%), By Segment 3, 2019 & 2027
Figure 76: Asia Pacific Market Forecast (USD Billion), by Sub-Segment 1, 2016-2027
Figure 77: Asia Pacific Market Forecast (USD Billion), by Sub-Segment 2, 2016-2027
Figure 78: Asia Pacific Market Forecast (USD Billion), by Sub-Segment 3, 2016-2027
Figure 79: Asia Pacific Market Forecast (USD Billion), by Others, 2016-2027
Figure 80: Asia Pacific Market Forecast (USD Billion), by China, 2016-2027
Figure 81: Asia Pacific Market Forecast (USD Billion), by India, 2016-2027
Figure 82: Asia Pacific Market Forecast (USD Billion), by Japan, 2016-2027
Figure 83: Asia Pacific Market Forecast (USD Billion), by Australia, 2016-2027
Figure 84: Asia Pacific Market Forecast (USD Billion), by Southeast Asia, 2016-2027
Figure 85: Asia Pacific Market Forecast (USD Billion), by Rest of Asia Pacific, 2016-2027
Figure 86: Middle East & Africa IE4 Permanent Magnet Market Value Share (%), By Segment 1, 2019 & 2027
Figure 87: Middle East & Africa Market Forecast (USD Billion), by Sub-Segment 1, 2016-2027
Figure 88: Middle East & Africa Market Forecast (USD Billion), by Sub-Segment 2, 2016-2027
Figure 89: Middle East & Africa Market Value Share (%), By Segment 2, 2019 & 2027
Figure 90: Middle East & Africa Market Forecast (USD Billion), by Sub-Segment 1, 2016-2027
Figure 91: Middle East & Africa Market Forecast (USD Billion), by Sub-Segment 2, 2016-2027
Figure 92: Middle East & Africa Market Forecast (USD Billion), by Sub-Segment 3, 2016-2027
Figure 93: Middle East & Africa Market Forecast (USD Billion), by Others, 2016-2027
Figure 94: Middle East & Africa Market Value Share (%), By Segment 3, 2019 & 2027
Figure 95: Middle East & Africa Market Forecast (USD Billion), by Sub-Segment 1, 2016-2027
Figure 96: Middle East & Africa Market Forecast (USD Billion), by Sub-Segment 2, 2016-2027
Figure 97: Middle East & Africa Market Forecast (USD Billion), by Sub-Segment 3, 2016-2027
Figure 98: Middle East & Africa Market Forecast (USD Billion), by Others, 2016-2027
Figure 99: Middle East & Africa Market Forecast (USD Billion), by GCC, 2016-2027
Figure 100: Middle East & Africa Market Forecast (USD Billion), by South Africa, 2016-2027
Figure 101: Middle East & Africa Market Forecast (USD Billion), by Rest of Middle East & Africa, 2016-2027
List of Tables
Table 1: Global IE4 Permanent Magnet Market Revenue (USD Billion) Forecast, by Segment 1, 2016-2027
Table 2: Global Market Revenue (USD Billion) Forecast, by Segment 2, 2016-2027
Table 3: Global Market Revenue (USD Billion) Forecast, by Segment 3, 2016-2027
Table 4: Global Market Revenue (USD Billion) Forecast, by Region, 2016-2027
Table 5: North America IE4 Permanent Magnet Market Revenue (USD Billion) Forecast, by Segment 1, 2016-2027
Table 6: North America Market Revenue (USD Billion) Forecast, by Segment 2, 2016-2027
Table 7: North America Market Revenue (USD Billion) Forecast, by Segment 3, 2016-2027
Table 8: North America Market Revenue (USD Billion) Forecast, by Country, 2016-2027
Table 9: Europe IE4 Permanent Magnet Market Revenue (USD Billion) Forecast, by Segment 1, 2016-2027
Table 10: Europe Market Revenue (USD Billion) Forecast, by Segment 2, 2016-2027
Table 11: Europe Market Revenue (USD Billion) Forecast, by Segment 3, 2016-2027
Table 12: Europe Market Revenue (USD Billion) Forecast, by Country, 2016-2027
Table 13: Latin America IE4 Permanent Magnet Market Revenue (USD Billion) Forecast, by Segment 1, 2016-2027
Table 14: Latin America Market Revenue (USD Billion) Forecast, by Segment 2, 2016-2027
Table 15: Latin America Market Revenue (USD Billion) Forecast, by Segment 3, 2016-2027
Table 16: Latin America Market Revenue (USD Billion) Forecast, by Country, 2016-2027
Table 17: Asia Pacific IE4 Permanent Magnet Market Revenue (USD Billion) Forecast, by Segment 1, 2016-2027
Table 18: Asia Pacific Market Revenue (USD Billion) Forecast, by Segment 2, 2016-2027
Table 19: Asia Pacific Market Revenue (USD Billion) Forecast, by Segment 3, 2016-2027
Table 20: Asia Pacific Market Revenue (USD Billion) Forecast, by Country, 2016-2027
Table 21: Middle East & Africa IE4 Permanent Magnet Market Revenue (USD Billion) Forecast, by Segment 1, 2016-2027
Table 22: Middle East & Africa Market Revenue (USD Billion) Forecast, by Segment 2, 2016-2027
Table 23: Middle East & Africa Market Revenue (USD Billion) Forecast, by Segment 3, 2016-2027
Table 24: Middle East & Africa Market Revenue (USD Billion) Forecast, by Country, 2016-2027