Global Indoor Positioning and Indoor Navigation Market Opportunities and Forecast 2023-2030

  •   DLR2441
  •   August, 2022
  •   Pages: 120
  •  Global
Indoor Positioning and Indoor Navigation Market Overview

An IPIN system (indoor positioning and Indoor navigation) is a network of devices that wirelessly locate persons and things inside a building. Indoor positioning and indoor navigation (IPIN) solutions improve the accuracy of Wi-Fi-based navigation and positioning, whereas navigation is concerned with finding places in huge office buildings, museums, university buildings, and malls. The global Indoor Positioning and Indoor Navigation market are expected to grow at a sound pace in the times to follow. There is a significant rise in the IPIN market because of technological advancement and cost reduction.
 
Increased acceptance of location-based services (LBS), limitation of GPS utility to outside situations, and increased development of IPIN applications are the primary factors boosting the growth of the Indoor Positioning and Indoor Navigation Market. Additionally, IPIN apps will be in high demand in the next years. Google, Apple, and Nokia, among other key LBS companies, are already churning out apps and making other strategic decisions to capitalize on this new growing market. However, data gathering from many suppliers' sensors and radios, as well as integration with dynamic data, are anticipated to have an impact on the market's growth.
 
On the downside, the indoor environment and capex issues are the major restraint to this market. Apart from this, several governments around the world are looking to gain from IPIN technologies. As a result, they are promoting massive investments in R&D and other advances in this field. This key fact is expected to provide various profitable opportunities for the IPIN market over the forecast period.

Report Metric Details
Market size available for years 2023–2030
Base year considered 2023
Forecast period 2024–2030
Forecast unit Value (USD Million)
Segments covered Technology, Application, Industry, and Region
Regions covered North America (the U.S. and Canada), Europe (UK, Germany, France, Italy, Spain, Russia, Rest of Europe), Asia-Pacific (China, India, Japan, Australia, South East Asia, Rest of Asia Pacific), Latin America and the Middle East and Africa (Brazil, Saudi Arabia, UAE, Rest of LAMEA)
Companies covered Apple Incorporation, Cisco Systems Inc., Broadcom, Ericsson, Microsoft, Google Inc., Nokia Corporation, Qualcomm-Atheros, Motorola Solution Inc., Samsung Electronics Co. Ltd., Stmicroelectronics, Siemens, Spirent Communications PLC, Aisle, Nowon Technologies Pvt Ltd. and Insiteo.


Covid-19 Impact on Indoor Positioning and Indoor Navigation Market

Like many other industries, COVID-19 badly knocked the electronic and semiconductor industries. This unprecedented event has impacted nearly 230 countries in just a few weeks, resulting in the forced shutdown of manufacturing and transportation activities within and across the countries. This has directly affected the overall sector's growth. It is estimated that COVID-19 to leave more than USD 30 billion impacts on the electronics and semiconductor industry. The sector is majorly affected due to transport restrictions on major electronics and semiconductor raw material providers. However, the emerging need for semiconductors in several industries will offer rapid market recovery over the future period.

Indoor Positioning and Indoor Navigation Market Segment Overview


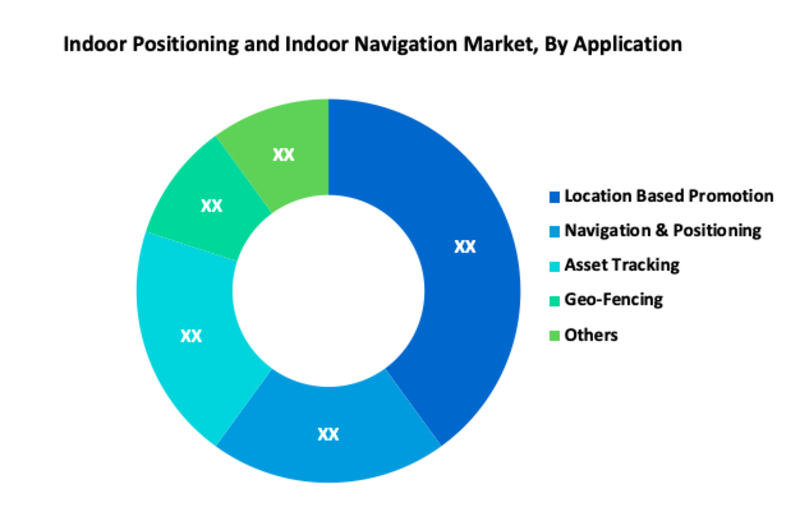
Based on Technology, the Global Positioning System segment holds the largest share in the IPIN market. The global market for satellite navigation systems is being driven by a growing focus on indoor positioning, navigation, and timing (PNT) tools in commercial and government applications, as well as increased demand for indoor positioning and navigation goods and consumer privacy solutions. According to the Application, Location-Based Promotion is the most prominent segment in the market.  The technology is used for determining the location of users and providing location-specific ads on their mobile devices. By the Industry, Retail is the largest segment in the market. Retailers are using digital and offline marketing to boost their sales. Use location-based marketing to drive product sales for higher revenues and profitability.
 
Indoor Positioning and Indoor Navigation Market, By Technology
 
·       Global Positioning System
·       Global Navigation Satellite System
·       Magnetic Positioning
·       Cellular Censors
·       Others
 
Indoor Positioning and Indoor Navigation Market, By Application
 
·       Location Based Promotion
·       Navigation & Positioning
·       Asset Tracking
·       Geo-Fencing
·       Others
 
Indoor Positioning and Indoor Navigation Market, By Industry
 
·       Retail
·       Logistics and Warehouses
·       Healthcare
·       Travel and Hospitality
·       Others
 
Indoor Positioning and Indoor Navigation Regional Overview

In terms of geography, North America dominated the overall market and is expected to continue to do so over the projection period. In this region, the United States is a major contributor to the growth of the indoor positioning and indoor navigation markets. The availability of modern connection wireless technology and indoor technologies in retail, transport, hospitality, healthcare, and public areas is largely responsible for this region's domination. Similarly, Asia-Pacific is predicted to grow at the fastest rate over the projection period, owing to India and China's increasing penetration of indoor Location-Based Services (LBS), connected devices, and Real-Time Location Systems (RTLS) markets.
 
Indoor Positioning and Indoor Navigation Market, By Geography

·       North America (US & Canada)
·       Europe (UK, Germany, France, Italy, Spain, Russia & Rest of Europe)
·       Asia-Pacific (Japan, China, India, Australia, & South Korea, & Rest of Asia-Pacific)
·       LAMEA (Brazil, Saudi Arabia, UAE & Rest of LAMEA)
 
Indoor Positioning and Indoor Navigation Market, Key Players

·       Apple Incorporation
·       Cisco Systems Inc.
·       Broadcom
·       Ericsson
·       Microsoft
·       Google Inc.
·       Nokia Corporation
·       Qualcomm-Atheros
·       Motorola Solution Inc.
·       Samsung Electronics Co. Ltd.
·       Stmicroelectronics
·       Siemens
·       Spirent Communications PLC
·       Aisle
·       Nowon Technologies Pvt Ltd.
·       Insiteo

Frequently Asked Questions (FAQ) :

Q1. What are the driving factors for the Indoor Positioning and Indoor Navigation market?

Increased acceptance of location-based services (LBS), limitation of GPS utility to outside situations, and increased development of IPIN applications are some significant factors that boost the growth of the Indoor Positioning and Indoor Navigation market.

Q2. What are the restraining factors for the Indoor Positioning and Indoor Navigation market?

The indoor environment and capex issues are anticipated to restrain the growth of the Indoor Positioning and Indoor Navigation Market.

Q3. Which Segments are covered in the Indoor Positioning and Indoor Navigation market report?

Technology, Application, Industry, and Region, these segments are covered in the Indoor Positioning and Indoor Navigation market report.

Q4. Which segment is projected to hold the largest share in the Indoor Positioning and Indoor Navigation Market. ?

The Location Based Promotion segment is projected to hold the largest share in the Indoor Positioning and Indoor Navigation Market.

Q5. Which are the prominent players in the Indoor Positioning and Indoor Navigation Market?

Apple Incorporation, Cisco Systems Inc., Broadcom, Ericsson, Microsoft, Google Inc., Nokia Corporation, Qualcomm-Atheros, Motorola Solution Inc., Samsung Electronics Co. Ltd., Stmicroelectronics, Siemens, Spirent Communications PLC, Aisle, Nowon Technologies Pvt Ltd. and Insiteo are some key players in the Indoor Positioning and Indoor Navigation Market.
Indoor Positioning and Indoor Navigation Market Study Global Market Analysis, Insights and Forecast, 2020-2027

    1. Introduction

    • 1.1. Research Scope
    • 1.2. Market Segmentation
    • 1.3. Research Methodology
    • 1.4. Definitions and Assumptions

    2. Executive Summary

      3. Market Dynamics

      • 3.1. Market Drivers
      • 3.2. Market Restraints
      • 3.3. Market Opportunities

      4. Key Insights

      • 4.1. Key Emerging Trends – For Major Countries
      • 4.2. Latest Technological Advancement
      • 4.3. Regulatory Landscape
      • 4.4. Industry SWOT Analysis
      • 4.5. Porters Five Forces Analysis

      5. Global Indoor Positioning and Indoor Navigation Market Analysis (USD Billion), Insights and Forecast, 2020-2027

      • 5.1. Key Findings / Summary
      • 5.2. Market Analysis, Insights and Forecast – By Technology
        • 5.2.1. Global Positioning System
        • 5.2.2. Global Navigation Satellite System
        • 5.2.3. Magnetic Positioning
        • 5.2.4. Cellular Censors
        • 5.2.5. Others
      • 5.3. Market Analysis, Insights and Forecast – By Application
        • 5.3.1. Location Based Promotion
        • 5.3.2. Navigation & Positioning
        • 5.3.3. Asset Tracking
        • 5.3.4. Geo-Fencing
        • 5.3.5. Others
      • 5.4. Market Analysis, Insights and Forecast – By Industry
        • 5.4.1. Retail
        • 5.4.2. Logistics and Warehouses
        • 5.4.3. Healthcare
        • 5.4.4. Travel and Hospitality
        • 5.4.5. Others
      • 5.5. Market Analysis, Insights and Forecast – By Region
        • 5.5.1. North America
        • 5.5.2. Europe
        • 5.5.3. Asia Pacific
        • 5.5.4. Latin America, Middle East and Africa

      6. North America Indoor Positioning and Indoor Navigation Market Analysis (USD Billion), Insights and Forecast, 2020-2027

      • 6.1. Key Findings / Summary
      • 6.2. Market Analysis, Insights and Forecast – By Technology
        • 6.2.1. Global Positioning System
        • 6.2.2. Global Navigation Satellite System
        • 6.2.3. Magnetic Positioning
        • 6.2.4. Cellular Censors
        • 6.2.5. Others
      • 6.3. Market Analysis, Insights and Forecast – By Application
        • 6.3.1. Location Based Promotion
        • 6.3.2. Navigation & Positioning
        • 6.3.3. Asset Tracking
        • 6.3.4. Geo-Fencing
        • 6.3.5. Others
      • 6.4. Market Analysis, Insights and Forecast – By Industry
        • 6.4.1. Retail
        • 6.4.2. Logistics and Warehouses
        • 6.4.3. Healthcare
        • 6.4.4. Travel and Hospitality
        • 6.4.5. Others
      • 6.5. Market Analysis, Insights and Forecast – By Country
        • 6.5.1. U.S.
        • 6.5.2. Canada

      7. Europe Indoor Positioning and Indoor Navigation Market Analysis (USD Billion), Insights and Forecast, 2020-2027

      • 7.1. Key Findings / Summary
      • 7.2. Market Analysis, Insights and Forecast – By Technology
        • 7.2.1. Global Positioning System
        • 7.2.2. Global Navigation Satellite System
        • 7.2.3. Magnetic Positioning
        • 7.2.4. Cellular Censors
        • 7.2.5. Others
      • 7.3. Market Analysis, Insights and Forecast – By Application
        • 7.3.1. Location Based Promotion
        • 7.3.2. Navigation & Positioning
        • 7.3.3. Asset Tracking
        • 7.3.4. Geo-Fencing
        • 7.3.5. Others
      • 7.4. Market Analysis, Insights and Forecast – By Industry
        • 7.4.1. Retail
        • 7.4.2. Logistics and Warehouses
        • 7.4.3. Healthcare
        • 7.4.4. Travel and Hospitality
        • 7.4.5. Others
      • 7.5. Market Analysis, Insights and Forecast – By Country
        • 7.5.1. UK
        • 7.5.2. Germany
        • 7.5.3. France
        • 7.5.4. Italy
        • 7.5.5. Spain
        • 7.5.6. Russia
        • 7.5.7. Rest of Europe

      8. Asia Pacific Indoor Positioning and Indoor Navigation Market Analysis (USD Billion), Insights and Forecast, 2020-2027

      • 8.1. Key Findings / Summary
      • 8.2. Market Analysis, Insights and Forecast – By Technology
        • 8.2.1. Global Positioning System
        • 8.2.2. Global Navigation Satellite System
        • 8.2.3. Magnetic Positioning
        • 8.2.4. Cellular Censors
        • 8.2.5. Others
      • 8.3. Market Analysis, Insights and Forecast – By Application
        • 8.3.1. Location Based Promotion
        • 8.3.2. Navigation & Positioning
        • 8.3.3. Asset Tracking
        • 8.3.4. Geo-Fencing
        • 8.3.5. Others
      • 8.4. Market Analysis, Insights and Forecast – By Industry
        • 8.4.1. Retail
        • 8.4.2. Logistics and Warehouses
        • 8.4.3. Healthcare
        • 8.4.4. Travel and Hospitality
        • 8.4.5. Others
      • 8.5. Market Analysis, Insights and Forecast – By Country
        • 8.5.1. China
        • 8.5.2. India
        • 8.5.3. Japan
        • 8.5.4. Australia
        • 8.5.5. South East Asia
        • 8.5.6. Rest of Asia Pacific

      9. Latin America, Middle East and Africa Indoor Positioning and Indoor Navigation Market Analysis (USD Billion), Insights and Forecast, 2020-2027

      • 9.1. Key Findings / Summary
      • 9.2. Market Analysis, Insights and Forecast – By Technology
        • 9.2.1. Global Positioning System
        • 9.2.2. Global Navigation Satellite System
        • 9.2.3. Magnetic Positioning
        • 9.2.4. Cellular Censors
        • 9.2.5. Others
      • 9.3. Market Analysis, Insights and Forecast – By Application
        • 9.3.1. Location Based Promotion
        • 9.3.2. Navigation & Positioning
        • 9.3.3. Asset Tracking
        • 9.3.4. Geo-Fencing
        • 9.3.5. Others
      • 9.4. Market Analysis, Insights and Forecast – By Industry
        • 9.4.1. Retail
        • 9.4.2. Logistics and Warehouses
        • 9.4.3. Healthcare
        • 9.4.4. Travel and Hospitality
        • 9.4.5. Others
      • 9.5. Market Analysis, Insights and Forecast – By Country
        • 9.5.1. Brazil
        • 9.5.2. Saudi Arabia
        • 9.5.3. UAE
        • 9.5.4. Rest of LAMEA

      10. Competitive Analysis

      • 10.1. Company Market Share Analysis, 2018
      • 10.2. Key Industry Developments
      • 10.3. Company Profile
      • 10.4. Apple Incorporation
        • 10.4.1. Business Overview
        • 10.4.2. Segment 1 & Service Offering
        • 10.4.3. Overall Revenue
        • 10.4.4. Geographic Presence
        • 10.4.5. Recent Development
      *Similar details will be provided for the following companies
      • 10.5. Cisco Systems Inc.
      • 10.6. Broadcom
      • 10.7. Ericsson
      • 10.8. Microsoft
      • 10.9. Google Inc.
      • 10.10. Nokia Corporation
      • 10.11. Qualcomm-Atheros
      • 10.12. Motorola Solution Inc.
      • 10.13. Samsung Electronics Co. Ltd.
      • 10.14. Stmicroelectronics
      • 10.15. Siemens
      • 10.16. Spirent Communications PLC
      • 10.17. Aisle
      List of Figures

      Figure 1: Global Indoor Positioning and Indoor Navigation Market Revenue Breakdown (USD Billion, %) by Region, 2019 & 2027
      Figure 2: Global Market Value Share (%), By Segment 1, 2019 & 2027
      Figure 3: Global Market Forecast (USD Billion), by Sub-Segment 1, 2016-2027
      Figure 4: Global Market Forecast (USD Billion), by Sub-Segment 2, 2016-2027
      Figure 5: Global Market Value Share (%), By Segment 2, 2019 & 2027
      Figure 6: Global Market Forecast (USD Billion), by Sub-Segment 1, 2016-2027
      Figure 7: Global Market Forecast (USD Billion), by Sub-Segment 2, 2016-2027
      Figure 8: Global Market Forecast (USD Billion), by Sub-Segment 3, 2016-2027
      Figure 9: Global Indoor Positioning and Indoor Navigation Market Forecast (USD Billion), by Others, 2016-2027
      Figure 10: Global Market Value Share (%), By Segment 3, 2019 & 2027
      Figure 11: Global Market Forecast (USD Billion), by Sub-Segment 1, 2016-2027
      Figure 12: Global Market Forecast (USD Billion), by Sub-Segment 2, 2016-2027
      Figure 13: Global Market Forecast (USD Billion), by Sub-Segment 3, 2016-2027
      Figure 14: Global Market Forecast (USD Billion), by Others, 2016-2027
      Figure 15: Global Market Value (USD Billion), by Region, 2019 & 2027
      Figure 16: North America Indoor Positioning and Indoor Navigation Market Value Share (%), By Segment 1, 2019 & 2027
      Figure 17: North America Market Forecast (USD Billion), by Sub-Segment 1, 2016-2027
      Figure 18: North America Market Forecast (USD Billion), by Sub-Segment 2, 2016-2027
      Figure 19: North America Market Value Share (%), By Segment 2, 2019 & 2027
      Figure 20: North America Market Forecast (USD Billion), by Sub-Segment 1, 2016-2027
      Figure 21: North America Market Forecast (USD Billion), by Sub-Segment 2, 2016-2027
      Figure 22: North America Market Forecast (USD Billion), by Sub-Segment 3, 2016-2027
      Figure 23: North America Market Forecast (USD Billion), by Others, 2016-2027
      Figure 24: North America Market Value Share (%), By Segment 3, 2019 & 2027
      Figure 25: North America Market Forecast (USD Billion), by Sub-Segment 1, 2016-2027
      Figure 26: North America Market Forecast (USD Billion), by Sub-Segment 2, 2016-2027
      Figure 27: North America Market Forecast (USD Billion), by Sub-Segment 3, 2016-2027
      Figure 28: North America Market Forecast (USD Billion), by Others, 2016-2027
      Figure 29: North America Market Forecast (USD Billion), by U.S., 2016-2027
      Figure 30: North America Market Forecast (USD Billion), by Canada, 2016-2027
      Figure 31: Latin America Indoor Positioning and Indoor Navigation Market Value Share (%), By Segment 1, 2019 & 2027
      Figure 32: Latin America Market Forecast (USD Billion), by Sub-Segment 1, 2016-2027
      Figure 33: Latin America Market Forecast (USD Billion), by Sub-Segment 2, 2016-2027
      Figure 34: Latin America Market Value Share (%), By Segment 2, 2019 & 2027
      Figure 35: Latin America Market Forecast (USD Billion), by Sub-Segment 1, 2016-2027
      Figure 36: Latin America Market Forecast (USD Billion), by Sub-Segment 2, 2016-2027
      Figure 37: Latin America Market Forecast (USD Billion), by Sub-Segment 3, 2016-2027
      Figure 38: Latin America Market Forecast (USD Billion), by Others, 2016-2027
      Figure 39: Latin America Market Value Share (%), By Segment 3, 2019 & 2027
      Figure 40: Latin America Market Forecast (USD Billion), by Sub-Segment 1, 2016-2027
      Figure 41: Latin America Market Forecast (USD Billion), by Sub-Segment 2, 2016-2027
      Figure 42: Latin America Market Forecast (USD Billion), by Sub-Segment 3, 2016-2027
      Figure 43: Latin America Market Forecast (USD Billion), by Others, 2016-2027
      Figure 44: Latin America Market Forecast (USD Billion), by Brazil, 2016-2027
      Figure 45: Latin America Market Forecast (USD Billion), by Mexico, 2016-2027
      Figure 46: Latin America Market Forecast (USD Billion), by Rest of Latin America, 2016-2027
      Figure 47: Europe Indoor Positioning and Indoor Navigation Market Value Share (%), By Segment 1, 2019 & 2027
      Figure 48: Europe Market Forecast (USD Billion), by Sub-Segment 1, 2016-2027
      Figure 49: Europe Market Forecast (USD Billion), by Sub-Segment 2, 2016-2027
      Figure 50: Europe Market Value Share (%), By Segment 2, 2019 & 2027
      Figure 51: Europe Market Forecast (USD Billion), by Sub-Segment 1, 2016-2027
      Figure 52: Europe Market Forecast (USD Billion), by Sub-Segment 2, 2016-2027
      Figure 53: Europe Market Forecast (USD Billion), by Sub-Segment 3, 2016-2027
      Figure 54: Europe Market Forecast (USD Billion), by Others, 2016-2027
      Figure 55: Europe Market Value Share (%), By Segment 3, 2019 & 2027
      Figure 56: Europe Market Forecast (USD Billion), by Sub-Segment 1, 2016-2027
      Figure 57: Europe Market Forecast (USD Billion), by Sub-Segment 2, 2016-2027
      Figure 58: Europe Market Forecast (USD Billion), by Sub-Segment 3, 2016-2027
      Figure 59: Europe Market Forecast (USD Billion), by Others, 2016-2027
      Figure 60: Europe Market Forecast (USD Billion), by U.K., 2016-2027
      Figure 61: Europe Market Forecast (USD Billion), by Germany, 2016-2027
      Figure 62: Europe Market Forecast (USD Billion), by France, 2016-2027
      Figure 63: Europe Market Forecast (USD Billion), by Italy, 2016-2027
      Figure 64: Europe Market Forecast (USD Billion), by Spain, 2016-2027
      Figure 65: Europe Market Forecast (USD Billion), by Russia, 2016-2027
      Figure 66: Europe Market Forecast (USD Billion), by Rest of Europe, 2016-2027
      Figure 67: Asia Pacific Indoor Positioning and Indoor Navigation Market Value Share (%), By Segment 1, 2019 & 2027
      Figure 68: Asia Pacific Market Forecast (USD Billion), by Sub-Segment 1, 2016-2027
      Figure 69: Asia Pacific Market Forecast (USD Billion), by Sub-Segment 2, 2016-2027
      Figure 70: Asia Pacific Market Value Share (%), By Segment 2, 2019 & 2027
      Figure 71: Asia Pacific Market Forecast (USD Billion), by Sub-Segment 1, 2016-2027
      Figure 72: Asia Pacific Market Forecast (USD Billion), by Sub-Segment 2, 2016-2027
      Figure 73: Asia Pacific Market Forecast (USD Billion), by Sub-Segment 3, 2016-2027
      Figure 74: Asia Pacific Market Forecast (USD Billion), by Others, 2016-2027
      Figure 75: Asia Pacific Market Value Share (%), By Segment 3, 2019 & 2027
      Figure 76: Asia Pacific Market Forecast (USD Billion), by Sub-Segment 1, 2016-2027
      Figure 77: Asia Pacific Market Forecast (USD Billion), by Sub-Segment 2, 2016-2027
      Figure 78: Asia Pacific Market Forecast (USD Billion), by Sub-Segment 3, 2016-2027
      Figure 79: Asia Pacific Market Forecast (USD Billion), by Others, 2016-2027
      Figure 80: Asia Pacific Market Forecast (USD Billion), by China, 2016-2027
      Figure 81: Asia Pacific Market Forecast (USD Billion), by India, 2016-2027
      Figure 82: Asia Pacific Market Forecast (USD Billion), by Japan, 2016-2027
      Figure 83: Asia Pacific Market Forecast (USD Billion), by Australia, 2016-2027
      Figure 84: Asia Pacific Market Forecast (USD Billion), by Southeast Asia, 2016-2027
      Figure 85: Asia Pacific Market Forecast (USD Billion), by Rest of Asia Pacific, 2016-2027
      Figure 86: Middle East & Africa Indoor Positioning and Indoor Navigation Market Value Share (%), By Segment 1, 2019 & 2027
      Figure 87: Middle East & Africa Market Forecast (USD Billion), by Sub-Segment 1, 2016-2027
      Figure 88: Middle East & Africa Market Forecast (USD Billion), by Sub-Segment 2, 2016-2027
      Figure 89: Middle East & Africa Market Value Share (%), By Segment 2, 2019 & 2027
      Figure 90: Middle East & Africa Market Forecast (USD Billion), by Sub-Segment 1, 2016-2027
      Figure 91: Middle East & Africa Market Forecast (USD Billion), by Sub-Segment 2, 2016-2027
      Figure 92: Middle East & Africa Market Forecast (USD Billion), by Sub-Segment 3, 2016-2027
      Figure 93: Middle East & Africa Market Forecast (USD Billion), by Others, 2016-2027
      Figure 94: Middle East & Africa Market Value Share (%), By Segment 3, 2019 & 2027
      Figure 95: Middle East & Africa Market Forecast (USD Billion), by Sub-Segment 1, 2016-2027
      Figure 96: Middle East & Africa Market Forecast (USD Billion), by Sub-Segment 2, 2016-2027
      Figure 97: Middle East & Africa Market Forecast (USD Billion), by Sub-Segment 3, 2016-2027
      Figure 98: Middle East & Africa Market Forecast (USD Billion), by Others, 2016-2027
      Figure 99: Middle East & Africa Market Forecast (USD Billion), by GCC, 2016-2027
      Figure 100: Middle East & Africa Market Forecast (USD Billion), by South Africa, 2016-2027
      Figure 101: Middle East & Africa Market Forecast (USD Billion), by Rest of Middle East & Africa, 2016-2027 
      List of Tables
      Table 1: Global Indoor Positioning and Indoor Navigation Market Revenue (USD Billion) Forecast, by Segment 1, 2016-2027
      Table 2: Global Market Revenue (USD Billion) Forecast, by Segment 2, 2016-2027
      Table 3: Global Market Revenue (USD Billion) Forecast, by Segment 3, 2016-2027
      Table 4: Global Market Revenue (USD Billion) Forecast, by Region, 2016-2027
      Table 5: North America Indoor Positioning and Indoor Navigation Market Revenue (USD Billion) Forecast, by Segment 1, 2016-2027
      Table 6: North America Market Revenue (USD Billion) Forecast, by Segment 2, 2016-2027
      Table 7: North America Market Revenue (USD Billion) Forecast, by Segment 3, 2016-2027
      Table 8: North America Market Revenue (USD Billion) Forecast, by Country, 2016-2027
      Table 9: Europe Indoor Positioning and Indoor Navigation Market Revenue (USD Billion) Forecast, by Segment 1, 2016-2027
      Table 10: Europe Market Revenue (USD Billion) Forecast, by Segment 2, 2016-2027
      Table 11: Europe Market Revenue (USD Billion) Forecast, by Segment 3, 2016-2027
      Table 12: Europe Market Revenue (USD Billion) Forecast, by Country, 2016-2027
      Table 13: Latin America Indoor Positioning and Indoor Navigation Market Revenue (USD Billion) Forecast, by Segment 1, 2016-2027
      Table 14: Latin America Market Revenue (USD Billion) Forecast, by Segment 2, 2016-2027
      Table 15: Latin America Market Revenue (USD Billion) Forecast, by Segment 3, 2016-2027
      Table 16: Latin America Market Revenue (USD Billion) Forecast, by Country, 2016-2027
      Table 17: Asia Pacific Indoor Positioning and Indoor Navigation Market Revenue (USD Billion) Forecast, by Segment 1, 2016-2027
      Table 18: Asia Pacific Market Revenue (USD Billion) Forecast, by Segment 2, 2016-2027
      Table 19: Asia Pacific Market Revenue (USD Billion) Forecast, by Segment 3, 2016-2027
      Table 20: Asia Pacific Market Revenue (USD Billion) Forecast, by Country, 2016-2027
      Table 21: Middle East & Africa Indoor Positioning and Indoor Navigation Market Revenue (USD Billion) Forecast, by Segment 1, 2016-2027
      Table 22: Middle East & Africa Market Revenue (USD Billion) Forecast, by Segment 2, 2016-2027
      Table 23: Middle East & Africa Market Revenue (USD Billion) Forecast, by Segment 3, 2016-2027
      Table 24: Middle East & Africa Market Revenue (USD Billion) Forecast, by Country, 2016-2027
      Research Process

      Data Library Research are conducted by industry experts who offer insight on industry structure, market segmentations technology assessment and competitive landscape (CL), and penetration, as well as on emerging trends. Their analysis is based on primary interviews (~ 80%) and secondary research (~ 20%) as well as years of professional expertise in their respective industries. Adding to this, by analysing historical trends and current market positions, our analysts predict where the market will be headed for the next five years. Furthermore, the varying trends of segment & categories geographically presented are also studied and the estimated based on the primary & secondary research.

      In this particular report from the supply side Data Library Research has conducted primary surveys (interviews) with the key level executives (VP, CEO’s, Marketing Director, Business Development Manager and SOFT) of the companies that active & prominent as well as the midsized organization

      FIGURE 1: DLR RESEARH PROCESS

      research-methodology1

      Primary Research

      Extensive primary research was conducted to gain a deeper insight of the market and industry performance. The analysis is based on both primary and secondary research as well as years of professional expertise in the respective industries.

      In addition to analysing current and historical trends, our analysts predict where the market is headed over the next five years.

      It varies by segment for these categories geographically presented in the list of market tables. Speaking about this particular report we have conducted primary surveys (interviews) with the key level executives (VP, CEO’s, Marketing Director, Business Development Manager and many more) of the major players active in the market.

      Secondary Research

      Secondary research was mainly used to collect and identify information useful for the extensive, technical, market-oriented, and Friend’s study of the Global Extra Neutral Alcohol. It was also used to obtain key information about major players, market classification and segmentation according to the industry trends, geographical markets, and developments related to the market and technology perspectives. For this study, analysts have gathered information from various credible sources, such as annual reports, sec filings, journals, white papers, SOFT presentations, and company web sites.

      Market Size Estimation

      Both, top-down and bottom-up approaches were used to estimate and validate the size of the Global market and to estimate the size of various other dependent submarkets in the overall Extra Neutral Alcohol. The key players in the market were identified through secondary research and their market contributions in the respective geographies were determined through primary and secondary research.

      Forecast Model

      research-methodology2