Industrial LCD Display Modules Market Overview and Analysis
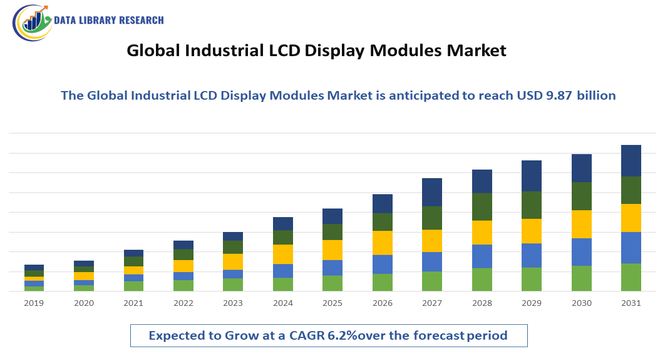
- The Global Industrial LCD Display Modules Market is valued at USD 5.87 billion in 2025 and reaching USD 9.87 billion in 2032, forecasted to grow at a Compound Annual Growth Rate (CAGR) generally expected to be around 6.2% over the forecast period, 2025-2032.
Get Complete Analysis Of The Report - Download Updated Free Sample PDF
The growth of the Global Industrial LCD Display Modules Market is primarily driven by the increasing demand for high-performance, durable, and energy-efficient display solutions across industrial applications such as manufacturing, healthcare, automotive, and aerospace. Industrial LCD modules offer enhanced visibility, robustness against harsh environments, and long operational lifespans, making them ideal for control panels, instrumentation, and monitoring systems.
Industrial LCD Display Modules Market Latest Trends
The Global Industrial LCD Display Modules Market is witnessing several key trends driven by technological innovation and evolving industrial requirements. There is a growing adoption of high-resolution, touch-enabled, and sunlight-readable LCD modules to improve usability and visibility in diverse industrial environments. The market is also seeing increased integration of flexible displays, OLED hybrid modules, and low-power technologies to enhance performance and reduce energy consumption. Additionally, demand for customizable and ruggedized displays capable of withstanding extreme temperatures, vibrations, and dust is rising. The expansion of Industry 4.0, automation, and smart manufacturing is further shaping market dynamics.
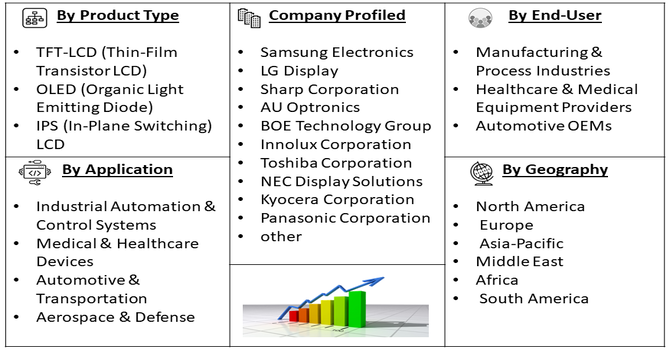
Segmentation: Global Industrial LCD Display Modules Market is segmented by Display Type (TFT-LCD (Thin-Film Transistor LCD), OLED (Organic Light Emitting Diode), IPS (In-Plane Switching) LCD), Screen Size (Below 5 Inches, 5 to 10 Inches, Above 10 Inches), Application (Industrial Automation & Control Systems, Medical & Healthcare Devices, Automotive & Transportation, Aerospace & Defense), End-User (Manufacturing & Process Industries, Healthcare & Medical Equipment Providers, Automotive OEMs), and Geography (North America, Europe, Asia-Pacific, Middle East and Africa, and South America). The report provides the value (in USD million) for the above segments.
For Detailed Market Segmentation - Get a Free Sample PDF
Market Drivers:
- Growing Industrial Automation and Smart Manufacturing
The increasing adoption of industrial automation, smart factories, and Industry 4.0 technologies is a major driver for the industrial LCD display modules market. Modern manufacturing plants and process industries require real-time monitoring, control, and human-machine interfaces (HMIs), which rely on high-performance display modules. Industrial LCDs provide accurate visualization of critical data, operational metrics, and process parameters, enabling operators to make timely decisions, reduce errors, and improve productivity. As industries continue to embrace automation and digitalization, the demand for reliable, durable, and high-resolution LCD modules is rising significantly.
- Demand for Durable and High-Performance Displays
Industrial environments often involve harsh conditions, such as extreme temperatures, dust, vibrations, and exposure to chemicals. This drives the need for rugged, durable, and energy-efficient LCD display modules that can maintain performance under challenging conditions. Applications in automotive, aerospace, energy, and healthcare sectors require displays that offer high brightness, sunlight readability, wide viewing angles, and long operational lifespans. The growing focus on reliability, precision, and safety in industrial operations is thus fueling the adoption of advanced LCD display modules across multiple end-user segments globally.
Market Restraints:
- High Cost of Advanced Industrial LCD Modules
One of the major restraints is the high cost associated with advanced industrial LCD modules, particularly those with features like high resolution, touch functionality, sunlight readability, and ruggedized designs. These premium modules require sophisticated manufacturing processes and materials to ensure durability and performance in harsh industrial environments. The elevated cost can be a barrier for small- and medium-sized enterprises (SMEs) or cost-sensitive industrial projects, limiting widespread adoption despite their technological advantages.
Socioeconomic Impact on Industrial LCD Display Modules Market
The global industrial LCD display modules market has had a substantial socioeconomic impact by enhancing operational efficiency, safety, and automation across industries such as manufacturing, automotive, healthcare, and energy. Adoption of high-performance displays has improved real-time monitoring, process control, and decision-making, reducing errors and operational costs. The market has generated employment in design, manufacturing, and technical support while fostering innovation in display technologies, including touchscreen interfaces and ruggedized solutions. Improved industrial visualization has contributed to safer work environments and higher productivity. Additionally, increased accessibility to advanced display solutions has supported industrial modernization, technological skill development, and overall economic growth, benefiting both businesses and societies worldwide.
Segmental Analysis:
- TFT-LCD (Thin-Film Transistor LCD) segment is expected to witness the highest growth over the forecast period
TFT-LCD modules are widely used in industrial applications due to their high resolution, fast response times, and wide viewing angles. These displays provide clear and accurate visualization of critical data in environments such as manufacturing plants, control rooms, and process monitoring systems. The robustness and reliability of TFT-LCD technology make it suitable for continuous operation in demanding industrial settings, supporting real-time monitoring and human-machine interface (HMI) applications.
- 5 to 10 Inches segment is expected to witness the highest growth over the forecast period
Displays in the 5 to 10-inch range are popular in industrial applications for control panels, instrumentation, and operator interfaces, offering a balance between compact size and sufficient display area. They allow operators to monitor processes efficiently without occupying excessive space and are ideal for modular HMI systems, medical devices, and automotive dashboards where medium-sized displays provide both visibility and convenience.
- Industrial Automation & Control Systems segment is expected to witness the highest growth over the forecast period
Industrial automation and control systems are a major application segment for LCD display modules. These systems rely on highly accurate and responsive displays for monitoring machinery, process parameters, and safety metrics. The adoption of Industry 4.0 technologies, IoT-enabled equipment, and smart factory solutions is driving the demand for industrial LCDs that can handle real-time data visualization, withstand harsh environments, and integrate seamlessly with automated systems.
- Manufacturing & Process Industries segment is expected to witness the highest growth over the forecast period
Manufacturing and process industries are leading end-users of industrial LCD modules, using them in control rooms, production lines, and equipment interfaces. These industries require displays that are durable, energy-efficient, and capable of providing clear, accurate information under continuous operation. The rising adoption of automated production systems, predictive maintenance, and process optimization technologies is further driving the integration of advanced LCD modules in these sectors.
- North America segment is expected to witness the highest growth over the forecast period
North America is expected to witness significant growth in industrial LCD display modules due to advanced industrial infrastructure, high adoption of automation technologies, and robust manufacturing and healthcare sectors. For instance, in April 2025, Zeon Corporation announced a 20% increase in production capacity for phase-difference films used in large LCDs, raising its annual output to 26.4 million square meters. This expansion aims to meet growing demand and strengthen Zeon’s position in the advanced display materials market.
The region benefits from technological innovation, stringent quality standards, and strong demand for smart factory solutions, which drive the adoption of durable and high-performance LCD modules for industrial applications. Investments in IoT, AI, and connected systems also contribute to North America’s leading position in the market. For instance, in November 2024, AMETEK acquired Virtek Vision International for USD 40 million, enhancing its portfolio with AI-driven projection technologies. This acquisition strengthens AMETEK’s factory inspection capabilities by integrating advanced AI solutions to improve precision and efficiency in manufacturing quality control processes.
Thus, together these factors are driving the growth of this market in this region.
| Report Matrics |
Details |
| Market Size Value |
USD 9.87 billion |
| Growth Rate |
CAGR of 6.2 % |
| Forecast |
2026-2033 |
| Historical data |
2021-2024 |
| Base Year |
2025 |
| Report Coverage |
Forecasted revenue, company rating, competitive environment, growth drivers, and trends |
| Segment Coverage |
Type, Application, End-User, Geography |
| Regional Scope |
North America, Europe, Asia Pacific, Middle East |
| Customized scope |
Free customization of reports (With 3 months Analysis Support ) |
| To Learn More About This Report |
Request a Free Sample Copy |
Industrial LCD Display Modules Market Competitive Landscape:
The competitive landscape of the Global Industrial LCD Display Modules Market is characterized by the presence of established electronics and display manufacturers, as well as specialized industrial component providers. Companies compete on product performance, display resolution, durability, customization, and energy efficiency, while also focusing on R&D investments, strategic partnerships, and expansion into emerging industrial applications such as automation, healthcare, automotive, and aerospace. The market is moderately consolidated, with leading players leveraging technological innovation and strong distribution networks to maintain market share. Growing demand for rugged, reliable, and high-performance displays is intensifying competition globally.
Key Players:
- Samsung Electronics
- LG Display
- Sharp Corporation
- AU Optronics
- BOE Technology Group
- Innolux Corporation
- Toshiba Corporation
- NEC Display Solutions
- Kyocera Corporation
- Panasonic Corporation
- HannStar Display Corporation
- CPT Technology Group
- Optrex Corporation
- Eizo Corporation
- Truly International Holdings
- Tianma Microelectronics
- Universal Display Corporation
- Wintech Industrial
- ViewSonic Corporation
- Flex Ltd.
Recent Development
- In April 2025, AUO had unveiled its latest display innovations, including the Smart Cockpit 2025 with Micro LED technology, offering transparency, scalability, and flexibility for next-generation automotive HMI systems. The company also showcased energy-efficient Field Sequential Color LCDs and a 16-inch Security Protection Display featuring an invisible watermark for enhanced public data security. In collaboration with subsidiary BHTC, AUO presented advanced Haptifold foldable displays with force-sensitive functionality and high-brightness Holographic Head-Up Displays, highlighting its commitment to smart, sustainable, and secure display solutions shaping the future of mobility and user interaction.
- In February 2025, Samsung Display and Intel had signed a Memorandum of Understanding (MoU) to jointly develop next-generation IT display solutions tailored for Intel’s advanced processors, targeting high-performance AI PCs and premium laptops. The collaboration combined Samsung’s OLED expertise with Intel’s system-on-a-chip technology to enhance visual quality and energy efficiency. Both companies had planned to showcase their innovations at global events, including Korea’s AI Media Art Exhibition, aiming to drive technological advancements and market growth in the emerging AI PC segment.
Frequently Asked Questions (FAQ) :
Q1. What are the main growth-driving factors for this market?
The primary driver is the rapid global adoption of Industry 4.0 and factory automation. Increased demand for rugged Human-Machine Interfaces (HMIs) and control panels across sectors like manufacturing, oil and gas, and automotive requires durable, high-performance displays. Low power consumption and cost-effectiveness of LCDs further stimulate adoption.
Q2. What are the main restraining factors for this market?
The market is restrained by strong competition from newer display technologies like OLED and Micro-LED, which offer superior contrast and brightness. Additionally, the industrial sector faces high initial installation costs for advanced display systems and significant supply chain vulnerabilities due to the market's high production concentration in East Asia.
Q3. Which segment is expected to witness high growth?
The TFT-LCD segment is expected to witness the highest growth over the forecast period due to its superior display clarity, fast response times, and wide viewing angles. Increasing adoption in industrial automation, medical devices, and automotive applications has driven demand, supporting technological advancements and market expansion globally.
Q4. Who are the top major players for this market?
The competitive landscape is led by major display panel manufacturers, many based in Asia. Top players include Samsung Display, LG Display, BOE Technology Group, Sharp Corporation, and Innolux Corporation. Specialized industrial display providers, such as Advantech, also hold significant market share by focusing on ruggedized, high-end applications.
Q5. Which country is the largest player?
North America is expected to witness the highest growth over the forecast period owing to its advanced manufacturing infrastructure, high adoption of industrial automation, and strong demand for innovative display solutions. Supportive regulations, extensive R&D investments, and the presence of leading technology companies have further propelled market growth in the region.
List of Figures
Figure 1: Global Industrial LCD Display Modules Market Revenue Breakdown (USD Billion, %) by Region, 2022 & 2029
Figure 2: Global Industrial LCD Display Modules Market Value Share (%), By Segment 1, 2022 & 2029
Figure 3: Global Industrial LCD Display Modules Market Forecast (USD Billion), by Sub-Segment 1, 2018-2029
Figure 4: Global Industrial LCD Display Modules Market Forecast (USD Billion), by Sub-Segment 2, 2018-2029
Figure 5: Global Industrial LCD Display Modules Market Value Share (%), By Segment 2, 2022 & 2029
Figure 6: Global Industrial LCD Display Modules Market Forecast (USD Billion), by Sub-Segment 1, 2018-2029
Figure 7: Global Industrial LCD Display Modules Market Forecast (USD Billion), by Sub-Segment 2, 2018-2029
Figure 8: Global Industrial LCD Display Modules Market Forecast (USD Billion), by Sub-Segment 3, 2018-2029
Figure 9: Global Industrial LCD Display Modules Market Forecast (USD Billion), by Others, 2018-2029
Figure 10: Global Industrial LCD Display Modules Market Value Share (%), By Segment 3, 2022 & 2029
Figure 11: Global Industrial LCD Display Modules Market Forecast (USD Billion), by Sub-Segment 1, 2018-2029
Figure 12: Global Industrial LCD Display Modules Market Forecast (USD Billion), by Sub-Segment 2, 2018-2029
Figure 13: Global Industrial LCD Display Modules Market Forecast (USD Billion), by Sub-Segment 3, 2018-2029
Figure 14: Global Industrial LCD Display Modules Market Forecast (USD Billion), by Others, 2018-2029
Figure 15: Global Industrial LCD Display Modules Market Value (USD Billion), by Region, 2022 & 2029
Figure 16: North America Industrial LCD Display Modules Market Value Share (%), By Segment 1, 2022 & 2029
Figure 17: North America Industrial LCD Display Modules Market Forecast (USD Billion), by Sub-Segment 1, 2018-2029
Figure 18: North America Industrial LCD Display Modules Market Forecast (USD Billion), by Sub-Segment 2, 2018-2029
Figure 19: North America Industrial LCD Display Modules Market Value Share (%), By Segment 2, 2022 & 2029
Figure 20: North America Industrial LCD Display Modules Market Forecast (USD Billion), by Sub-Segment 1, 2018-2029
Figure 21: North America Industrial LCD Display Modules Market Forecast (USD Billion), by Sub-Segment 2, 2018-2029
Figure 22: North America Industrial LCD Display Modules Market Forecast (USD Billion), by Sub-Segment 3, 2018-2029
Figure 23: North America Industrial LCD Display Modules Market Forecast (USD Billion), by Others, 2018-2029
Figure 24: North America Industrial LCD Display Modules Market Value Share (%), By Segment 3, 2022 & 2029
Figure 25: North America Industrial LCD Display Modules Market Forecast (USD Billion), by Sub-Segment 1, 2018-2029
Figure 26: North America Industrial LCD Display Modules Market Forecast (USD Billion), by Sub-Segment 2, 2018-2029
Figure 27: North America Industrial LCD Display Modules Market Forecast (USD Billion), by Sub-Segment 3, 2018-2029
Figure 28: North America Industrial LCD Display Modules Market Forecast (USD Billion), by Others, 2018-2029
Figure 29: North America Industrial LCD Display Modules Market Forecast (USD Billion), by U.S., 2018-2029
Figure 30: North America Industrial LCD Display Modules Market Forecast (USD Billion), by Canada, 2018-2029
Figure 31: Latin America Industrial LCD Display Modules Market Value Share (%), By Segment 1, 2022 & 2029
Figure 32: Latin America Industrial LCD Display Modules Market Forecast (USD Billion), by Sub-Segment 1, 2018-2029
Figure 33: Latin America Industrial LCD Display Modules Market Forecast (USD Billion), by Sub-Segment 2, 2018-2029
Figure 34: Latin America Industrial LCD Display Modules Market Value Share (%), By Segment 2, 2022 & 2029
Figure 35: Latin America Industrial LCD Display Modules Market Forecast (USD Billion), by Sub-Segment 1, 2018-2029
Figure 36: Latin America Industrial LCD Display Modules Market Forecast (USD Billion), by Sub-Segment 2, 2018-2029
Figure 37: Latin America Industrial LCD Display Modules Market Forecast (USD Billion), by Sub-Segment 3, 2018-2029
Figure 38: Latin America Industrial LCD Display Modules Market Forecast (USD Billion), by Others, 2018-2029
Figure 39: Latin America Industrial LCD Display Modules Market Value Share (%), By Segment 3, 2022 & 2029
Figure 40: Latin America Industrial LCD Display Modules Market Forecast (USD Billion), by Sub-Segment 1, 2018-2029
Figure 41: Latin America Industrial LCD Display Modules Market Forecast (USD Billion), by Sub-Segment 2, 2018-2029
Figure 42: Latin America Industrial LCD Display Modules Market Forecast (USD Billion), by Sub-Segment 3, 2018-2029
Figure 43: Latin America Industrial LCD Display Modules Market Forecast (USD Billion), by Others, 2018-2029
Figure 44: Latin America Industrial LCD Display Modules Market Forecast (USD Billion), by Brazil, 2018-2029
Figure 45: Latin America Industrial LCD Display Modules Market Forecast (USD Billion), by Mexico, 2018-2029
Figure 46: Latin America Industrial LCD Display Modules Market Forecast (USD Billion), by Rest of Latin America, 2018-2029
Figure 47: Europe Industrial LCD Display Modules Market Value Share (%), By Segment 1, 2022 & 2029
Figure 48: Europe Industrial LCD Display Modules Market Forecast (USD Billion), by Sub-Segment 1, 2018-2029
Figure 49: Europe Industrial LCD Display Modules Market Forecast (USD Billion), by Sub-Segment 2, 2018-2029
Figure 50: Europe Industrial LCD Display Modules Market Value Share (%), By Segment 2, 2022 & 2029
Figure 51: Europe Industrial LCD Display Modules Market Forecast (USD Billion), by Sub-Segment 1, 2018-2029
Figure 52: Europe Industrial LCD Display Modules Market Forecast (USD Billion), by Sub-Segment 2, 2018-2029
Figure 53: Europe Industrial LCD Display Modules Market Forecast (USD Billion), by Sub-Segment 3, 2018-2029
Figure 54: Europe Industrial LCD Display Modules Market Forecast (USD Billion), by Others, 2018-2029
Figure 55: Europe Industrial LCD Display Modules Market Value Share (%), By Segment 3, 2022 & 2029
Figure 56: Europe Industrial LCD Display Modules Market Forecast (USD Billion), by Sub-Segment 1, 2018-2029
Figure 57: Europe Industrial LCD Display Modules Market Forecast (USD Billion), by Sub-Segment 2, 2018-2029
Figure 58: Europe Industrial LCD Display Modules Market Forecast (USD Billion), by Sub-Segment 3, 2018-2029
Figure 59: Europe Industrial LCD Display Modules Market Forecast (USD Billion), by Others, 2018-2029
Figure 60: Europe Industrial LCD Display Modules Market Forecast (USD Billion), by U.K., 2018-2029
Figure 61: Europe Industrial LCD Display Modules Market Forecast (USD Billion), by Germany, 2018-2029
Figure 62: Europe Industrial LCD Display Modules Market Forecast (USD Billion), by France, 2018-2029
Figure 63: Europe Industrial LCD Display Modules Market Forecast (USD Billion), by Italy, 2018-2029
Figure 64: Europe Industrial LCD Display Modules Market Forecast (USD Billion), by Spain, 2018-2029
Figure 65: Europe Industrial LCD Display Modules Market Forecast (USD Billion), by Russia, 2018-2029
Figure 66: Europe Industrial LCD Display Modules Market Forecast (USD Billion), by Rest of Europe, 2018-2029
Figure 67: Asia Pacific Industrial LCD Display Modules Market Value Share (%), By Segment 1, 2022 & 2029
Figure 68: Asia Pacific Industrial LCD Display Modules Market Forecast (USD Billion), by Sub-Segment 1, 2018-2029
Figure 69: Asia Pacific Industrial LCD Display Modules Market Forecast (USD Billion), by Sub-Segment 2, 2018-2029
Figure 70: Asia Pacific Industrial LCD Display Modules Market Value Share (%), By Segment 2, 2022 & 2029
Figure 71: Asia Pacific Industrial LCD Display Modules Market Forecast (USD Billion), by Sub-Segment 1, 2018-2029
Figure 72: Asia Pacific Industrial LCD Display Modules Market Forecast (USD Billion), by Sub-Segment 2, 2018-2029
Figure 73: Asia Pacific Industrial LCD Display Modules Market Forecast (USD Billion), by Sub-Segment 3, 2018-2029
Figure 74: Asia Pacific Industrial LCD Display Modules Market Forecast (USD Billion), by Others, 2018-2029
Figure 75: Asia Pacific Industrial LCD Display Modules Market Value Share (%), By Segment 3, 2022 & 2029
Figure 76: Asia Pacific Industrial LCD Display Modules Market Forecast (USD Billion), by Sub-Segment 1, 2018-2029
Figure 77: Asia Pacific Industrial LCD Display Modules Market Forecast (USD Billion), by Sub-Segment 2, 2018-2029
Figure 78: Asia Pacific Industrial LCD Display Modules Market Forecast (USD Billion), by Sub-Segment 3, 2018-2029
Figure 79: Asia Pacific Industrial LCD Display Modules Market Forecast (USD Billion), by Others, 2018-2029
Figure 80: Asia Pacific Industrial LCD Display Modules Market Forecast (USD Billion), by China, 2018-2029
Figure 81: Asia Pacific Industrial LCD Display Modules Market Forecast (USD Billion), by India, 2018-2029
Figure 82: Asia Pacific Industrial LCD Display Modules Market Forecast (USD Billion), by Japan, 2018-2029
Figure 83: Asia Pacific Industrial LCD Display Modules Market Forecast (USD Billion), by Australia, 2018-2029
Figure 84: Asia Pacific Industrial LCD Display Modules Market Forecast (USD Billion), by Southeast Asia, 2018-2029
Figure 85: Asia Pacific Industrial LCD Display Modules Market Forecast (USD Billion), by Rest of Asia Pacific, 2018-2029
Figure 86: Middle East & Africa Industrial LCD Display Modules Market Value Share (%), By Segment 1, 2022 & 2029
Figure 87: Middle East & Africa Industrial LCD Display Modules Market Forecast (USD Billion), by Sub-Segment 1, 2018-2029
Figure 88: Middle East & Africa Industrial LCD Display Modules Market Forecast (USD Billion), by Sub-Segment 2, 2018-2029
Figure 89: Middle East & Africa Industrial LCD Display Modules Market Value Share (%), By Segment 2, 2022 & 2029
Figure 90: Middle East & Africa Industrial LCD Display Modules Market Forecast (USD Billion), by Sub-Segment 1, 2018-2029
Figure 91: Middle East & Africa Industrial LCD Display Modules Market Forecast (USD Billion), by Sub-Segment 2, 2018-2029
Figure 92: Middle East & Africa Industrial LCD Display Modules Market Forecast (USD Billion), by Sub-Segment 3, 2018-2029
Figure 93: Middle East & Africa Industrial LCD Display Modules Market Forecast (USD Billion), by Others, 2018-2029
Figure 94: Middle East & Africa Industrial LCD Display Modules Market Value Share (%), By Segment 3, 2022 & 2029
Figure 95: Middle East & Africa Industrial LCD Display Modules Market Forecast (USD Billion), by Sub-Segment 1, 2018-2029
Figure 96: Middle East & Africa Industrial LCD Display Modules Market Forecast (USD Billion), by Sub-Segment 2, 2018-2029
Figure 97: Middle East & Africa Industrial LCD Display Modules Market Forecast (USD Billion), by Sub-Segment 3, 2018-2029
Figure 98: Middle East & Africa Industrial LCD Display Modules Market Forecast (USD Billion), by Others, 2018-2029
Figure 99: Middle East & Africa Industrial LCD Display Modules Market Forecast (USD Billion), by GCC, 2018-2029
Figure 100: Middle East & Africa Industrial LCD Display Modules Market Forecast (USD Billion), by South Africa, 2018-2029
Figure 101: Middle East & Africa Industrial LCD Display Modules Market Forecast (USD Billion), by Rest of Middle East & Africa, 2018-2029
List of Tables
Table 1: Global Industrial LCD Display Modules Market Revenue (USD Billion) Forecast, by Segment 1, 2018-2029
Table 2: Global Industrial LCD Display Modules Market Revenue (USD Billion) Forecast, by Segment 2, 2018-2029
Table 3: Global Industrial LCD Display Modules Market Revenue (USD Billion) Forecast, by Segment 3, 2018-2029
Table 4: Global Industrial LCD Display Modules Market Revenue (USD Billion) Forecast, by Region, 2018-2029
Table 5: North America Industrial LCD Display Modules Market Revenue (USD Billion) Forecast, by Segment 1, 2018-2029
Table 6: North America Industrial LCD Display Modules Market Revenue (USD Billion) Forecast, by Segment 2, 2018-2029
Table 7: North America Industrial LCD Display Modules Market Revenue (USD Billion) Forecast, by Segment 3, 2018-2029
Table 8: North America Industrial LCD Display Modules Market Revenue (USD Billion) Forecast, by Country, 2018-2029
Table 9: Europe Industrial LCD Display Modules Market Revenue (USD Billion) Forecast, by Segment 1, 2018-2029
Table 10: Europe Industrial LCD Display Modules Market Revenue (USD Billion) Forecast, by Segment 2, 2018-2029
Table 11: Europe Industrial LCD Display Modules Market Revenue (USD Billion) Forecast, by Segment 3, 2018-2029
Table 12: Europe Industrial LCD Display Modules Market Revenue (USD Billion) Forecast, by Country, 2018-2029
Table 13: Latin America Industrial LCD Display Modules Market Revenue (USD Billion) Forecast, by Segment 1, 2018-2029
Table 14: Latin America Industrial LCD Display Modules Market Revenue (USD Billion) Forecast, by Segment 2, 2018-2029
Table 15: Latin America Industrial LCD Display Modules Market Revenue (USD Billion) Forecast, by Segment 3, 2018-2029
Table 16: Latin America Industrial LCD Display Modules Market Revenue (USD Billion) Forecast, by Country, 2018-2029
Table 17: Asia Pacific Industrial LCD Display Modules Market Revenue (USD Billion) Forecast, by Segment 1, 2018-2029
Table 18: Asia Pacific Industrial LCD Display Modules Market Revenue (USD Billion) Forecast, by Segment 2, 2018-2029
Table 19: Asia Pacific Industrial LCD Display Modules Market Revenue (USD Billion) Forecast, by Segment 3, 2018-2029
Table 20: Asia Pacific Industrial LCD Display Modules Market Revenue (USD Billion) Forecast, by Country, 2018-2029
Table 21: Middle East & Africa Industrial LCD Display Modules Market Revenue (USD Billion) Forecast, by Segment 1, 2018-2029
Table 22: Middle East & Africa Industrial LCD Display Modules Market Revenue (USD Billion) Forecast, by Segment 2, 2018-2029
Table 23: Middle East & Africa Industrial LCD Display Modules Market Revenue (USD Billion) Forecast, by Segment 3, 2018-2029
Table 24: Middle East & Africa Industrial LCD Display Modules Market Revenue (USD Billion) Forecast, by Country, 2018-2029
Research Process
Data Library Research are conducted by industry experts who offer insight on
industry structure, market segmentations technology assessment and competitive landscape (CL), and penetration, as well as on emerging trends. Their analysis is based on primary interviews (~ 80%) and secondary research (~ 20%) as well as years of professional expertise in their respective industries. Adding to this, by analysing historical trends and current market positions, our analysts predict where the market will be headed for the next five years. Furthermore, the varying trends of segment & categories geographically presented are also studied and the estimated based on the primary & secondary research.
In this particular report from the supply side Data Library Research has conducted primary surveys (interviews) with the key level executives (VP, CEO’s, Marketing Director, Business Development Manager
and SOFT) of the companies that active & prominent as well as the midsized organization
FIGURE 1: DLR RESEARH PROCESS
![research-methodology1]()
Primary Research
Extensive primary research was conducted to gain a deeper insight of the market and industry performance. The analysis is based on both primary and secondary research as well as years of professional expertise in the respective industries.
In addition to analysing current and historical trends, our analysts predict where the market is headed over the next five years.
It varies by segment for these categories geographically presented in the list of market tables. Speaking about this particular report we have conducted primary surveys (interviews) with the key level executives (VP, CEO’s, Marketing Director, Business Development Manager and many more) of the major players active in the market.
Secondary Research
Secondary research was mainly used to collect and identify information useful for the extensive, technical, market-oriented, and Friend’s study of the Global Extra Neutral Alcohol. It was also used to obtain key information about major players, market classification and segmentation according to the industry trends, geographical markets, and developments related to the market and technology perspectives. For this study, analysts have gathered information from various credible sources, such as annual reports, sec filings, journals, white papers, SOFT presentations, and company web sites.
Market Size Estimation
Both, top-down and bottom-up approaches were used to estimate and validate the size of the Global market and to estimate the size of various other dependent submarkets in the overall Extra Neutral Alcohol. The key players in the market were identified through secondary research and their market contributions in the respective geographies were determined through primary and secondary research.
Forecast Model
![research-methodology2]()