Operating Room Integration Systems Market Overview
An operating room integration system has various advantages compared to traditional non-integrated operating rooms. Cables and wires that would normally be left on the floor can be routed via the articulating arms of ceiling-mounted booms and lights, for example. A computer allows an operator to handle many equipment from a single location, reducing unnecessary navigation in the operating room; some systems also include voice recognition. As a result, a surgeon wearing a wireless headset with a microphone can remotely manage the complete system.
Currently, traditional operating rooms are being replaced by hybrid operating rooms that incorporate a variety of imaging devices, endoscopic systems, minimally invasive surgery tools, and robot-assisted procedures. The operating room integration systems market is predicted to develop at an average rate during the forecast period, owing to factors such as rising demand for hybrid and integrated operating rooms. In developed regions, such as the United States and Western Europe, there is a high demand for integrated and hybrid operating rooms. Integrated operating rooms are also becoming more popular in emerging markets such as China, India, Brazil, and Middle Eastern countries.
In addition, the increasing complexity of modern ORs, as well as technology improvements, are expected to increase demand for these systems in the near future. In the coming years, the market is projected to be driven by the need for improved patient safety and operating room efficiency.
| Report Metric |
Details |
| Market size available for years |
2023–2030 |
| Base year considered |
2023 |
| Forecast period |
2024–2030 |
| Forecast unit |
Value (USD Million) |
| Segments covered |
Devices, Application, and Region. |
| Regions covered |
North America (the U.S. and Canada), Europe (UK, Germany, France, Italy, Spain, Russia, Rest of Europe), Asia-Pacific (China, India, Japan, Australia, South East Asia, Rest of Asia Pacific), Latin America and the Middle East and Africa (Brazil, Saudi Arabia, UAE, Rest of LAMEA) |
| Companies covered |
Stryker Corporation, Karl Storz GmbH & Co. KG, Steris Corporation, Skytron, LLC, Getinge Group. |
Covid-19 Impact on Operating Room Integration Systems Market
In addition, the current Operating Room Integration Systems Market study offers a detailed analysis of the current COVID-19 pandemic impact on the market growth and its influence on the future growth of the Operating Room Integration Systems Market. The recently published report demonstrates the elevation in the demand for the healthcare sector. The healthcare manufacturers have experienced long term as well as short term effect which includes supply shortages, panic buying, and stocking, regulation changes as short-term whereas approval delays and possible trend variations in consumption could be perceived as long-term impacts of COVID-19 on the health and pharmaceutical market.
The increasing need for a cure has pushed vaccine research and manufacturers to the limit. In addition to this, panic conditions have already spurred the demand for many healthcare products and services which are discussed in detail in this report. Moreover, the impact of COVID-19 on overall market revenue for the base year 2020 and its projection up to 2027 is provided in detail in this report.
Operating Room Integration Systems Market Segment Overview
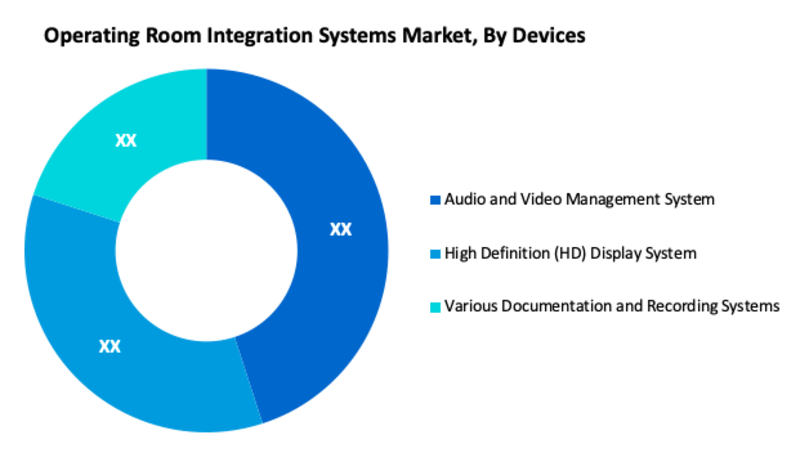
According to Devices, the Audio and Video Management System is one of the largest segments of the global Operating Room Integration Systems Market. A video management system (VMS) combines software and hardware to allow users to automatically monitor activities from any number of surveillance (CCTV) cameras, alarms, or sensors. Cameras, encoders for analogue camera systems, and servers for video processing and storage are all examples of VMS hardware. VMS software keeps track of all systems and provides a quick overview of any potential dangers, threats, events, or planned tasks.
Operating Room Integration Systems Market, By Devices
· Audio and Video Management System
· High Definition (HD) Display System
· Various Documentation and Recording Systems
Operating Room Integration Systems Market, By Application
· Therapeutic
· Diagnostic
Operating Room Integration Systems Market Regional Overview
In terms of geography, the global Operating Room Integration Systems market is classified into North America, South America, Europe, Asia Pacific and Middle East & Africa. North America and Europe have a substantial proportion of the global operating room integration systems market This is because of the availability of modern technology and health-care infrastructure. During the projected period, the Asia Pacific integrated operating rooms market is expected to grow at a quick pace. The primary drivers propelling the market in the region are an increase in health-care spending and an increase in the number of surgeries. Latin America's and the Middle East's and Africa's markets are also expected to rise rapidly. Market growth in these regions is propelled by increased awareness of various modern surgical technologies and procedures.
Operating Room Integration Systems Market, By Geography
· North America (US & Canada)
· Europe (UK, Germany, France, Italy, Spain, Russia & Rest of Europe)
· Asia-Pacific (Japan, China, India, Australia, & South Korea, & Rest of Asia-Pacific)
· LAMEA (Brazil, Saudi Arabia, UAE & Rest of LAMEA)
Operating Room Integration Systems Market, Key Players
· Stryker Corporation
· Karl Storz GmbH & Co. KG
· Steris Corporation
· Skytron, LLC
· Getinge Group
Frequently Asked Questions (FAQ) :
Q1. What are the driving factors for the global Operating Room Integration Systems market?
In the coming years, the market is projected to be driven by the need for improved patient safety and operating room efficiency
Q2. Which Segments are covered in the global Operating Room Integration Systems market report?
Devices, Application, and Region. these segments are covered in the global Operating Room Integration Systems market report.
Q3. Which segment is projected to hold the largest share in the global Operating Room Integration Systems market?
Audio and Video Management System segment is projected to hold the largest share in the global Operating Room Integration Systems market
Q4. Which region holds the largest share in the global Operating Room Integration Systems market?
North America holds the largest share in the global Operating Room Integration Systems market
Q5. Which are the prominent players in the global Operating Room Integration Systems market?
Stryker Corporation, Karl Storz GmbH & Co. KG, Steris Corporation, Skytron, LLC, Getinge Group. are some key players in the global Operating Room Integration Systems market
List of Figures
Figure 1: Global Integrated Operating Room Systems Market Revenue Breakdown (USD Billion, %) by Region, 2019 & 2027
Figure 2: Global Integrated Operating Room Systems Market Value Share (%), By Segment 1, 2019 & 2027
Figure 3: Global Integrated Operating Room Systems Market Forecast (USD Billion), by Sub-Segment 1, 2016-2027
Figure 4: Global Integrated Operating Room Systems Market Forecast (USD Billion), by Sub-Segment 2, 2016-2027
Figure 5: Global Integrated Operating Room Systems Market Value Share (%), By Segment 2, 2019 & 2027
Figure 6: Global Integrated Operating Room Systems Market Forecast (USD Billion), by Sub-Segment 1, 2016-2027
Figure 7: Global Integrated Operating Room Systems Market Forecast (USD Billion), by Sub-Segment 2, 2016-2027
Figure 8: Global Integrated Operating Room Systems Market Forecast (USD Billion), by Sub-Segment 3, 2016-2027
Figure 9: Global Integrated Operating Room Systems Market Forecast (USD Billion), by Others, 2016-2027
Figure 10: Global Integrated Operating Room Systems Market Value Share (%), By Segment 3, 2019 & 2027
Figure 11: Global Integrated Operating Room Systems Market Forecast (USD Billion), by Sub-Segment 1, 2016-2027
Figure 12: Global Integrated Operating Room Systems Market Forecast (USD Billion), by Sub-Segment 2, 2016-2027
Figure 13: Global Integrated Operating Room Systems Market Forecast (USD Billion), by Sub-Segment 3, 2016-2027
Figure 14: Global Integrated Operating Room Systems Market Forecast (USD Billion), by Others, 2016-2027
Figure 15: Global Integrated Operating Room Systems Market Value (USD Billion), by Region, 2019 & 2027
Figure 16: North America Integrated Operating Room Systems Market Value Share (%), By Segment 1, 2019 & 2027
Figure 17: North America Integrated Operating Room Systems Market Forecast (USD Billion), by Sub-Segment 1, 2016-2027
Figure 18: North America Integrated Operating Room Systems Market Forecast (USD Billion), by Sub-Segment 2, 2016-2027
Figure 19: North America Integrated Operating Room Systems Market Value Share (%), By Segment 2, 2019 & 2027
Figure 20: North America Integrated Operating Room Systems Market Forecast (USD Billion), by Sub-Segment 1, 2016-2027
Figure 21: North America Integrated Operating Room Systems Market Forecast (USD Billion), by Sub-Segment 2, 2016-2027
Figure 22: North America Integrated Operating Room Systems Market Forecast (USD Billion), by Sub-Segment 3, 2016-2027
Figure 23: North America Integrated Operating Room Systems Market Forecast (USD Billion), by Others, 2016-2027
Figure 24: North America Integrated Operating Room Systems Market Value Share (%), By Segment 3, 2019 & 2027
Figure 25: North America Integrated Operating Room Systems Market Forecast (USD Billion), by Sub-Segment 1, 2016-2027
Figure 26: North America Integrated Operating Room Systems Market Forecast (USD Billion), by Sub-Segment 2, 2016-2027
Figure 27: North America Integrated Operating Room Systems Market Forecast (USD Billion), by Sub-Segment 3, 2016-2027
Figure 28: North America Integrated Operating Room Systems Market Forecast (USD Billion), by Others, 2016-2027
Figure 29: North America Integrated Operating Room Systems Market Forecast (USD Billion), by U.S., 2016-2027
Figure 30: North America Integrated Operating Room Systems Market Forecast (USD Billion), by Canada, 2016-2027
Figure 31: Latin America Integrated Operating Room Systems Market Value Share (%), By Segment 1, 2019 & 2027
Figure 32: Latin America Integrated Operating Room Systems Market Forecast (USD Billion), by Sub-Segment 1, 2016-2027
Figure 33: Latin America Integrated Operating Room Systems Market Forecast (USD Billion), by Sub-Segment 2, 2016-2027
Figure 34: Latin America Integrated Operating Room Systems Market Value Share (%), By Segment 2, 2019 & 2027
Figure 35: Latin America Integrated Operating Room Systems Market Forecast (USD Billion), by Sub-Segment 1, 2016-2027
Figure 36: Latin America Integrated Operating Room Systems Market Forecast (USD Billion), by Sub-Segment 2, 2016-2027
Figure 37: Latin America Integrated Operating Room Systems Market Forecast (USD Billion), by Sub-Segment 3, 2016-2027
Figure 38: Latin America Integrated Operating Room Systems Market Forecast (USD Billion), by Others, 2016-2027
Figure 39: Latin America Integrated Operating Room Systems Market Value Share (%), By Segment 3, 2019 & 2027
Figure 40: Latin America Integrated Operating Room Systems Market Forecast (USD Billion), by Sub-Segment 1, 2016-2027
Figure 41: Latin America Integrated Operating Room Systems Market Forecast (USD Billion), by Sub-Segment 2, 2016-2027
Figure 42: Latin America Integrated Operating Room Systems Market Forecast (USD Billion), by Sub-Segment 3, 2016-2027
Figure 43: Latin America Integrated Operating Room Systems Market Forecast (USD Billion), by Others, 2016-2027
Figure 44: Latin America Integrated Operating Room Systems Market Forecast (USD Billion), by Brazil, 2016-2027
Figure 45: Latin America Integrated Operating Room Systems Market Forecast (USD Billion), by Mexico, 2016-2027
Figure 46: Latin America Integrated Operating Room Systems Market Forecast (USD Billion), by Rest of Latin America, 2016-2027
Figure 47: Europe Integrated Operating Room Systems Market Value Share (%), By Segment 1, 2019 & 2027
Figure 48: Europe Integrated Operating Room Systems Market Forecast (USD Billion), by Sub-Segment 1, 2016-2027
Figure 49: Europe Integrated Operating Room Systems Market Forecast (USD Billion), by Sub-Segment 2, 2016-2027
Figure 50: Europe Integrated Operating Room Systems Market Value Share (%), By Segment 2, 2019 & 2027
Figure 51: Europe Integrated Operating Room Systems Market Forecast (USD Billion), by Sub-Segment 1, 2016-2027
Figure 52: Europe Integrated Operating Room Systems Market Forecast (USD Billion), by Sub-Segment 2, 2016-2027
Figure 53: Europe Integrated Operating Room Systems Market Forecast (USD Billion), by Sub-Segment 3, 2016-2027
Figure 54: Europe Integrated Operating Room Systems Market Forecast (USD Billion), by Others, 2016-2027
Figure 55: Europe Integrated Operating Room Systems Market Value Share (%), By Segment 3, 2019 & 2027
Figure 56: Europe Integrated Operating Room Systems Market Forecast (USD Billion), by Sub-Segment 1, 2016-2027
Figure 57: Europe Integrated Operating Room Systems Market Forecast (USD Billion), by Sub-Segment 2, 2016-2027
Figure 58: Europe Integrated Operating Room Systems Market Forecast (USD Billion), by Sub-Segment 3, 2016-2027
Figure 59: Europe Integrated Operating Room Systems Market Forecast (USD Billion), by Others, 2016-2027
Figure 60: Europe Integrated Operating Room Systems Market Forecast (USD Billion), by U.K., 2016-2027
Figure 61: Europe Integrated Operating Room Systems Market Forecast (USD Billion), by Germany, 2016-2027
Figure 62: Europe Integrated Operating Room Systems Market Forecast (USD Billion), by France, 2016-2027
Figure 63: Europe Integrated Operating Room Systems Market Forecast (USD Billion), by Italy, 2016-2027
Figure 64: Europe Integrated Operating Room Systems Market Forecast (USD Billion), by Spain, 2016-2027
Figure 65: Europe Integrated Operating Room Systems Market Forecast (USD Billion), by Russia, 2016-2027
Figure 66: Europe Integrated Operating Room Systems Market Forecast (USD Billion), by Rest of Europe, 2016-2027
Figure 67: Asia Pacific Integrated Operating Room Systems Market Value Share (%), By Segment 1, 2019 & 2027
Figure 68: Asia Pacific Integrated Operating Room Systems Market Forecast (USD Billion), by Sub-Segment 1, 2016-2027
Figure 69: Asia Pacific Integrated Operating Room Systems Market Forecast (USD Billion), by Sub-Segment 2, 2016-2027
Figure 70: Asia Pacific Integrated Operating Room Systems Market Value Share (%), By Segment 2, 2019 & 2027
Figure 71: Asia Pacific Integrated Operating Room Systems Market Forecast (USD Billion), by Sub-Segment 1, 2016-2027
Figure 72: Asia Pacific Integrated Operating Room Systems Market Forecast (USD Billion), by Sub-Segment 2, 2016-2027
Figure 73: Asia Pacific Integrated Operating Room Systems Market Forecast (USD Billion), by Sub-Segment 3, 2016-2027
Figure 74: Asia Pacific Integrated Operating Room Systems Market Forecast (USD Billion), by Others, 2016-2027
Figure 75: Asia Pacific Integrated Operating Room Systems Market Value Share (%), By Segment 3, 2019 & 2027
Figure 76: Asia Pacific Integrated Operating Room Systems Market Forecast (USD Billion), by Sub-Segment 1, 2016-2027
Figure 77: Asia Pacific Integrated Operating Room Systems Market Forecast (USD Billion), by Sub-Segment 2, 2016-2027
Figure 78: Asia Pacific Integrated Operating Room Systems Market Forecast (USD Billion), by Sub-Segment 3, 2016-2027
Figure 79: Asia Pacific Integrated Operating Room Systems Market Forecast (USD Billion), by Others, 2016-2027
Figure 80: Asia Pacific Integrated Operating Room Systems Market Forecast (USD Billion), by China, 2016-2027
Figure 81: Asia Pacific Integrated Operating Room Systems Market Forecast (USD Billion), by India, 2016-2027
Figure 82: Asia Pacific Integrated Operating Room Systems Market Forecast (USD Billion), by Japan, 2016-2027
Figure 83: Asia Pacific Integrated Operating Room Systems Market Forecast (USD Billion), by Australia, 2016-2027
Figure 84: Asia Pacific Integrated Operating Room Systems Market Forecast (USD Billion), by Southeast Asia, 2016-2027
Figure 85: Asia Pacific Integrated Operating Room Systems Market Forecast (USD Billion), by Rest of Asia Pacific, 2016-2027
Figure 86: Middle East & Africa Integrated Operating Room Systems Market Value Share (%), By Segment 1, 2019 & 2027
Figure 87: Middle East & Africa Integrated Operating Room Systems Market Forecast (USD Billion), by Sub-Segment 1, 2016-2027
Figure 88: Middle East & Africa Integrated Operating Room Systems Market Forecast (USD Billion), by Sub-Segment 2, 2016-2027
Figure 89: Middle East & Africa Integrated Operating Room Systems Market Value Share (%), By Segment 2, 2019 & 2027
Figure 90: Middle East & Africa Integrated Operating Room Systems Market Forecast (USD Billion), by Sub-Segment 1, 2016-2027
Figure 91: Middle East & Africa Integrated Operating Room Systems Market Forecast (USD Billion), by Sub-Segment 2, 2016-2027
Figure 92: Middle East & Africa Integrated Operating Room Systems Market Forecast (USD Billion), by Sub-Segment 3, 2016-2027
Figure 93: Middle East & Africa Integrated Operating Room Systems Market Forecast (USD Billion), by Others, 2016-2027
Figure 94: Middle East & Africa Integrated Operating Room Systems Market Value Share (%), By Segment 3, 2019 & 2027
Figure 95: Middle East & Africa Integrated Operating Room Systems Market Forecast (USD Billion), by Sub-Segment 1, 2016-2027
Figure 96: Middle East & Africa Integrated Operating Room Systems Market Forecast (USD Billion), by Sub-Segment 2, 2016-2027
Figure 97: Middle East & Africa Integrated Operating Room Systems Market Forecast (USD Billion), by Sub-Segment 3, 2016-2027
Figure 98: Middle East & Africa Integrated Operating Room Systems Market Forecast (USD Billion), by Others, 2016-2027
Figure 99: Middle East & Africa Integrated Operating Room Systems Market Forecast (USD Billion), by GCC, 2016-2027
Figure 100: Middle East & Africa Integrated Operating Room Systems Market Forecast (USD Billion), by South Africa, 2016-2027
Figure 101: Middle East & Africa Integrated Operating Room Systems Market Forecast (USD Billion), by Rest of Middle East & Africa, 2016-2027
List of Tables
Table 1: Global Integrated Operating Room Systems Market Revenue (USD Billion) Forecast, by Segment 1, 2016-2027
Table 2: Global Integrated Operating Room Systems Market Revenue (USD Billion) Forecast, by Segment 2, 2016-2027
Table 3: Global Integrated Operating Room Systems Market Revenue (USD Billion) Forecast, by Segment 3, 2016-2027
Table 4: Global Integrated Operating Room Systems Market Revenue (USD Billion) Forecast, by Region, 2016-2027
Table 5: North America Integrated Operating Room Systems Market Revenue (USD Billion) Forecast, by Segment 1, 2016-2027
Table 6: North America Integrated Operating Room Systems Market Revenue (USD Billion) Forecast, by Segment 2, 2016-2027
Table 7: North America Integrated Operating Room Systems Market Revenue (USD Billion) Forecast, by Segment 3, 2016-2027
Table 8: North America Integrated Operating Room Systems Market Revenue (USD Billion) Forecast, by Country, 2016-2027
Table 9: Europe Integrated Operating Room Systems Market Revenue (USD Billion) Forecast, by Segment 1, 2016-2027
Table 10: Europe Integrated Operating Room Systems Market Revenue (USD Billion) Forecast, by Segment 2, 2016-2027
Table 11: Europe Integrated Operating Room Systems Market Revenue (USD Billion) Forecast, by Segment 3, 2016-2027
Table 12: Europe Integrated Operating Room Systems Market Revenue (USD Billion) Forecast, by Country, 2016-2027
Table 13: Latin America Integrated Operating Room Systems Market Revenue (USD Billion) Forecast, by Segment 1, 2016-2027
Table 14: Latin America Integrated Operating Room Systems Market Revenue (USD Billion) Forecast, by Segment 2, 2016-2027
Table 15: Latin America Integrated Operating Room Systems Market Revenue (USD Billion) Forecast, by Segment 3, 2016-2027
Table 16: Latin America Integrated Operating Room Systems Market Revenue (USD Billion) Forecast, by Country, 2016-2027
Table 17: Asia Pacific Integrated Operating Room Systems Market Revenue (USD Billion) Forecast, by Segment 1, 2016-2027
Table 18: Asia Pacific Integrated Operating Room Systems Market Revenue (USD Billion) Forecast, by Segment 2, 2016-2027
Table 19: Asia Pacific Integrated Operating Room Systems Market Revenue (USD Billion) Forecast, by Segment 3, 2016-2027
Table 20: Asia Pacific Integrated Operating Room Systems Market Revenue (USD Billion) Forecast, by Country, 2016-2027
Table 21: Middle East & Africa Integrated Operating Room Systems Market Revenue (USD Billion) Forecast, by Segment 1, 2016-2027
Table 22: Middle East & Africa Integrated Operating Room Systems Market Revenue (USD Billion) Forecast, by Segment 2, 2016-2027
Table 23: Middle East & Africa Integrated Operating Room Systems Market Revenue (USD Billion) Forecast, by Segment 3, 2016-2027
Table 24: Middle East & Africa Integrated Operating Room Systems Market Revenue (USD Billion) Forecast, by Country, 2016-2027
Research Process
Data Library Research are conducted by industry experts who offer insight on
industry structure, market segmentations technology assessment and competitive landscape (CL), and penetration, as well as on emerging trends. Their analysis is based on primary interviews (~ 80%) and secondary research (~ 20%) as well as years of professional expertise in their respective industries. Adding to this, by analysing historical trends and current market positions, our analysts predict where the market will be headed for the next five years. Furthermore, the varying trends of segment & categories geographically presented are also studied and the estimated based on the primary & secondary research.
In this particular report from the supply side Data Library Research has conducted primary surveys (interviews) with the key level executives (VP, CEO’s, Marketing Director, Business Development Manager
and SOFT) of the companies that active & prominent as well as the midsized organization
FIGURE 1: DLR RESEARH PROCESS
![research-methodology1]()
Primary Research
Extensive primary research was conducted to gain a deeper insight of the market and industry performance. The analysis is based on both primary and secondary research as well as years of professional expertise in the respective industries.
In addition to analysing current and historical trends, our analysts predict where the market is headed over the next five years.
It varies by segment for these categories geographically presented in the list of market tables. Speaking about this particular report we have conducted primary surveys (interviews) with the key level executives (VP, CEO’s, Marketing Director, Business Development Manager and many more) of the major players active in the market.
Secondary Research
Secondary research was mainly used to collect and identify information useful for the extensive, technical, market-oriented, and Friend’s study of the Global Extra Neutral Alcohol. It was also used to obtain key information about major players, market classification and segmentation according to the industry trends, geographical markets, and developments related to the market and technology perspectives. For this study, analysts have gathered information from various credible sources, such as annual reports, sec filings, journals, white papers, SOFT presentations, and company web sites.
Market Size Estimation
Both, top-down and bottom-up approaches were used to estimate and validate the size of the Global market and to estimate the size of various other dependent submarkets in the overall Extra Neutral Alcohol. The key players in the market were identified through secondary research and their market contributions in the respective geographies were determined through primary and secondary research.
Forecast Model
![research-methodology2]()