Intelligent Energy Router Market Overview and Analysis

The Global Intelligent Energy Router Market size was valued at USD 12.98 billion in 2025 and is poised to grow to USD 28.12 billion by 2032, growing with a CAGR of 8.9% from 2025-2032.

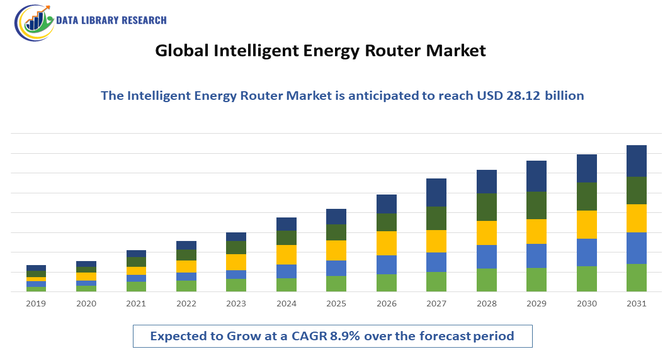
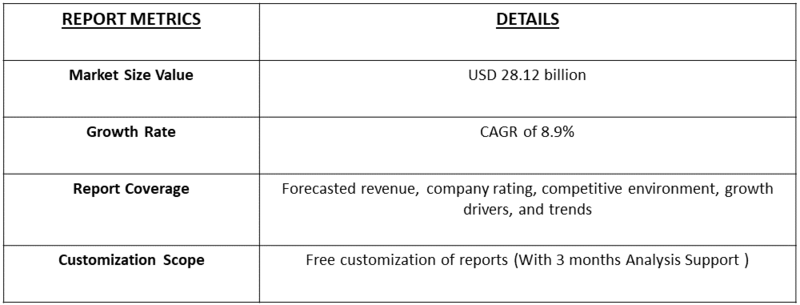
The Global Intelligent Energy Router Market refers to the portion of the energy management industry focused on advanced devices that monitor, control and route electricity flows across different sources—such as renewables, storage systems and the grid—using smart connectivity and analytics. These routers optimise energy distribution, support grid flexibility and enable efficient integration of diverse power inputs to enhance sustainability and reliability.

The growth of the global intelligent energy router market is being driven by several key factors: the rapid integration of renewable energy sources into existing power grids, which demands smarter routing solutions for stability and optimization; increased investment in grid modernization by governments worldwide, creating a favorable regulatory and funding environment; and technological advancements such as AI, IoT and real time monitoring capabilities that enable sophisticated energy flow management across residential, commercial and industrial segments.

Intelligent Energy Router Market Trends

The global intelligent energy router market is currently following several key trends: manufacturers are increasingly embedding AI, machine learning and IoT capabilities into routers to enable real time data analytics and load optimisation; the shift toward decentralised energy resources (DERs) like rooftop solar, battery storage and EV charging is creating demand for intelligent routing solutions; and sustainability and regulatory pressure are driving adoption of these routers as utilities and enterprises work to reduce carbon footprints and modernise grid infrastructure.

Segmentation: The Global Intelligent Energy Router Market is Segmented by Component (Hardware; Software; and Service), Application (Residential; Commercial; and Industrial), Connectivity (Wired Connectivity; Wireless Connectivity), End User (Utilities; Data Centers; Smart Grids; Electric Vehicles; and Others) and Geography (North America, Europe, Asia-Pacific, Middle East and Africa, and South America). The report provides the value (in USD million) for the above segments.

Market Drivers:

  • The global shift to renewable energy sources

As utilities and industries increase reliance on renewables like solar and wind, the need for intelligent routing systems becomes critical. These sources are intermittent, making real time energy flow management essential. Intelligent energy routers enable seamless integration of diverse energy inputs, balancing generation and consumption for grid stability. Additionally, rising energy costs and stringent efficiency regulations amplify their appeal because they optimise usage and support demand response programmes. Together, these factors are propelling the market forward by creating fresh demand and positioning routers as a key component in modern, resilient energy infrastructures.

  • Government initiatives and smart grid investment

Government policies worldwide are accelerating the adoption of advanced energy management technologies. Regulations pushing for carbon reduction, incentives for energy efficient infrastructure, and substantial funding for grid modernisation are creating a fertile environment for intelligent energy routers. As legacy systems are upgraded and digitalisation of utility networks advances, these routers are increasingly viewed as indispensable. Their capability to deliver operational cost savings, improve asset management, and support distributed energy resources aligns well with regulatory priorities, further driving vendor investment and accelerating market penetration.

Market Restraint:

  • High upfront costs and integration complexity

Despite promising growth prospects, the intelligent energy router market faces a significant challenge in the form of high initial capital expenditures and complex integration requirements. Deploying sophisticated routers involves substantial investment in hardware, software, personnel training, and infrastructure upgrades. Moreover, retrofitting legacy systems and ensuring compatibility across diverse grid assets can be time consuming and costly. For smaller utilities and emerging market players, this cost barrier often outweighs perceived benefits, slowing adoption. Consequently, the potential of the market is restrained by financial and technical hurdles, particularly in cost sensitive or infrastructure fragmented regions.

Socio Economic Impact on Intelligent Energy Router Market

The global intelligent energy router market is driving meaningful socioeconomic change by enabling more efficient energy use, reducing operating costs for both businesses and consumers, and supporting job creation in the clean energy value chain. As energy routing systems allow distributed generation, storage and demand response programmes, they promote greater energy access, reduce carbon footprints and enhance grid resilience—contributing to broader sustainability goals and economic growth in regions investing in smart grid technologies.

Segmental Analysis:

  • Software Segment is Expected to Witness Significant Growth Over the Forecast Period

In the global intelligent energy router market, the software segment is set to expand markedly because modern energy infrastructures rely increasingly on advanced analytics, cloud platforms, and IoT-driven control systems. Software enables real time monitoring, predictive maintenance, and optimization of distributed energy resources—capabilities that hardware alone cannot deliver. With utilities, commercial entities and industrial users seeking to better understand energy flows, reduce waste, and integrate renewables seamlessly, software becomes the value driver. As subscription and as a service models gain traction, software offerings are likely to grow faster than pure device sales, reflecting a shift toward intelligence and services over physical components.

  • Commercial Segment is Expected to Witness Significant Growth Over the Forecast Period

The commercial application segment of intelligent energy routers is poised for strong growth as businesses—such as offices, retail complexes, hospitals and educational institutions—face mounting pressure to reduce operating costs, improve energy efficiency, and meet sustainability goals. Commercial buildings consume substantial energy and increasingly deploy smart grid, building automation and demand response solutions, making energy routers attractive investments. With available floor space for equipment, predictable usage patterns and capital budgets directed toward infrastructure modernization, the commercial sector offers a rich opportunity. As energy prices rise and regulatory scrutiny of commercial consumption increases, many organizations will turn to intelligent energy routing systems to manage loads, integrate renewables and uphold ESG commitments.

  • Wireless Connectivity Segment is Expected to Witness Significant Growth Over the Forecast Period

Within the connectivity domain, the wireless sub segment of intelligent energy routers is expected to gain momentum due to greater flexibility, lower installation costs and ease of deployment in complex or remote environments. Wireless communication—via cellular, Wi Fi, LPWAN or mesh networks—allows routers to link distributed sensors, edge devices and IoT nodes without extensive cabling, which is particularly advantageous in retrofit projects or expansive campuses. As utilities and businesses embrace IoT, mobility and remote monitoring, the demand for wireless energy routing solutions increases. Wireless systems also enable fast scalability and less disruption, making them ideal for next generation grids, commercial sites and monitoring of distributed assets—driving this segment's growth ahead of traditional wired options.

  • Data Centers Segment is Expected to Witness Significant Growth Over the Forecast Period

The data center end user segment offers meaningful growth potential for intelligent energy routers because of escalating demand for high availability power, energy efficiency and integration of renewables within these facilities. As cloud adoption, edge computing and AI workloads surge globally, data centers require sophisticated energy routing to manage dynamic loads, battery storage, and renewable sources. Intelligent routers help optimize power distribution, reduce waste and ensure uptime—critical factors for data center operators. Their modularity, monitoring and load balancing capabilities align well with the high density, mission critical environment of data centers, positioning this segment for strong adoption in the coming years.

  • Asia Pacific Region is Expected to Witness Significant Growth Over the Forecast Period

The Asia Pacific region is projected to experience some of the fastest growth in the intelligent energy router market due to rapid urbanization, industrial expansion and investments in modernization of power infrastructure.

Countries such as China, India, Japan and Southeast Asian nations are deploying smart grid technologies, integrating distributed energy resources and enhancing energy efficiency measures—all of which create fertile demand for intelligent routing solutions. For instance, In November 2022, Hitachi Energy introduced the TRO610 cellular router, a rugged, high availability wireless device built for industrial IIoT applications in utilities, smart cities, and heavy industry sectors. It supports edge computing, multiple secure connectivity options and always on cellular networking. This advanced router launch acts as a catalyst for the Asia Pacific intelligent energy router market by accelerating grid modernisation projects and expanding connectivity solutions tailored to utilities and infrastructure operators in the region. As countries across Asia Pacific invest heavily in smart grid and IIoT deployments, the TRO610 underscores demand for mission critical wireless routing hardware that enables distributed energy integration and edge application stability, thereby strengthening growth prospects for intelligent energy router providers.

Government initiatives and renewable energy commitments further accelerate uptake. With increasing infrastructure budgets, growing commercial and data center loads, and a large untapped market of older grid systems being upgraded, the Asia Pacific region stands out as a key growth engine for intelligent energy routers.

Intelligent Energy Router Market Competitive Analysis

The competitive landscape of the intelligent energy router market is dynamic and increasingly intense, with major global companies such as Siemens AG, Schneider Electric and ABB Ltd. leading innovation, while smaller specialist firms carve niche roles. These firms are distinguished through heavy R&D investments, strategic partnerships, mergers and acquisitions, and expanding portfolios that integrate hardware, software and services to meet diverse use cases across utilities, residential and industrial segments.

The 20 major players for above market are:

  • ABB Ltd.
  • Cisco Systems, Inc.
  • Delta Electronics, Inc.
  • Eaton Corporation
  • Emerson Electric Co.
  • General Electric Company
  • Hitachi, Ltd.
  • Honeywell International Inc.
  • Huawei Technologies Co., Ltd.
  • Johnson Controls International plc
  • Legrand SA
  • Mitsubishi Electric Corporation
  • Panasonic Corporation
  • Rockwell Automation, Inc.
  • Schneider Electric SE
  • Siemens AG
  • Toshiba Corporation
  • Yaskawa Electric Corporation
  • Schweitzer Engineering Laboratories, Inc.
  • Moxa Inc.

Recent Development

  • In June 2025, Nokia announced a major expansion of its IP routing portfolio, enhancing its 7705 Service Aggregation Router (SAR) and 7250 Interconnect Router (IXR) platforms to serve mission critical networks for utilities shifting towards smart grid technologies. This strategic move by Nokia strengthens the intelligent energy router market by signaling growing investment in grid communications infrastructure. It highlights increased demand for robust, secure and scalable networking solutions in utility environments, prompting greater vendor competition and raising the bar for technology capabilities in energy routing systems across the smart grid landscape.


  • In February 2025, Verizon Communications Inc. announced that, in collaboration with Samsung Electronics Co., Ltd. and Qualcomm Technologies, Inc., it had deployed a multi vendor RAN Intelligent Controller (RIC) in its commercial network. The deployment integrated Samsung’s AI powered Energy Saving Manager with Qualcomm’s Dragonwing RAN Automation Suite to advance Open RAN technology. This move underscores the growing importance of intelligent, software driven routing solutions in critical infrastructure, reinforcing demand for smart energy management devices beyond telecommunications. The integration of AI enabled network routing and energy use optimization signals that sectors such as utilities and data centres will increasingly adopt advanced routing systems.


Frequently Asked Questions (FAQ) :

Q1. What the main growth driving factors for this market?

The primary growth driver for the Intelligent Energy Router Market is the accelerated global shift towards renewable energy sources like solar and wind power. Energy routers are essential for managing the intermittent and decentralized nature of these Distributed Energy Resources (DERs), ensuring grid stability. The increasing demand for efficient energy storage solutions and the development of smart microgrids and smart cities further fuel market growth. Additionally, favorable government policies and regulatory frameworks that support grid modernization and renewable energy integration create consistent market opportunities.

Q2. What are the main restraining factors for this market?

The main restraining factors is the high initial deployment cost and integration complexity of intelligent energy router systems, particularly for large-scale industrial and utility applications. Integrating these new, advanced power electronics and communication protocols with existing, older grid infrastructure poses significant technical and financial challenges. Moreover, given that energy routers manage critical infrastructure and sensitive consumption data, cybersecurity threats and the lack of standardized communication protocols across different hardware vendors present ongoing concerns for stability and reliability.

Q3. Which segment is expected to witness high growth?

The Multiport Energy Router segment is expected to witness the highest growth. This is driven by the increasing complexity of modern energy ecosystems, which often involve multiple energy inputs (solar, grid, battery storage, and EV charging) and varying loads. Multiport routers offer the necessary flexibility and intelligence to manage complex, bidirectional power flows simultaneously, enabling advanced functions like dynamic load balancing and seamless integration of diverse energy assets within smart homes, commercial buildings, and microgrids.

Q4. Who are the top major players for this market?

The market is primarily led by established global technology and industrial automation companies. The top major players include industrial giants like Siemens, who focus on smart grid development; Schneider Electric SE, specializing in digital automation and energy management; and General Electric (GE), known for its role in modernizing the energy landscape. Other key players include companies that offer integrated IT solutions for energy management, such as Honeywell International, Inc. and Itron Inc.

Q5. Which country is the largest player?

China is emerging as the largest country player in the Intelligent Energy Router market, particularly in terms of sheer deployment volume and demand. This dominance is driven by China’s world-leading position in the installation of solar power and its aggressive national goals for renewable energy adoption. This massive, decentralized renewable energy capacity necessitates a huge and growing demand for intelligent devices to manage and optimize the complex energy flows across its vast and rapidly modernizing electrical infrastructure.

Intelligent Energy Router MARKET STUDY GLOBAL MARKET ANALYSIS, INSIGHTS AND FORECAST, 2022-2029

    1. Introduction

    • 1.1. Research Scope
    • 1.2. Market Segmentation
    • 1.3. Research Methodology
    • 1.4. Definitions and Assumptions

    2. Executive Summary

      3. Market Dynamics

      • 3.1. Market Drivers
      • 3.2. Market Restraints
      • 3.3. Market Opportunities

      4. Key Insights

      • 4.1. Key Emerging Trends – For Major Countries
      • 4.2. Latest Technological Advancement
      • 4.3. Regulatory Landscape
      • 4.4. Industry SWOT Analysis
      • 4.5. Porters Five Forces Analysis

      5. Global Intelligent Energy Router Market Analysis (USD Billion), Insights and Forecast, 2018-2029

      • 5.1. Key Findings / Summary
      • 5.2. Market Analysis, Insights and Forecast – By Segment 1
        • 5.2.1. Sub-Segment 1
        • 5.2.2. Sub-Segment 2
      • 5.3. Market Analysis, Insights and Forecast – By Segment 2
        • 5.3.1. Sub-Segment 1
        • 5.3.2. Sub-Segment 2
        • 5.3.3. Sub-Segment 3
        • 5.3.4. Others
      • 5.4. Market Analysis, Insights and Forecast – By Segment 3
        • 5.4.1. Sub-Segment 1
        • 5.4.2. Sub-Segment 2
        • 5.4.3. Sub-Segment 3
        • 5.4.4. Others
      • 5.5. Market Analysis, Insights and Forecast – By Region
        • 5.5.1. North America
        • 5.5.2. Latin America
        • 5.5.3. Europe
        • 5.5.4. Asia Pacific
        • 5.5.5. Middle East and Africa

      6. North America Intelligent Energy Router Market Analysis (USD Billion), Insights and Forecast, 2018-2029

      • 6.1. Key Findings / Summary
      • 6.2. Market Analysis, Insights and Forecast – By Segment 1
        • 6.2.1. Sub-Segment 1
        • 6.2.2. Sub-Segment 2
      • 6.3. Market Analysis, Insights and Forecast – By Segment 2
        • 6.3.1. Sub-Segment 1
        • 6.3.2. Sub-Segment 2
        • 6.3.3. Sub-Segment 3
        • 6.3.4. Others
      • 6.4. Market Analysis, Insights and Forecast – By Segment 3
        • 6.4.1. Sub-Segment 1
        • 6.4.2. Sub-Segment 2
        • 6.4.3. Sub-Segment 3
        • 6.4.4. Others
      • 6.5. Market Analysis, Insights and Forecast – By Country
        • 6.5.1. U.S.
        • 6.5.2. Canada

      7. Latin America Intelligent Energy Router Market Analysis (USD Billion), Insights and Forecast, 2018-2029

      • 7.1. Key Findings / Summary
      • 7.2. Market Analysis, Insights and Forecast – By Segment 1
        • 7.2.1. Sub-Segment 1
        • 7.2.2. Sub-Segment 2
      • 7.3. Market Analysis, Insights and Forecast – By Segment 2
        • 7.3.1. Sub-Segment 1
        • 7.3.2. Sub-Segment 2
        • 7.3.3. Sub-Segment 3
        • 7.3.4. Others
      • 7.4. Market Analysis, Insights and Forecast – By Segment 3
        • 7.4.1. Sub-Segment 1
        • 7.4.2. Sub-Segment 2
        • 7.4.3. Sub-Segment 3
        • 7.4.4. Others
      • 7.5. Insights and Forecast – By Country
        • 7.5.1. Brazil
        • 7.5.2. Mexico
        • 7.5.3. Rest of Latin America

      8. Europe Intelligent Energy Router Market Analysis (USD Billion), Insights and Forecast, 2018-2029

      • 8.1. Key Findings / Summary
      • 8.2. Market Analysis, Insights and Forecast – By Segment 1
        • 8.2.1. Sub-Segment 1
        • 8.2.2. Sub-Segment 2
      • 8.3. Market Analysis, Insights and Forecast – By Segment 2
        • 8.3.1. Sub-Segment 1
        • 8.3.2. Sub-Segment 2
        • 8.3.3. Sub-Segment 3
        • 8.3.4. Others
      • 8.4. Market Analysis, Insights and Forecast – By Segment 3
        • 8.4.1. Sub-Segment 1
        • 8.4.2. Sub-Segment 2
        • 8.4.3. Sub-Segment 3
        • 8.4.4. Others
      • 8.5. Market Analysis, Insights and Forecast – By Country
        • 8.5.1. UK
        • 8.5.2. Germany
        • 8.5.3. France
        • 8.5.4. Italy
        • 8.5.5. Spain
        • 8.5.6. Russia
        • 8.5.7. Rest of Europe

      9. Asia Pacific Intelligent Energy Router Market Analysis (USD Billion), Insights and Forecast, 2018-2029

      • 9.1. Key Findings / Summary
      • 9.2. Market Analysis, Insights and Forecast – By Segment 1
        • 9.2.1. Sub-Segment 1
        • 9.2.2. Sub-Segment 2
      • 9.3. Market Analysis, Insights and Forecast – By Segment 2
        • 9.3.1. Sub-Segment 1
        • 9.3.2. Sub-Segment 2
        • 9.3.3. Sub-Segment 3
        • 9.3.4. Others
      • 9.4. Market Analysis, Insights and Forecast – By Segment 3
        • 9.4.1. Sub-Segment 1
        • 9.4.2. Sub-Segment 2
        • 9.4.3. Sub-Segment 3
        • 9.4.4. Others
      • 9.5. Market Analysis, Insights and Forecast – By Country
        • 9.5.1. China
        • 9.5.2. India
        • 9.5.3. Japan
        • 9.5.4. Australia
        • 9.5.5. South East Asia
        • 9.5.6. Rest of Asia Pacific

      10. Middle East & Africa Intelligent Energy Router Market Analysis (USD Billion), Insights and Forecast, 2018-2029

      • 10.1. Key Findings / Summary
      • 10.2. Market Analysis, Insights and Forecast – By Segment 1
        • 10.2.1. Sub-Segment 1
        • 10.2.2. Sub-Segment 2
      • 10.3. Market Analysis, Insights and Forecast – By Segment 2
        • 10.3.1. Sub-Segment 1
        • 10.3.2. Sub-Segment 2
        • 10.3.3. Sub-Segment 3
        • 10.3.4. Others
      • 10.4. Market Analysis, Insights and Forecast – By Segment 3
        • 10.4.1. Sub-Segment 1
        • 10.4.2. Sub-Segment 2
        • 10.4.3. Sub-Segment 3
        • 10.4.4. Others
      • 10.5. Market Analysis, Insights and Forecast – By Country
        • 10.5.1. GCC
        • 10.5.2. South Africa
        • 10.5.3. Rest of Middle East & Africa

      11. Competitive Analysis

      • 11.1. Company Market Share Analysis, 2018
      • 11.2. Key Industry Developments
      • 11.3. Company Profile
        • 11.3.1. Company 1
          • 11.3.1.1. Business Overview
          • 11.3.1.2. Segment 1 & Service Offering
          • 11.3.1.3. Overall Revenue
          • 11.3.1.4. Geographic Presence
          • 11.3.1.5. Recent Development
        *Similar details will be provided for the following companies
        • 11.3.2. Company 2
        • 11.3.3. Company 3
        • 11.3.4. Company 4
        • 11.3.5. Company 5
        • 11.3.6. Company 6
        • 11.3.7. Company 7
        • 11.3.8. Company 8
        • 11.3.9. Company 9
        • 11.3.10. Company 10
        • 11.3.11. Company 11
        • 11.3.12. Company 12
      List of Figures

      Figure 1: Global Intelligent Energy Router Market Revenue Breakdown (USD Billion, %) by Region, 2022 & 2029
      Figure 2: Global Intelligent Energy Router Market Value Share (%), By Segment 1, 2022 & 2029
      Figure 3: Global Intelligent Energy Router Market Forecast (USD Billion), by Sub-Segment 1, 2018-2029
      Figure 4: Global Intelligent Energy Router Market Forecast (USD Billion), by Sub-Segment 2, 2018-2029
      Figure 5: Global Intelligent Energy Router Market Value Share (%), By Segment 2, 2022 & 2029
      Figure 6: Global Intelligent Energy Router Market Forecast (USD Billion), by Sub-Segment 1, 2018-2029
      Figure 7: Global Intelligent Energy Router Market Forecast (USD Billion), by Sub-Segment 2, 2018-2029
      Figure 8: Global Intelligent Energy Router Market Forecast (USD Billion), by Sub-Segment 3, 2018-2029
      Figure 9: Global Intelligent Energy Router Market Forecast (USD Billion), by Others, 2018-2029
      Figure 10: Global Intelligent Energy Router Market Value Share (%), By Segment 3, 2022 & 2029
      Figure 11: Global Intelligent Energy Router Market Forecast (USD Billion), by Sub-Segment 1, 2018-2029
      Figure 12: Global Intelligent Energy Router Market Forecast (USD Billion), by Sub-Segment 2, 2018-2029
      Figure 13: Global Intelligent Energy Router Market Forecast (USD Billion), by Sub-Segment 3, 2018-2029
      Figure 14: Global Intelligent Energy Router Market Forecast (USD Billion), by Others, 2018-2029
      Figure 15: Global Intelligent Energy Router Market Value (USD Billion), by Region, 2022 & 2029
      Figure 16: North America Intelligent Energy Router Market Value Share (%), By Segment 1, 2022 & 2029
      Figure 17: North America Intelligent Energy Router Market Forecast (USD Billion), by Sub-Segment 1, 2018-2029
      Figure 18: North America Intelligent Energy Router Market Forecast (USD Billion), by Sub-Segment 2, 2018-2029
      Figure 19: North America Intelligent Energy Router Market Value Share (%), By Segment 2, 2022 & 2029
      Figure 20: North America Intelligent Energy Router Market Forecast (USD Billion), by Sub-Segment 1, 2018-2029
      Figure 21: North America Intelligent Energy Router Market Forecast (USD Billion), by Sub-Segment 2, 2018-2029
      Figure 22: North America Intelligent Energy Router Market Forecast (USD Billion), by Sub-Segment 3, 2018-2029
      Figure 23: North America Intelligent Energy Router Market Forecast (USD Billion), by Others, 2018-2029
      Figure 24: North America Intelligent Energy Router Market Value Share (%), By Segment 3, 2022 & 2029
      Figure 25: North America Intelligent Energy Router Market Forecast (USD Billion), by Sub-Segment 1, 2018-2029
      Figure 26: North America Intelligent Energy Router Market Forecast (USD Billion), by Sub-Segment 2, 2018-2029
      Figure 27: North America Intelligent Energy Router Market Forecast (USD Billion), by Sub-Segment 3, 2018-2029
      Figure 28: North America Intelligent Energy Router Market Forecast (USD Billion), by Others, 2018-2029
      Figure 29: North America Intelligent Energy Router Market Forecast (USD Billion), by U.S., 2018-2029
      Figure 30: North America Intelligent Energy Router Market Forecast (USD Billion), by Canada, 2018-2029
      Figure 31: Latin America Intelligent Energy Router Market Value Share (%), By Segment 1, 2022 & 2029
      Figure 32: Latin America Intelligent Energy Router Market Forecast (USD Billion), by Sub-Segment 1, 2018-2029
      Figure 33: Latin America Intelligent Energy Router Market Forecast (USD Billion), by Sub-Segment 2, 2018-2029
      Figure 34: Latin America Intelligent Energy Router Market Value Share (%), By Segment 2, 2022 & 2029
      Figure 35: Latin America Intelligent Energy Router Market Forecast (USD Billion), by Sub-Segment 1, 2018-2029
      Figure 36: Latin America Intelligent Energy Router Market Forecast (USD Billion), by Sub-Segment 2, 2018-2029
      Figure 37: Latin America Intelligent Energy Router Market Forecast (USD Billion), by Sub-Segment 3, 2018-2029
      Figure 38: Latin America Intelligent Energy Router Market Forecast (USD Billion), by Others, 2018-2029
      Figure 39: Latin America Intelligent Energy Router Market Value Share (%), By Segment 3, 2022 & 2029
      Figure 40: Latin America Intelligent Energy Router Market Forecast (USD Billion), by Sub-Segment 1, 2018-2029
      Figure 41: Latin America Intelligent Energy Router Market Forecast (USD Billion), by Sub-Segment 2, 2018-2029
      Figure 42: Latin America Intelligent Energy Router Market Forecast (USD Billion), by Sub-Segment 3, 2018-2029
      Figure 43: Latin America Intelligent Energy Router Market Forecast (USD Billion), by Others, 2018-2029
      Figure 44: Latin America Intelligent Energy Router Market Forecast (USD Billion), by Brazil, 2018-2029
      Figure 45: Latin America Intelligent Energy Router Market Forecast (USD Billion), by Mexico, 2018-2029
      Figure 46: Latin America Intelligent Energy Router Market Forecast (USD Billion), by Rest of Latin America, 2018-2029
      Figure 47: Europe Intelligent Energy Router Market Value Share (%), By Segment 1, 2022 & 2029
      Figure 48: Europe Intelligent Energy Router Market Forecast (USD Billion), by Sub-Segment 1, 2018-2029
      Figure 49: Europe Intelligent Energy Router Market Forecast (USD Billion), by Sub-Segment 2, 2018-2029
      Figure 50: Europe Intelligent Energy Router Market Value Share (%), By Segment 2, 2022 & 2029
      Figure 51: Europe Intelligent Energy Router Market Forecast (USD Billion), by Sub-Segment 1, 2018-2029
      Figure 52: Europe Intelligent Energy Router Market Forecast (USD Billion), by Sub-Segment 2, 2018-2029
      Figure 53: Europe Intelligent Energy Router Market Forecast (USD Billion), by Sub-Segment 3, 2018-2029
      Figure 54: Europe Intelligent Energy Router Market Forecast (USD Billion), by Others, 2018-2029
      Figure 55: Europe Intelligent Energy Router Market Value Share (%), By Segment 3, 2022 & 2029
      Figure 56: Europe Intelligent Energy Router Market Forecast (USD Billion), by Sub-Segment 1, 2018-2029
      Figure 57: Europe Intelligent Energy Router Market Forecast (USD Billion), by Sub-Segment 2, 2018-2029
      Figure 58: Europe Intelligent Energy Router Market Forecast (USD Billion), by Sub-Segment 3, 2018-2029
      Figure 59: Europe Intelligent Energy Router Market Forecast (USD Billion), by Others, 2018-2029
      Figure 60: Europe Intelligent Energy Router Market Forecast (USD Billion), by U.K., 2018-2029
      Figure 61: Europe Intelligent Energy Router Market Forecast (USD Billion), by Germany, 2018-2029
      Figure 62: Europe Intelligent Energy Router Market Forecast (USD Billion), by France, 2018-2029
      Figure 63: Europe Intelligent Energy Router Market Forecast (USD Billion), by Italy, 2018-2029
      Figure 64: Europe Intelligent Energy Router Market Forecast (USD Billion), by Spain, 2018-2029
      Figure 65: Europe Intelligent Energy Router Market Forecast (USD Billion), by Russia, 2018-2029
      Figure 66: Europe Intelligent Energy Router Market Forecast (USD Billion), by Rest of Europe, 2018-2029
      Figure 67: Asia Pacific Intelligent Energy Router Market Value Share (%), By Segment 1, 2022 & 2029
      Figure 68: Asia Pacific Intelligent Energy Router Market Forecast (USD Billion), by Sub-Segment 1, 2018-2029
      Figure 69: Asia Pacific Intelligent Energy Router Market Forecast (USD Billion), by Sub-Segment 2, 2018-2029
      Figure 70: Asia Pacific Intelligent Energy Router Market Value Share (%), By Segment 2, 2022 & 2029
      Figure 71: Asia Pacific Intelligent Energy Router Market Forecast (USD Billion), by Sub-Segment 1, 2018-2029
      Figure 72: Asia Pacific Intelligent Energy Router Market Forecast (USD Billion), by Sub-Segment 2, 2018-2029
      Figure 73: Asia Pacific Intelligent Energy Router Market Forecast (USD Billion), by Sub-Segment 3, 2018-2029
      Figure 74: Asia Pacific Intelligent Energy Router Market Forecast (USD Billion), by Others, 2018-2029
      Figure 75: Asia Pacific Intelligent Energy Router Market Value Share (%), By Segment 3, 2022 & 2029
      Figure 76: Asia Pacific Intelligent Energy Router Market Forecast (USD Billion), by Sub-Segment 1, 2018-2029
      Figure 77: Asia Pacific Intelligent Energy Router Market Forecast (USD Billion), by Sub-Segment 2, 2018-2029
      Figure 78: Asia Pacific Intelligent Energy Router Market Forecast (USD Billion), by Sub-Segment 3, 2018-2029
      Figure 79: Asia Pacific Intelligent Energy Router Market Forecast (USD Billion), by Others, 2018-2029
      Figure 80: Asia Pacific Intelligent Energy Router Market Forecast (USD Billion), by China, 2018-2029
      Figure 81: Asia Pacific Intelligent Energy Router Market Forecast (USD Billion), by India, 2018-2029
      Figure 82: Asia Pacific Intelligent Energy Router Market Forecast (USD Billion), by Japan, 2018-2029
      Figure 83: Asia Pacific Intelligent Energy Router Market Forecast (USD Billion), by Australia, 2018-2029
      Figure 84: Asia Pacific Intelligent Energy Router Market Forecast (USD Billion), by Southeast Asia, 2018-2029
      Figure 85: Asia Pacific Intelligent Energy Router Market Forecast (USD Billion), by Rest of Asia Pacific, 2018-2029
      Figure 86: Middle East & Africa Intelligent Energy Router Market Value Share (%), By Segment 1, 2022 & 2029
      Figure 87: Middle East & Africa Intelligent Energy Router Market Forecast (USD Billion), by Sub-Segment 1, 2018-2029
      Figure 88: Middle East & Africa Intelligent Energy Router Market Forecast (USD Billion), by Sub-Segment 2, 2018-2029
      Figure 89: Middle East & Africa Intelligent Energy Router Market Value Share (%), By Segment 2, 2022 & 2029
      Figure 90: Middle East & Africa Intelligent Energy Router Market Forecast (USD Billion), by Sub-Segment 1, 2018-2029
      Figure 91: Middle East & Africa Intelligent Energy Router Market Forecast (USD Billion), by Sub-Segment 2, 2018-2029
      Figure 92: Middle East & Africa Intelligent Energy Router Market Forecast (USD Billion), by Sub-Segment 3, 2018-2029
      Figure 93: Middle East & Africa Intelligent Energy Router Market Forecast (USD Billion), by Others, 2018-2029
      Figure 94: Middle East & Africa Intelligent Energy Router Market Value Share (%), By Segment 3, 2022 & 2029
      Figure 95: Middle East & Africa Intelligent Energy Router Market Forecast (USD Billion), by Sub-Segment 1, 2018-2029
      Figure 96: Middle East & Africa Intelligent Energy Router Market Forecast (USD Billion), by Sub-Segment 2, 2018-2029
      Figure 97: Middle East & Africa Intelligent Energy Router Market Forecast (USD Billion), by Sub-Segment 3, 2018-2029
      Figure 98: Middle East & Africa Intelligent Energy Router Market Forecast (USD Billion), by Others, 2018-2029
      Figure 99: Middle East & Africa Intelligent Energy Router Market Forecast (USD Billion), by GCC, 2018-2029
      Figure 100: Middle East & Africa Intelligent Energy Router Market Forecast (USD Billion), by South Africa, 2018-2029
      Figure 101: Middle East & Africa Intelligent Energy Router Market Forecast (USD Billion), by Rest of Middle East & Africa, 2018-2029 
      List of Tables
      Table 1: Global Intelligent Energy Router Market Revenue (USD Billion) Forecast, by Segment 1, 2018-2029
      Table 2: Global Intelligent Energy Router Market Revenue (USD Billion) Forecast, by Segment 2, 2018-2029
      Table 3: Global Intelligent Energy Router Market Revenue (USD Billion) Forecast, by Segment 3, 2018-2029
      Table 4: Global Intelligent Energy Router Market Revenue (USD Billion) Forecast, by Region, 2018-2029
      Table 5: North America Intelligent Energy Router Market Revenue (USD Billion) Forecast, by Segment 1, 2018-2029
      Table 6: North America Intelligent Energy Router Market Revenue (USD Billion) Forecast, by Segment 2, 2018-2029
      Table 7: North America Intelligent Energy Router Market Revenue (USD Billion) Forecast, by Segment 3, 2018-2029
      Table 8: North America Intelligent Energy Router Market Revenue (USD Billion) Forecast, by Country, 2018-2029
      Table 9: Europe Intelligent Energy Router Market Revenue (USD Billion) Forecast, by Segment 1, 2018-2029
      Table 10: Europe Intelligent Energy Router Market Revenue (USD Billion) Forecast, by Segment 2, 2018-2029
      Table 11: Europe Intelligent Energy Router Market Revenue (USD Billion) Forecast, by Segment 3, 2018-2029
      Table 12: Europe Intelligent Energy Router Market Revenue (USD Billion) Forecast, by Country, 2018-2029
      Table 13: Latin America Intelligent Energy Router Market Revenue (USD Billion) Forecast, by Segment 1, 2018-2029
      Table 14: Latin America Intelligent Energy Router Market Revenue (USD Billion) Forecast, by Segment 2, 2018-2029
      Table 15: Latin America Intelligent Energy Router Market Revenue (USD Billion) Forecast, by Segment 3, 2018-2029
      Table 16: Latin America Intelligent Energy Router Market Revenue (USD Billion) Forecast, by Country, 2018-2029
      Table 17: Asia Pacific Intelligent Energy Router Market Revenue (USD Billion) Forecast, by Segment 1, 2018-2029
      Table 18: Asia Pacific Intelligent Energy Router Market Revenue (USD Billion) Forecast, by Segment 2, 2018-2029
      Table 19: Asia Pacific Intelligent Energy Router Market Revenue (USD Billion) Forecast, by Segment 3, 2018-2029
      Table 20: Asia Pacific Intelligent Energy Router Market Revenue (USD Billion) Forecast, by Country, 2018-2029
      Table 21: Middle East & Africa Intelligent Energy Router Market Revenue (USD Billion) Forecast, by Segment 1, 2018-2029
      Table 22: Middle East & Africa Intelligent Energy Router Market Revenue (USD Billion) Forecast, by Segment 2, 2018-2029
      Table 23: Middle East & Africa Intelligent Energy Router Market Revenue (USD Billion) Forecast, by Segment 3, 2018-2029
      Table 24: Middle East & Africa Intelligent Energy Router Market Revenue (USD Billion) Forecast, by Country, 2018-2029
      Research Process

      Data Library Research are conducted by industry experts who offer insight on industry structure, market segmentations technology assessment and competitive landscape (CL), and penetration, as well as on emerging trends. Their analysis is based on primary interviews (~ 80%) and secondary research (~ 20%) as well as years of professional expertise in their respective industries. Adding to this, by analysing historical trends and current market positions, our analysts predict where the market will be headed for the next five years. Furthermore, the varying trends of segment & categories geographically presented are also studied and the estimated based on the primary & secondary research.

      In this particular report from the supply side Data Library Research has conducted primary surveys (interviews) with the key level executives (VP, CEO’s, Marketing Director, Business Development Manager and SOFT) of the companies that active & prominent as well as the midsized organization

      FIGURE 1: DLR RESEARH PROCESS

      research-methodology1

      Primary Research

      Extensive primary research was conducted to gain a deeper insight of the market and industry performance. The analysis is based on both primary and secondary research as well as years of professional expertise in the respective industries.

      In addition to analysing current and historical trends, our analysts predict where the market is headed over the next five years.

      It varies by segment for these categories geographically presented in the list of market tables. Speaking about this particular report we have conducted primary surveys (interviews) with the key level executives (VP, CEO’s, Marketing Director, Business Development Manager and many more) of the major players active in the market.

      Secondary Research

      Secondary research was mainly used to collect and identify information useful for the extensive, technical, market-oriented, and Friend’s study of the Global Extra Neutral Alcohol. It was also used to obtain key information about major players, market classification and segmentation according to the industry trends, geographical markets, and developments related to the market and technology perspectives. For this study, analysts have gathered information from various credible sources, such as annual reports, sec filings, journals, white papers, SOFT presentations, and company web sites.

      Market Size Estimation

      Both, top-down and bottom-up approaches were used to estimate and validate the size of the Global market and to estimate the size of various other dependent submarkets in the overall Extra Neutral Alcohol. The key players in the market were identified through secondary research and their market contributions in the respective geographies were determined through primary and secondary research.

      Forecast Model

      research-methodology2