Intelligent Process Automation Market Overview
Organizations throughout the world are applying the IPA to operate their businesses more efficiently. The IPA provides several advantages to the business, including human-robot orchestration, automation of repetitive and scheduled tasks, proper governance and compliance while minimizing risks, process visibility across the entire customer journey, and business agility and speeding up changing business processes.
Businesses can use the IPA to locate, model, assess, improve, optimize, manage, and automate various company procedures in order to increase their efficiency. Companies all over the world are rapidly implementing intelligent process automation solutions to reduce operational costs while maintaining the quality and efficacy of business processes. All these aforementioned factors are majorly contributing to the growth of the global Intelligent Process Automation market.
| Report Metric |
Details |
| Market size available for years |
2023–2030 |
| Base year considered |
2023 |
| Forecast period |
2024–2030 |
| Forecast unit |
Value (USD Million) |
| Segments covered |
Component, End Users, and Region. |
| Regions covered |
North America (the U.S. and Canada), Europe (UK, Germany, France, Italy, Spain, Russia, Rest of Europe), Asia-Pacific (China, India, Japan, Australia, South East Asia, Rest of Asia Pacific), Latin America and the Middle East and Africa (Brazil, Saudi Arabia, UAE, Rest of LAMEA) |
| Companies covered |
UiPath, Inc., SAP SE, Dell EMC Corporation, Blue Prism Group, IBM Corporation, Salesforce.Com, Inc., Capgemini, Cognizant, Pegasystems, Genpact, and Happiest Minds. |
COVID-19 Impact on Intelligent Process Automation Market
Like many other industries, COVID-19 badly knocked the electronic and semiconductor industries. This unprecedented event has impacted nearly 230 countries in just a few weeks, resulting in the forced shutdown of manufacturing and transportation activities within and across the countries. This has directly affected the overall sector's growth. It is estimated that COVID-19 to leave more than USD 30 billion impacts on the electronics and semiconductor industry. The sector is majorly affected due to transport restrictions on major electronics and semiconductor raw material providers. However, the emerging need for semiconductors in several industries will offer rapid market recovery over the future period.
Intelligent Process Automation Market Segment Overview
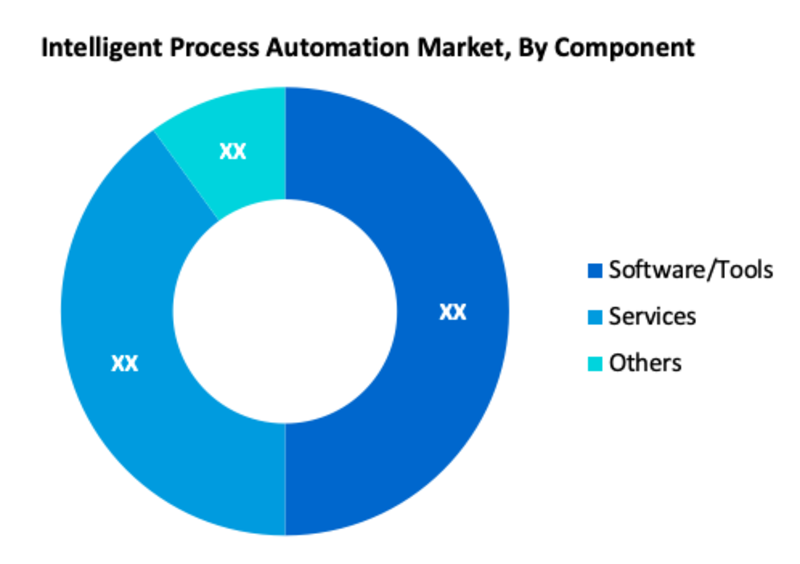
According to Component, Software/Tools is one of the most prominent segments in the global Intelligent Process Automation market. The IPA is available as a whole software package or as a standalone utility. The intelligent process automation market includes IPA applications for a variety of business operations across several industries. Machines with artificial intelligence exploit a large quantity of structured and unstructured data, assess, analyze and learn on the go, and smartly automate procedures to give higher operational efficiency and business efficiency. Furthermore, in the intelligent process automation market, the banking end-user segment has the highest adoption of IPA solutions.
Intelligent Process Automation Market, By Component
· Software/Tools
· Services
· Others
Intelligent Process Automation Market, By End Users
· Telecom and IT
· Banking, Financial Services, and Insurance (BFSI)
· Transport and Logistics
· Healthcare
· Media and Entertainment
· Manufacturing
· Retail and e-commerce
· Others
Intelligent Process Automation Market Regional Overview
In terms of geography, the global Intelligent Process Automation market is classified into North America, South America, Europe, Asia Pacific, and Middle East & Africa. North America is the largest region with the highest share in the global Intelligent Process Automation Market. This is due to the larger adoption of automation and AI in different industries and rising mobile penetration in Canada. Moreover, Europe is another major region for the market. This is due to the growing demand for automation and RPA in European countries such as the U.K., France, Japan, and Germany, Additionally, the market in the Asia Pacific is expected to grow at a significant rate in the forthcoming years.
Intelligent Process Automation Market, By Geography
· North America (US & Canada)
· Europe (UK, Germany, France, Italy, Spain, Russia & Rest of Europe)
· Asia-Pacific (Japan, China, India, Australia, & South Korea, & Rest of Asia-Pacific)
· LAMEA (Brazil, Saudi Arabia, UAE & Rest of LAMEA)
Intelligent Process Automation Market, Key Players
· UiPath, Inc.
· SAP SE
· Dell EMC Corporation
· Blue Prism Group
· IBM Corporation
· Salesforce.Com, Inc.
· Capgemini
· Cognizant
· Pegasystems
· Genpact
· Happiest Minds
Frequently Asked Questions (FAQ) :
Q1. What are the driving factors for the global Intelligent Process Automation market?
Organizations throughout the world are applying the IPA to operate their businesses more efficiently. This factor is expected to rise the growth of the market in the next few years
Q2. Which Segments are covered in the global Intelligent Process Automation market report?
Component, End Users, and Region. these segments are covered in the global Intelligent Process Automation market report
Q3. Which segment is projected to hold the largest share in the global Intelligent Process Automation market. ?
The software/Tools segment is projected to hold the largest share in the global Intelligent Process Automation market.
Q4. Which region holds the largest share in the global Intelligent Process Automation market?
North America holds the largest share in the global Intelligent Process Automation market.
Q5. Which are the prominent players in the global Intelligent Process Automation market?
UiPath, Inc., SAP SE, Dell EMC Corporation, Blue Prism Group, IBM Corporation, Salesforce.Com, Inc., Capgemini, Cognizant, Pegasystems, Genpact, and Happiest Minds. are some key players in the global Intelligent Process Automation market
List of Figures
Figure 1: Global Intelligent Process Automation (IPA) Market Revenue Breakdown (USD Billion, %) by Region, 2019 & 2027
Figure 2: Global Intelligent Process Automation (IPA) Market Value Share (%), By Segment 1, 2019 & 2027
Figure 3: Global Intelligent Process Automation (IPA) Market Forecast (USD Billion), by Sub-Segment 1, 2016-2027
Figure 4: Global Intelligent Process Automation (IPA) Market Forecast (USD Billion), by Sub-Segment 2, 2016-2027
Figure 5: Global Intelligent Process Automation (IPA) Market Value Share (%), By Segment 2, 2019 & 2027
Figure 6: Global Intelligent Process Automation (IPA) Market Forecast (USD Billion), by Sub-Segment 1, 2016-2027
Figure 7: Global Intelligent Process Automation (IPA) Market Forecast (USD Billion), by Sub-Segment 2, 2016-2027
Figure 8: Global Intelligent Process Automation (IPA) Market Forecast (USD Billion), by Sub-Segment 3, 2016-2027
Figure 9: Global Intelligent Process Automation (IPA) Market Forecast (USD Billion), by Others, 2016-2027
Figure 10: Global Intelligent Process Automation (IPA) Market Value Share (%), By Segment 3, 2019 & 2027
Figure 11: Global Intelligent Process Automation (IPA) Market Forecast (USD Billion), by Sub-Segment 1, 2016-2027
Figure 12: Global Intelligent Process Automation (IPA) Market Forecast (USD Billion), by Sub-Segment 2, 2016-2027
Figure 13: Global Intelligent Process Automation (IPA) Market Forecast (USD Billion), by Sub-Segment 3, 2016-2027
Figure 14: Global Intelligent Process Automation (IPA) Market Forecast (USD Billion), by Others, 2016-2027
Figure 15: Global Intelligent Process Automation (IPA) Market Value (USD Billion), by Region, 2019 & 2027
Figure 16: North America Intelligent Process Automation (IPA) Market Value Share (%), By Segment 1, 2019 & 2027
Figure 17: North America Intelligent Process Automation (IPA) Market Forecast (USD Billion), by Sub-Segment 1, 2016-2027
Figure 18: North America Intelligent Process Automation (IPA) Market Forecast (USD Billion), by Sub-Segment 2, 2016-2027
Figure 19: North America Intelligent Process Automation (IPA) Market Value Share (%), By Segment 2, 2019 & 2027
Figure 20: North America Intelligent Process Automation (IPA) Market Forecast (USD Billion), by Sub-Segment 1, 2016-2027
Figure 21: North America Intelligent Process Automation (IPA) Market Forecast (USD Billion), by Sub-Segment 2, 2016-2027
Figure 22: North America Intelligent Process Automation (IPA) Market Forecast (USD Billion), by Sub-Segment 3, 2016-2027
Figure 23: North America Intelligent Process Automation (IPA) Market Forecast (USD Billion), by Others, 2016-2027
Figure 24: North America Intelligent Process Automation (IPA) Market Value Share (%), By Segment 3, 2019 & 2027
Figure 25: North America Intelligent Process Automation (IPA) Market Forecast (USD Billion), by Sub-Segment 1, 2016-2027
Figure 26: North America Intelligent Process Automation (IPA) Market Forecast (USD Billion), by Sub-Segment 2, 2016-2027
Figure 27: North America Intelligent Process Automation (IPA) Market Forecast (USD Billion), by Sub-Segment 3, 2016-2027
Figure 28: North America Intelligent Process Automation (IPA) Market Forecast (USD Billion), by Others, 2016-2027
Figure 29: North America Intelligent Process Automation (IPA) Market Forecast (USD Billion), by U.S., 2016-2027
Figure 30: North America Intelligent Process Automation (IPA) Market Forecast (USD Billion), by Canada, 2016-2027
Figure 31: Latin America Intelligent Process Automation (IPA) Market Value Share (%), By Segment 1, 2019 & 2027
Figure 32: Latin America Intelligent Process Automation (IPA) Market Forecast (USD Billion), by Sub-Segment 1, 2016-2027
Figure 33: Latin America Intelligent Process Automation (IPA) Market Forecast (USD Billion), by Sub-Segment 2, 2016-2027
Figure 34: Latin America Intelligent Process Automation (IPA) Market Value Share (%), By Segment 2, 2019 & 2027
Figure 35: Latin America Intelligent Process Automation (IPA) Market Forecast (USD Billion), by Sub-Segment 1, 2016-2027
Figure 36: Latin America Intelligent Process Automation (IPA) Market Forecast (USD Billion), by Sub-Segment 2, 2016-2027
Figure 37: Latin America Intelligent Process Automation (IPA) Market Forecast (USD Billion), by Sub-Segment 3, 2016-2027
Figure 38: Latin America Intelligent Process Automation (IPA) Market Forecast (USD Billion), by Others, 2016-2027
Figure 39: Latin America Intelligent Process Automation (IPA) Market Value Share (%), By Segment 3, 2019 & 2027
Figure 40: Latin America Intelligent Process Automation (IPA) Market Forecast (USD Billion), by Sub-Segment 1, 2016-2027
Figure 41: Latin America Intelligent Process Automation (IPA) Market Forecast (USD Billion), by Sub-Segment 2, 2016-2027
Figure 42: Latin America Intelligent Process Automation (IPA) Market Forecast (USD Billion), by Sub-Segment 3, 2016-2027
Figure 43: Latin America Intelligent Process Automation (IPA) Market Forecast (USD Billion), by Others, 2016-2027
Figure 44: Latin America Intelligent Process Automation (IPA) Market Forecast (USD Billion), by Brazil, 2016-2027
Figure 45: Latin America Intelligent Process Automation (IPA) Market Forecast (USD Billion), by Mexico, 2016-2027
Figure 46: Latin America Intelligent Process Automation (IPA) Market Forecast (USD Billion), by Rest of Latin America, 2016-2027
Figure 47: Europe Intelligent Process Automation (IPA) Market Value Share (%), By Segment 1, 2019 & 2027
Figure 48: Europe Intelligent Process Automation (IPA) Market Forecast (USD Billion), by Sub-Segment 1, 2016-2027
Figure 49: Europe Intelligent Process Automation (IPA) Market Forecast (USD Billion), by Sub-Segment 2, 2016-2027
Figure 50: Europe Intelligent Process Automation (IPA) Market Value Share (%), By Segment 2, 2019 & 2027
Figure 51: Europe Intelligent Process Automation (IPA) Market Forecast (USD Billion), by Sub-Segment 1, 2016-2027
Figure 52: Europe Intelligent Process Automation (IPA) Market Forecast (USD Billion), by Sub-Segment 2, 2016-2027
Figure 53: Europe Intelligent Process Automation (IPA) Market Forecast (USD Billion), by Sub-Segment 3, 2016-2027
Figure 54: Europe Intelligent Process Automation (IPA) Market Forecast (USD Billion), by Others, 2016-2027
Figure 55: Europe Intelligent Process Automation (IPA) Market Value Share (%), By Segment 3, 2019 & 2027
Figure 56: Europe Intelligent Process Automation (IPA) Market Forecast (USD Billion), by Sub-Segment 1, 2016-2027
Figure 57: Europe Intelligent Process Automation (IPA) Market Forecast (USD Billion), by Sub-Segment 2, 2016-2027
Figure 58: Europe Intelligent Process Automation (IPA) Market Forecast (USD Billion), by Sub-Segment 3, 2016-2027
Figure 59: Europe Intelligent Process Automation (IPA) Market Forecast (USD Billion), by Others, 2016-2027
Figure 60: Europe Intelligent Process Automation (IPA) Market Forecast (USD Billion), by U.K., 2016-2027
Figure 61: Europe Intelligent Process Automation (IPA) Market Forecast (USD Billion), by Germany, 2016-2027
Figure 62: Europe Intelligent Process Automation (IPA) Market Forecast (USD Billion), by France, 2016-2027
Figure 63: Europe Intelligent Process Automation (IPA) Market Forecast (USD Billion), by Italy, 2016-2027
Figure 64: Europe Intelligent Process Automation (IPA) Market Forecast (USD Billion), by Spain, 2016-2027
Figure 65: Europe Intelligent Process Automation (IPA) Market Forecast (USD Billion), by Russia, 2016-2027
Figure 66: Europe Intelligent Process Automation (IPA) Market Forecast (USD Billion), by Rest of Europe, 2016-2027
Figure 67: Asia Pacific Intelligent Process Automation (IPA) Market Value Share (%), By Segment 1, 2019 & 2027
Figure 68: Asia Pacific Intelligent Process Automation (IPA) Market Forecast (USD Billion), by Sub-Segment 1, 2016-2027
Figure 69: Asia Pacific Intelligent Process Automation (IPA) Market Forecast (USD Billion), by Sub-Segment 2, 2016-2027
Figure 70: Asia Pacific Intelligent Process Automation (IPA) Market Value Share (%), By Segment 2, 2019 & 2027
Figure 71: Asia Pacific Intelligent Process Automation (IPA) Market Forecast (USD Billion), by Sub-Segment 1, 2016-2027
Figure 72: Asia Pacific Intelligent Process Automation (IPA) Market Forecast (USD Billion), by Sub-Segment 2, 2016-2027
Figure 73: Asia Pacific Intelligent Process Automation (IPA) Market Forecast (USD Billion), by Sub-Segment 3, 2016-2027
Figure 74: Asia Pacific Intelligent Process Automation (IPA) Market Forecast (USD Billion), by Others, 2016-2027
Figure 75: Asia Pacific Intelligent Process Automation (IPA) Market Value Share (%), By Segment 3, 2019 & 2027
Figure 76: Asia Pacific Intelligent Process Automation (IPA) Market Forecast (USD Billion), by Sub-Segment 1, 2016-2027
Figure 77: Asia Pacific Intelligent Process Automation (IPA) Market Forecast (USD Billion), by Sub-Segment 2, 2016-2027
Figure 78: Asia Pacific Intelligent Process Automation (IPA) Market Forecast (USD Billion), by Sub-Segment 3, 2016-2027
Figure 79: Asia Pacific Intelligent Process Automation (IPA) Market Forecast (USD Billion), by Others, 2016-2027
Figure 80: Asia Pacific Intelligent Process Automation (IPA) Market Forecast (USD Billion), by China, 2016-2027
Figure 81: Asia Pacific Intelligent Process Automation (IPA) Market Forecast (USD Billion), by India, 2016-2027
Figure 82: Asia Pacific Intelligent Process Automation (IPA) Market Forecast (USD Billion), by Japan, 2016-2027
Figure 83: Asia Pacific Intelligent Process Automation (IPA) Market Forecast (USD Billion), by Australia, 2016-2027
Figure 84: Asia Pacific Intelligent Process Automation (IPA) Market Forecast (USD Billion), by Southeast Asia, 2016-2027
Figure 85: Asia Pacific Intelligent Process Automation (IPA) Market Forecast (USD Billion), by Rest of Asia Pacific, 2016-2027
Figure 86: Middle East & Africa Intelligent Process Automation (IPA) Market Value Share (%), By Segment 1, 2019 & 2027
Figure 87: Middle East & Africa Intelligent Process Automation (IPA) Market Forecast (USD Billion), by Sub-Segment 1, 2016-2027
Figure 88: Middle East & Africa Intelligent Process Automation (IPA) Market Forecast (USD Billion), by Sub-Segment 2, 2016-2027
Figure 89: Middle East & Africa Intelligent Process Automation (IPA) Market Value Share (%), By Segment 2, 2019 & 2027
Figure 90: Middle East & Africa Intelligent Process Automation (IPA) Market Forecast (USD Billion), by Sub-Segment 1, 2016-2027
Figure 91: Middle East & Africa Intelligent Process Automation (IPA) Market Forecast (USD Billion), by Sub-Segment 2, 2016-2027
Figure 92: Middle East & Africa Intelligent Process Automation (IPA) Market Forecast (USD Billion), by Sub-Segment 3, 2016-2027
Figure 93: Middle East & Africa Intelligent Process Automation (IPA) Market Forecast (USD Billion), by Others, 2016-2027
Figure 94: Middle East & Africa Intelligent Process Automation (IPA) Market Value Share (%), By Segment 3, 2019 & 2027
Figure 95: Middle East & Africa Intelligent Process Automation (IPA) Market Forecast (USD Billion), by Sub-Segment 1, 2016-2027
Figure 96: Middle East & Africa Intelligent Process Automation (IPA) Market Forecast (USD Billion), by Sub-Segment 2, 2016-2027
Figure 97: Middle East & Africa Intelligent Process Automation (IPA) Market Forecast (USD Billion), by Sub-Segment 3, 2016-2027
Figure 98: Middle East & Africa Intelligent Process Automation (IPA) Market Forecast (USD Billion), by Others, 2016-2027
Figure 99: Middle East & Africa Intelligent Process Automation (IPA) Market Forecast (USD Billion), by GCC, 2016-2027
Figure 100: Middle East & Africa Intelligent Process Automation (IPA) Market Forecast (USD Billion), by South Africa, 2016-2027
Figure 101: Middle East & Africa Intelligent Process Automation (IPA) Market Forecast (USD Billion), by Rest of Middle East & Africa, 2016-2027
List of Tables
Table 1: Global Intelligent Process Automation (IPA) Market Revenue (USD Billion) Forecast, by Segment 1, 2016-2027
Table 2: Global Intelligent Process Automation (IPA) Market Revenue (USD Billion) Forecast, by Segment 2, 2016-2027
Table 3: Global Intelligent Process Automation (IPA) Market Revenue (USD Billion) Forecast, by Segment 3, 2016-2027
Table 4: Global Intelligent Process Automation (IPA) Market Revenue (USD Billion) Forecast, by Region, 2016-2027
Table 5: North America Intelligent Process Automation (IPA) Market Revenue (USD Billion) Forecast, by Segment 1, 2016-2027
Table 6: North America Intelligent Process Automation (IPA) Market Revenue (USD Billion) Forecast, by Segment 2, 2016-2027
Table 7: North America Intelligent Process Automation (IPA) Market Revenue (USD Billion) Forecast, by Segment 3, 2016-2027
Table 8: North America Intelligent Process Automation (IPA) Market Revenue (USD Billion) Forecast, by Country, 2016-2027
Table 9: Europe Intelligent Process Automation (IPA) Market Revenue (USD Billion) Forecast, by Segment 1, 2016-2027
Table 10: Europe Intelligent Process Automation (IPA) Market Revenue (USD Billion) Forecast, by Segment 2, 2016-2027
Table 11: Europe Intelligent Process Automation (IPA) Market Revenue (USD Billion) Forecast, by Segment 3, 2016-2027
Table 12: Europe Intelligent Process Automation (IPA) Market Revenue (USD Billion) Forecast, by Country, 2016-2027
Table 13: Latin America Intelligent Process Automation (IPA) Market Revenue (USD Billion) Forecast, by Segment 1, 2016-2027
Table 14: Latin America Intelligent Process Automation (IPA) Market Revenue (USD Billion) Forecast, by Segment 2, 2016-2027
Table 15: Latin America Intelligent Process Automation (IPA) Market Revenue (USD Billion) Forecast, by Segment 3, 2016-2027
Table 16: Latin America Intelligent Process Automation (IPA) Market Revenue (USD Billion) Forecast, by Country, 2016-2027
Table 17: Asia Pacific Intelligent Process Automation (IPA) Market Revenue (USD Billion) Forecast, by Segment 1, 2016-2027
Table 18: Asia Pacific Intelligent Process Automation (IPA) Market Revenue (USD Billion) Forecast, by Segment 2, 2016-2027
Table 19: Asia Pacific Intelligent Process Automation (IPA) Market Revenue (USD Billion) Forecast, by Segment 3, 2016-2027
Table 20: Asia Pacific Intelligent Process Automation (IPA) Market Revenue (USD Billion) Forecast, by Country, 2016-2027
Table 21: Middle East & Africa Intelligent Process Automation (IPA) Market Revenue (USD Billion) Forecast, by Segment 1, 2016-2027
Table 22: Middle East & Africa Intelligent Process Automation (IPA) Market Revenue (USD Billion) Forecast, by Segment 2, 2016-2027
Table 23: Middle East & Africa Intelligent Process Automation (IPA) Market Revenue (USD Billion) Forecast, by Segment 3, 2016-2027
Table 24: Middle East & Africa Intelligent Process Automation (IPA) Market Revenue (USD Billion) Forecast, by Country, 2016-2027
Research Process
Data Library Research are conducted by industry experts who offer insight on
industry structure, market segmentations technology assessment and competitive landscape (CL), and penetration, as well as on emerging trends. Their analysis is based on primary interviews (~ 80%) and secondary research (~ 20%) as well as years of professional expertise in their respective industries. Adding to this, by analysing historical trends and current market positions, our analysts predict where the market will be headed for the next five years. Furthermore, the varying trends of segment & categories geographically presented are also studied and the estimated based on the primary & secondary research.
In this particular report from the supply side Data Library Research has conducted primary surveys (interviews) with the key level executives (VP, CEO’s, Marketing Director, Business Development Manager
and SOFT) of the companies that active & prominent as well as the midsized organization
FIGURE 1: DLR RESEARH PROCESS
![research-methodology1]()
Primary Research
Extensive primary research was conducted to gain a deeper insight of the market and industry performance. The analysis is based on both primary and secondary research as well as years of professional expertise in the respective industries.
In addition to analysing current and historical trends, our analysts predict where the market is headed over the next five years.
It varies by segment for these categories geographically presented in the list of market tables. Speaking about this particular report we have conducted primary surveys (interviews) with the key level executives (VP, CEO’s, Marketing Director, Business Development Manager and many more) of the major players active in the market.
Secondary Research
Secondary research was mainly used to collect and identify information useful for the extensive, technical, market-oriented, and Friend’s study of the Global Extra Neutral Alcohol. It was also used to obtain key information about major players, market classification and segmentation according to the industry trends, geographical markets, and developments related to the market and technology perspectives. For this study, analysts have gathered information from various credible sources, such as annual reports, sec filings, journals, white papers, SOFT presentations, and company web sites.
Market Size Estimation
Both, top-down and bottom-up approaches were used to estimate and validate the size of the Global market and to estimate the size of various other dependent submarkets in the overall Extra Neutral Alcohol. The key players in the market were identified through secondary research and their market contributions in the respective geographies were determined through primary and secondary research.
Forecast Model
![research-methodology2]()