Lithium Battery Composite Current Collector Market Overview and Analysis
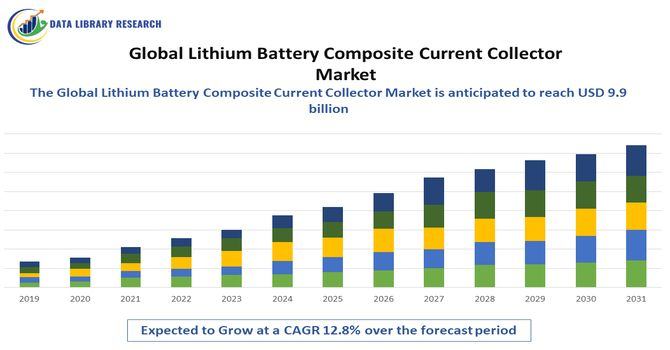
- The Global Lithium Battery Composite Current Collector Market size was valued at USD 4.07 billion in 2025 and is forecasted to grow at a CAGR of 12.8% from 2025 to 2032, reaching USD 9.9 billion by 2032.
Get Complete Analysis Of The Report - Download Updated Free Sample PDF
The Global Lithium Battery Composite Current Collector Market is witnessing strong growth, primarily driven by the rising demand for high-performance lithium-ion batteries in electric vehicles, consumer electronics, and renewable energy storage. Composite current collectors, offering advantages such as reduced weight, enhanced conductivity, and improved mechanical stability over traditional metal collectors, are increasingly preferred in next-generation battery technologies. Key factors fueling market expansion include the global shift toward sustainable transportation, the need for lightweight and efficient energy storage solutions, and continuous advancements in battery materials and design. Overall, the market is shaped by technological innovation, increasing adoption of electric mobility, and the drive for improved battery efficiency, positioning composite current collectors as a critical component in modern lithium-ion batteries.
Lithium Battery Composite Current Collector Market Latest Trends
Recent advancements in composite materials like carbon fiber and nanotube-based current collectors have enhanced lithium-ion battery performance by reducing weight and boosting conductivity, leading to higher energy density and efficiency. The integration of advanced high-conductivity coatings further improves electrochemical stability and battery lifespan by lowering internal resistance. Concurrently, the development of metal-free current collectors aims to cut battery weight and avoid costly, environmentally challenging metals. MXene-based collectors, known for their conductivity and strength, are emerging as promising alternatives that enhance performance while minimizing weight and thickness. A growing focus on sustainability has driven efforts to create recyclable current collectors, supporting circular economy goals. Significant investments in research and development continue to fuel innovation, addressing evolving demands for battery performance, cost, and environmental impact.
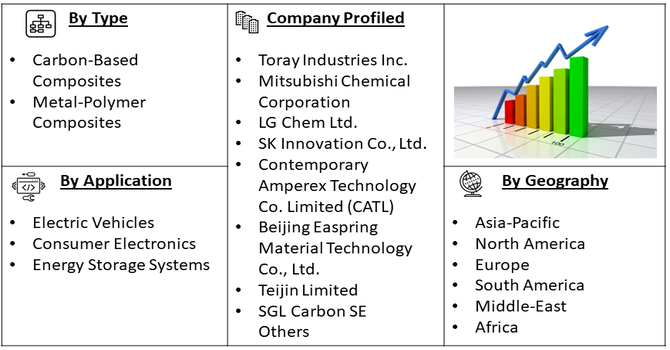
Segmentation: The Global Lithium Battery Composite Current Collector Market is segmented by Material Type (Carbon-Based Composites, Metal-Polymer Composites), Battery Type (Lithium-Ion Batteries, Lithium-Polymer Batteries), End-Use Application (Electric Vehicles, Consumer Electronics, Energy Storage Systems), and Geography (North America, Europe, Asia-Pacific, Middle East and Africa, and South America). The report provides the value (in USD million) for the above segments.
For Detailed Market Segmentation - Get a Free Sample PDF
Market Drivers:
Rising Demand for Electric Vehicles (EVs)
The rapid global adoption of electric vehicles is a major driver for the lithium battery composite current collector market. EVs require lightweight, high-performance batteries with enhanced energy density and efficiency, making composite current collectors essential for reducing battery weight and improving overall vehicle performance. Government incentives and increasing environmental regulations further accelerate EV adoption, driving demand for advanced battery components.
In September 2025, BMW Group and E.ON launched Germany’s first solution allowing electric vehicles to actively participate in the energy market. This innovation enabled EVs to provide grid services, enhancing energy efficiency and sustainability. The development supported increased EV adoption by adding value through energy integration. As a result, it boosted demand for advanced lithium battery technologies, positively influencing the Global Lithium Battery Composite Current Collector Market by driving innovation and growth in energy-efficient battery components.
- Advancements in Battery Technology
Continuous innovation in lithium-ion and lithium-polymer battery technologies is fueling the need for high-performance composite current collectors. These collectors enhance electrical conductivity, mechanical stability, and thermal management, supporting longer battery life, faster charging, and improved safety. As industries such as consumer electronics, renewable energy storage, and industrial applications seek more efficient energy storage solutions, the demand for advanced composite current collectors grows significantly.
In September 2025, Tata Power and Tata Passenger Electric Mobility Ltd. jointly inaugurated Mumbai’s first large-scale premium EV charging hub near Terminal 2 at Chhatrapati Shivaji Maharaj International Airport. The TATA.ev MegaCharger hub, equipped with eight fast DC chargers and 16 charging bays, catered to diverse EV users, reducing wait times and enhancing accessibility. This initiative accelerated EV adoption by improving charging infrastructure, driving demand for advanced lithium battery components. Consequently, it positively impacted the Global Lithium Battery Composite Current Collector Market, by supporting the growth of electric vehicles and stimulating innovation in battery technologies.
Market Restraints:
- High Manufacturing Cost of Composite Current Collectors
A primary challenge is the high manufacturing cost of composite current collectors, which involve advanced materials such as carbon fibers, nanotubes, or metal-polymer composites and require sophisticated fabrication processes. Additionally, limited availability of high-quality raw materials can impact large-scale production and increase supply chain dependency. Technological integration challenges also pose a barrier, as incorporating composite current collectors into existing battery manufacturing lines requires significant investment and adaptation. Finally, the competition from traditional metal current collectors, which are less expensive and easier to produce, may slow the adoption rate of composite alternatives despite their performance advantages.
Socio Economic impact on Lithium Battery Composite Current Collector Market
The Global Lithium Battery Composite Current Collector Market has significant socio-economic impacts by driving advancements in energy storage technologies critical for electric vehicles, portable electronics, and renewable energy systems. This market supports job creation across manufacturing, research, and supply chains, fostering economic growth in key regions. Improved battery performance enhances access to clean energy solutions, contributing to environmental sustainability and reducing reliance on fossil fuels. Additionally, the market’s growth promotes technological innovation and global competitiveness, while supporting energy security and improving quality of life through more efficient, affordable, and reliable energy storage options worldwide.
Segmental Analysis:
- Carbon-Based Composites segment is expected to witness highest growth over the forecast period
The carbon-based composites segment is expected to witness the highest growth due to its superior conductivity, lightweight nature, and mechanical flexibility. These properties make it ideal for high-performance lithium-ion and lithium-polymer batteries, enabling better energy density and longer battery life, particularly in applications like electric vehicles and consumer electronics.
Additionally, the increasing demand for lightweight and efficient energy storage solutions across industries is fueling the adoption of carbon-based composites. Manufacturers are investing in advanced composite materials to enhance battery safety, durability, and overall performance. Technological advancements and cost reductions in production processes are further driving market expansion. As a result, the carbon-based composites segment is poised to play a critical role in shaping the future of lithium battery technology, supporting the growth of electric vehicles and portable electronic devices globally.
- Lithium-Ion Batteries segment is expected to witness highest growth over the forecast period
Lithium-ion batteries dominate the market as they are widely used in electric vehicles, portable electronics, and energy storage systems. The integration of composite current collectors in Li-ion batteries improves charge/discharge efficiency, thermal management, and mechanical stability, driving increased adoption across various sectors.
Furthermore, ongoing research and development in composite current collectors are enhancing the performance and safety of lithium-ion batteries, making them more reliable and cost-effective. This has led to broader acceptance in emerging applications such as grid storage and renewable energy integration. As industries prioritize sustainability and efficiency, the demand for lithium-ion batteries with advanced composite components continues to rise, reinforcing their dominance and driving innovation within the global battery market.
- Electric Vehicles segment is expected to witness highest growth over the forecast period
The EV segment is a major driver for the market, as lightweight and high-performance batteries are crucial to enhancing vehicle range, efficiency, and safety. The growing adoption of electric vehicles worldwide, supported by government incentives and environmental regulations, fuels demand for advanced composite current collectors.
India registered 5.675 million electric vehicles by February 2025, showcasing rapid clean mobility adoption. Government initiatives such as FAME II, PM E-Drive, PLI schemes, and PM e-Bus Sewa accelerated investment, localization, and large-scale EV deployment. Prime Minister Narendra Modi inaugurated Made-in-India e-VITARA EVs, establishing India as Suzuki’s global hub for clean mobility exports. This surge in India’s EV market boosted demand for lithium battery components, indirectly impacting the Global Lithium Battery Composite Current Collector Market by driving supply chain diversification and innovation, including in the North American region.
- North America segment is expected to witness highest growth over the forecast period
North America leads the market due to strong R&D investment, advanced battery manufacturing infrastructure, and early adoption of electric vehicles. The presence of key manufacturers and supportive government policies accelerates the integration of innovative composite materials into next-generation battery technologies. For instance, in September 2025, Sunrise New Energy Co., Ltd., through its subsidiary, secured U.S. Patent No. US 12,371,341 B2 for an innovative method to produce high-performance graphite composite anode materials. This technology improved initial efficiency and power performance by integrating porous titanium dioxide with lithium salts and graphite. The patent enhanced Sunrise’s competitive position and strengthened its presence in the North American market. This advancement boosted the Global Lithium Battery Composite Current Collector Market in the NA region by driving demand for superior anode materials and fostering new industry collaborations.
Similarly, in January 2025, Lyten, a Silicon Valley pioneer in tunable 3D graphene, partnered with Stellantis to develop advanced lithium-sulfur EV batteries, vehicle lightweighting, and enhanced sensing solutions. Lithium-sulfur batteries offered over twice the energy density of lithium-ion and provided a nickel-manganese-cobalt-free cathode alternative. Stellantis explored diverse battery technologies to meet customer needs while promoting clean, safe, and affordable mobility. This collaboration drove innovation and increased demand for advanced materials, positively impacting the Global Lithium Battery Composite Current Collector Market in the North American region.
Thus, the growth of the market is driven by the combination of advanced materials, high-demand battery types, expanding EV adoption, and regional technological leadership.
| Report Matrics |
Details |
| Market Size Value |
USD 9.9 billion |
| Growth Rate |
CAGR of 12.8% |
| Forecast |
2026-2033 |
| Historical data |
2021-2024 |
| Base Year |
2025 |
| Report Coverage |
Forecasted revenue, company rating, competitive environment, growth drivers, and trends |
| Segment Coverage |
Type, Application, End-User, Geography |
| Regional Scope |
North America, Europe, Asia Pacific, Middle East |
| Customized scope |
Free customization of reports (With 3 months Analysis Support ) |
| To Learn More About This Report |
Request a Free Sample Copy |
Lithium Battery Composite Current Collector Market Competitive Landscape
The Global Lithium Battery Composite Current Collector Market is characterized by a dynamic competitive landscape, featuring a mix of established industry leaders and emerging innovators. These companies are actively engaged in the development and production of advanced composite current collectors, which are critical components in enhancing the performance, safety, and efficiency of lithium-ion and lithium-polymer batteries used in applications such as electric vehicles (EVs), consumer electronics, and energy storage systems.
The 20 major players for above market are:
- Toray Industries Inc.
- Mitsubishi Chemical Corporation
- LG Chem Ltd.
- SK Innovation Co., Ltd.
- Contemporary Amperex Technology Co. Limited (CATL)
- Beijing Easpring Material Technology Co., Ltd.
- Teijin Limited
- Asahi Kasei Corporation
- UACJ Corporation
- Sumitomo Electric Industries Ltd.
- SGL Carbon SE
- 3M Company
- Hitachi Zosen Corporation
- CIS Corporation
- Shanghai Energy New Materials Technology Co., Ltd. (SEMCORP)
- NEOM Material Technology Co., Ltd.
- Fujikura Ltd.
- Nippon Steel Corporation
- Advanced Materials Technology (Beijing) Co., Ltd. (AMTech)
- Zhejiang Huayou Cobalt Co., Ltd
Recent Development
- In April 2025, Researchers at Dongguk University developed a novel hybrid anode material with enhanced energy storage and stability by combining graphene oxide and nickel-iron compounds. This breakthrough advanced lithium-ion battery technology and boosted demand for high-performance materials. It positively impacted the Global Lithium Battery Composite Current Collector Market by driving innovation and market growth.
- In December 2025, Stellantis N.V. and Zeta Energy Corp. announced a joint development agreement to advance lithium-sulfur battery technology for electric vehicles, targeting higher gravimetric energy density with comparable volumetric density to lithium-ion batteries. The partnership aimed to deliver lighter battery packs with extended range, improved handling, and up to 50% faster charging. This technology also promised to reduce costs to less than half of current lithium-ion batteries per kWh. The breakthrough accelerated innovation in the Global Lithium Battery Composite Current Collector Market by driving demand for advanced materials and enabling next-generation battery designs.
Frequently Asked Questions (FAQ) :
Q1. What the main growth driving factors for this market?
The market is powerfully driven by the escalating demand for Electric Vehicles (EVs) and large-scale Energy Storage Systems (ESS). Composite current collectors offer significant advantages like reduced battery weight, increased energy density, and improved safety compared to traditional metal foils. Furthermore, stringent global regulations promoting clean energy and EVs fuel the need for advanced battery components.
Q2. What are the main restraining factors for this market?
Major restraints include the complex manufacturing process of composite materials, which necessitates continuous R&D and specialized equipment, leading to high production costs. Also, ensuring the long-term electrochemical stability and mechanical strength of the ultra-thin composite layer in high-performance battery cycles presents a significant technical challenge for mass-scale adoption.
Q3. Which segment is expected to witness high growth?
The Composite Aluminum Foil segment is expected to witness high growth due to its cost-effectiveness and lower weight compared to traditional copper. In terms of application, the Electric Vehicle (EV) segment will be the dominant driver, as composite collectors are crucial for achieving the lightweight and high-energy-density batteries required to increase EV range and performance.
Q4. Who are the top major players for this market?
The market is led by companies specializing in advanced materials and battery components, particularly those based in Asia-Pacific. Key players include Wanshun New Material, Shenzhen Baoming Technology, Shuangxing Color Plastic New Materials, Guangdong Jiayuan Technology, and Nuode New Materials. Battery giants like CATL and LG Energy Solution also significantly influence the market through high demand.
Q5. Which country is the largest player?
United States is the largest and most dominant player, driven by its unparalleled global leadership in both EV production and lithium-ion battery manufacturing capacity. The country possesses a massive and integrated supply chain, strong government policy support for new energy vehicles, and a heavy concentration of the key composite current collector component manufacturers.
List of Figures
Figure 1: Global Lithium Battery Composite Current Collector Market Revenue Breakdown (USD Billion, %) by Region, 2022 & 2029
Figure 2: Global Lithium Battery Composite Current Collector Market Value Share (%), By Segment 1, 2022 & 2029
Figure 3: Global Lithium Battery Composite Current Collector Market Forecast (USD Billion), by Sub-Segment 1, 2018-2029
Figure 4: Global Lithium Battery Composite Current Collector Market Forecast (USD Billion), by Sub-Segment 2, 2018-2029
Figure 5: Global Lithium Battery Composite Current Collector Market Value Share (%), By Segment 2, 2022 & 2029
Figure 6: Global Lithium Battery Composite Current Collector Market Forecast (USD Billion), by Sub-Segment 1, 2018-2029
Figure 7: Global Lithium Battery Composite Current Collector Market Forecast (USD Billion), by Sub-Segment 2, 2018-2029
Figure 8: Global Lithium Battery Composite Current Collector Market Forecast (USD Billion), by Sub-Segment 3, 2018-2029
Figure 9: Global Lithium Battery Composite Current Collector Market Forecast (USD Billion), by Others, 2018-2029
Figure 10: Global Lithium Battery Composite Current Collector Market Value Share (%), By Segment 3, 2022 & 2029
Figure 11: Global Lithium Battery Composite Current Collector Market Forecast (USD Billion), by Sub-Segment 1, 2018-2029
Figure 12: Global Lithium Battery Composite Current Collector Market Forecast (USD Billion), by Sub-Segment 2, 2018-2029
Figure 13: Global Lithium Battery Composite Current Collector Market Forecast (USD Billion), by Sub-Segment 3, 2018-2029
Figure 14: Global Lithium Battery Composite Current Collector Market Forecast (USD Billion), by Others, 2018-2029
Figure 15: Global Lithium Battery Composite Current Collector Market Value (USD Billion), by Region, 2022 & 2029
Figure 16: North America Lithium Battery Composite Current Collector Market Value Share (%), By Segment 1, 2022 & 2029
Figure 17: North America Lithium Battery Composite Current Collector Market Forecast (USD Billion), by Sub-Segment 1, 2018-2029
Figure 18: North America Lithium Battery Composite Current Collector Market Forecast (USD Billion), by Sub-Segment 2, 2018-2029
Figure 19: North America Lithium Battery Composite Current Collector Market Value Share (%), By Segment 2, 2022 & 2029
Figure 20: North America Lithium Battery Composite Current Collector Market Forecast (USD Billion), by Sub-Segment 1, 2018-2029
Figure 21: North America Lithium Battery Composite Current Collector Market Forecast (USD Billion), by Sub-Segment 2, 2018-2029
Figure 22: North America Lithium Battery Composite Current Collector Market Forecast (USD Billion), by Sub-Segment 3, 2018-2029
Figure 23: North America Lithium Battery Composite Current Collector Market Forecast (USD Billion), by Others, 2018-2029
Figure 24: North America Lithium Battery Composite Current Collector Market Value Share (%), By Segment 3, 2022 & 2029
Figure 25: North America Lithium Battery Composite Current Collector Market Forecast (USD Billion), by Sub-Segment 1, 2018-2029
Figure 26: North America Lithium Battery Composite Current Collector Market Forecast (USD Billion), by Sub-Segment 2, 2018-2029
Figure 27: North America Lithium Battery Composite Current Collector Market Forecast (USD Billion), by Sub-Segment 3, 2018-2029
Figure 28: North America Lithium Battery Composite Current Collector Market Forecast (USD Billion), by Others, 2018-2029
Figure 29: North America Lithium Battery Composite Current Collector Market Forecast (USD Billion), by U.S., 2018-2029
Figure 30: North America Lithium Battery Composite Current Collector Market Forecast (USD Billion), by Canada, 2018-2029
Figure 31: Latin America Lithium Battery Composite Current Collector Market Value Share (%), By Segment 1, 2022 & 2029
Figure 32: Latin America Lithium Battery Composite Current Collector Market Forecast (USD Billion), by Sub-Segment 1, 2018-2029
Figure 33: Latin America Lithium Battery Composite Current Collector Market Forecast (USD Billion), by Sub-Segment 2, 2018-2029
Figure 34: Latin America Lithium Battery Composite Current Collector Market Value Share (%), By Segment 2, 2022 & 2029
Figure 35: Latin America Lithium Battery Composite Current Collector Market Forecast (USD Billion), by Sub-Segment 1, 2018-2029
Figure 36: Latin America Lithium Battery Composite Current Collector Market Forecast (USD Billion), by Sub-Segment 2, 2018-2029
Figure 37: Latin America Lithium Battery Composite Current Collector Market Forecast (USD Billion), by Sub-Segment 3, 2018-2029
Figure 38: Latin America Lithium Battery Composite Current Collector Market Forecast (USD Billion), by Others, 2018-2029
Figure 39: Latin America Lithium Battery Composite Current Collector Market Value Share (%), By Segment 3, 2022 & 2029
Figure 40: Latin America Lithium Battery Composite Current Collector Market Forecast (USD Billion), by Sub-Segment 1, 2018-2029
Figure 41: Latin America Lithium Battery Composite Current Collector Market Forecast (USD Billion), by Sub-Segment 2, 2018-2029
Figure 42: Latin America Lithium Battery Composite Current Collector Market Forecast (USD Billion), by Sub-Segment 3, 2018-2029
Figure 43: Latin America Lithium Battery Composite Current Collector Market Forecast (USD Billion), by Others, 2018-2029
Figure 44: Latin America Lithium Battery Composite Current Collector Market Forecast (USD Billion), by Brazil, 2018-2029
Figure 45: Latin America Lithium Battery Composite Current Collector Market Forecast (USD Billion), by Mexico, 2018-2029
Figure 46: Latin America Lithium Battery Composite Current Collector Market Forecast (USD Billion), by Rest of Latin America, 2018-2029
Figure 47: Europe Lithium Battery Composite Current Collector Market Value Share (%), By Segment 1, 2022 & 2029
Figure 48: Europe Lithium Battery Composite Current Collector Market Forecast (USD Billion), by Sub-Segment 1, 2018-2029
Figure 49: Europe Lithium Battery Composite Current Collector Market Forecast (USD Billion), by Sub-Segment 2, 2018-2029
Figure 50: Europe Lithium Battery Composite Current Collector Market Value Share (%), By Segment 2, 2022 & 2029
Figure 51: Europe Lithium Battery Composite Current Collector Market Forecast (USD Billion), by Sub-Segment 1, 2018-2029
Figure 52: Europe Lithium Battery Composite Current Collector Market Forecast (USD Billion), by Sub-Segment 2, 2018-2029
Figure 53: Europe Lithium Battery Composite Current Collector Market Forecast (USD Billion), by Sub-Segment 3, 2018-2029
Figure 54: Europe Lithium Battery Composite Current Collector Market Forecast (USD Billion), by Others, 2018-2029
Figure 55: Europe Lithium Battery Composite Current Collector Market Value Share (%), By Segment 3, 2022 & 2029
Figure 56: Europe Lithium Battery Composite Current Collector Market Forecast (USD Billion), by Sub-Segment 1, 2018-2029
Figure 57: Europe Lithium Battery Composite Current Collector Market Forecast (USD Billion), by Sub-Segment 2, 2018-2029
Figure 58: Europe Lithium Battery Composite Current Collector Market Forecast (USD Billion), by Sub-Segment 3, 2018-2029
Figure 59: Europe Lithium Battery Composite Current Collector Market Forecast (USD Billion), by Others, 2018-2029
Figure 60: Europe Lithium Battery Composite Current Collector Market Forecast (USD Billion), by U.K., 2018-2029
Figure 61: Europe Lithium Battery Composite Current Collector Market Forecast (USD Billion), by Germany, 2018-2029
Figure 62: Europe Lithium Battery Composite Current Collector Market Forecast (USD Billion), by France, 2018-2029
Figure 63: Europe Lithium Battery Composite Current Collector Market Forecast (USD Billion), by Italy, 2018-2029
Figure 64: Europe Lithium Battery Composite Current Collector Market Forecast (USD Billion), by Spain, 2018-2029
Figure 65: Europe Lithium Battery Composite Current Collector Market Forecast (USD Billion), by Russia, 2018-2029
Figure 66: Europe Lithium Battery Composite Current Collector Market Forecast (USD Billion), by Rest of Europe, 2018-2029
Figure 67: Asia Pacific Lithium Battery Composite Current Collector Market Value Share (%), By Segment 1, 2022 & 2029
Figure 68: Asia Pacific Lithium Battery Composite Current Collector Market Forecast (USD Billion), by Sub-Segment 1, 2018-2029
Figure 69: Asia Pacific Lithium Battery Composite Current Collector Market Forecast (USD Billion), by Sub-Segment 2, 2018-2029
Figure 70: Asia Pacific Lithium Battery Composite Current Collector Market Value Share (%), By Segment 2, 2022 & 2029
Figure 71: Asia Pacific Lithium Battery Composite Current Collector Market Forecast (USD Billion), by Sub-Segment 1, 2018-2029
Figure 72: Asia Pacific Lithium Battery Composite Current Collector Market Forecast (USD Billion), by Sub-Segment 2, 2018-2029
Figure 73: Asia Pacific Lithium Battery Composite Current Collector Market Forecast (USD Billion), by Sub-Segment 3, 2018-2029
Figure 74: Asia Pacific Lithium Battery Composite Current Collector Market Forecast (USD Billion), by Others, 2018-2029
Figure 75: Asia Pacific Lithium Battery Composite Current Collector Market Value Share (%), By Segment 3, 2022 & 2029
Figure 76: Asia Pacific Lithium Battery Composite Current Collector Market Forecast (USD Billion), by Sub-Segment 1, 2018-2029
Figure 77: Asia Pacific Lithium Battery Composite Current Collector Market Forecast (USD Billion), by Sub-Segment 2, 2018-2029
Figure 78: Asia Pacific Lithium Battery Composite Current Collector Market Forecast (USD Billion), by Sub-Segment 3, 2018-2029
Figure 79: Asia Pacific Lithium Battery Composite Current Collector Market Forecast (USD Billion), by Others, 2018-2029
Figure 80: Asia Pacific Lithium Battery Composite Current Collector Market Forecast (USD Billion), by China, 2018-2029
Figure 81: Asia Pacific Lithium Battery Composite Current Collector Market Forecast (USD Billion), by India, 2018-2029
Figure 82: Asia Pacific Lithium Battery Composite Current Collector Market Forecast (USD Billion), by Japan, 2018-2029
Figure 83: Asia Pacific Lithium Battery Composite Current Collector Market Forecast (USD Billion), by Australia, 2018-2029
Figure 84: Asia Pacific Lithium Battery Composite Current Collector Market Forecast (USD Billion), by Southeast Asia, 2018-2029
Figure 85: Asia Pacific Lithium Battery Composite Current Collector Market Forecast (USD Billion), by Rest of Asia Pacific, 2018-2029
Figure 86: Middle East & Africa Lithium Battery Composite Current Collector Market Value Share (%), By Segment 1, 2022 & 2029
Figure 87: Middle East & Africa Lithium Battery Composite Current Collector Market Forecast (USD Billion), by Sub-Segment 1, 2018-2029
Figure 88: Middle East & Africa Lithium Battery Composite Current Collector Market Forecast (USD Billion), by Sub-Segment 2, 2018-2029
Figure 89: Middle East & Africa Lithium Battery Composite Current Collector Market Value Share (%), By Segment 2, 2022 & 2029
Figure 90: Middle East & Africa Lithium Battery Composite Current Collector Market Forecast (USD Billion), by Sub-Segment 1, 2018-2029
Figure 91: Middle East & Africa Lithium Battery Composite Current Collector Market Forecast (USD Billion), by Sub-Segment 2, 2018-2029
Figure 92: Middle East & Africa Lithium Battery Composite Current Collector Market Forecast (USD Billion), by Sub-Segment 3, 2018-2029
Figure 93: Middle East & Africa Lithium Battery Composite Current Collector Market Forecast (USD Billion), by Others, 2018-2029
Figure 94: Middle East & Africa Lithium Battery Composite Current Collector Market Value Share (%), By Segment 3, 2022 & 2029
Figure 95: Middle East & Africa Lithium Battery Composite Current Collector Market Forecast (USD Billion), by Sub-Segment 1, 2018-2029
Figure 96: Middle East & Africa Lithium Battery Composite Current Collector Market Forecast (USD Billion), by Sub-Segment 2, 2018-2029
Figure 97: Middle East & Africa Lithium Battery Composite Current Collector Market Forecast (USD Billion), by Sub-Segment 3, 2018-2029
Figure 98: Middle East & Africa Lithium Battery Composite Current Collector Market Forecast (USD Billion), by Others, 2018-2029
Figure 99: Middle East & Africa Lithium Battery Composite Current Collector Market Forecast (USD Billion), by GCC, 2018-2029
Figure 100: Middle East & Africa Lithium Battery Composite Current Collector Market Forecast (USD Billion), by South Africa, 2018-2029
Figure 101: Middle East & Africa Lithium Battery Composite Current Collector Market Forecast (USD Billion), by Rest of Middle East & Africa, 2018-2029
List of Tables
Table 1: Global Lithium Battery Composite Current Collector Market Revenue (USD Billion) Forecast, by Segment 1, 2018-2029
Table 2: Global Lithium Battery Composite Current Collector Market Revenue (USD Billion) Forecast, by Segment 2, 2018-2029
Table 3: Global Lithium Battery Composite Current Collector Market Revenue (USD Billion) Forecast, by Segment 3, 2018-2029
Table 4: Global Lithium Battery Composite Current Collector Market Revenue (USD Billion) Forecast, by Region, 2018-2029
Table 5: North America Lithium Battery Composite Current Collector Market Revenue (USD Billion) Forecast, by Segment 1, 2018-2029
Table 6: North America Lithium Battery Composite Current Collector Market Revenue (USD Billion) Forecast, by Segment 2, 2018-2029
Table 7: North America Lithium Battery Composite Current Collector Market Revenue (USD Billion) Forecast, by Segment 3, 2018-2029
Table 8: North America Lithium Battery Composite Current Collector Market Revenue (USD Billion) Forecast, by Country, 2018-2029
Table 9: Europe Lithium Battery Composite Current Collector Market Revenue (USD Billion) Forecast, by Segment 1, 2018-2029
Table 10: Europe Lithium Battery Composite Current Collector Market Revenue (USD Billion) Forecast, by Segment 2, 2018-2029
Table 11: Europe Lithium Battery Composite Current Collector Market Revenue (USD Billion) Forecast, by Segment 3, 2018-2029
Table 12: Europe Lithium Battery Composite Current Collector Market Revenue (USD Billion) Forecast, by Country, 2018-2029
Table 13: Latin America Lithium Battery Composite Current Collector Market Revenue (USD Billion) Forecast, by Segment 1, 2018-2029
Table 14: Latin America Lithium Battery Composite Current Collector Market Revenue (USD Billion) Forecast, by Segment 2, 2018-2029
Table 15: Latin America Lithium Battery Composite Current Collector Market Revenue (USD Billion) Forecast, by Segment 3, 2018-2029
Table 16: Latin America Lithium Battery Composite Current Collector Market Revenue (USD Billion) Forecast, by Country, 2018-2029
Table 17: Asia Pacific Lithium Battery Composite Current Collector Market Revenue (USD Billion) Forecast, by Segment 1, 2018-2029
Table 18: Asia Pacific Lithium Battery Composite Current Collector Market Revenue (USD Billion) Forecast, by Segment 2, 2018-2029
Table 19: Asia Pacific Lithium Battery Composite Current Collector Market Revenue (USD Billion) Forecast, by Segment 3, 2018-2029
Table 20: Asia Pacific Lithium Battery Composite Current Collector Market Revenue (USD Billion) Forecast, by Country, 2018-2029
Table 21: Middle East & Africa Lithium Battery Composite Current Collector Market Revenue (USD Billion) Forecast, by Segment 1, 2018-2029
Table 22: Middle East & Africa Lithium Battery Composite Current Collector Market Revenue (USD Billion) Forecast, by Segment 2, 2018-2029
Table 23: Middle East & Africa Lithium Battery Composite Current Collector Market Revenue (USD Billion) Forecast, by Segment 3, 2018-2029
Table 24: Middle East & Africa Lithium Battery Composite Current Collector Market Revenue (USD Billion) Forecast, by Country, 2018-2029
Research Process
Data Library Research are conducted by industry experts who offer insight on
industry structure, market segmentations technology assessment and competitive landscape (CL), and penetration, as well as on emerging trends. Their analysis is based on primary interviews (~ 80%) and secondary research (~ 20%) as well as years of professional expertise in their respective industries. Adding to this, by analysing historical trends and current market positions, our analysts predict where the market will be headed for the next five years. Furthermore, the varying trends of segment & categories geographically presented are also studied and the estimated based on the primary & secondary research.
In this particular report from the supply side Data Library Research has conducted primary surveys (interviews) with the key level executives (VP, CEO’s, Marketing Director, Business Development Manager
and SOFT) of the companies that active & prominent as well as the midsized organization
FIGURE 1: DLR RESEARH PROCESS
![research-methodology1]()
Primary Research
Extensive primary research was conducted to gain a deeper insight of the market and industry performance. The analysis is based on both primary and secondary research as well as years of professional expertise in the respective industries.
In addition to analysing current and historical trends, our analysts predict where the market is headed over the next five years.
It varies by segment for these categories geographically presented in the list of market tables. Speaking about this particular report we have conducted primary surveys (interviews) with the key level executives (VP, CEO’s, Marketing Director, Business Development Manager and many more) of the major players active in the market.
Secondary Research
Secondary research was mainly used to collect and identify information useful for the extensive, technical, market-oriented, and Friend’s study of the Global Extra Neutral Alcohol. It was also used to obtain key information about major players, market classification and segmentation according to the industry trends, geographical markets, and developments related to the market and technology perspectives. For this study, analysts have gathered information from various credible sources, such as annual reports, sec filings, journals, white papers, SOFT presentations, and company web sites.
Market Size Estimation
Both, top-down and bottom-up approaches were used to estimate and validate the size of the Global market and to estimate the size of various other dependent submarkets in the overall Extra Neutral Alcohol. The key players in the market were identified through secondary research and their market contributions in the respective geographies were determined through primary and secondary research.
Forecast Model
![research-methodology2]()