Logistics Outsourcing Market Overview
Logistics outsourcing, often known as third-party logistics, is the practice of outsourcing industrial operations such as cross-docking, inventory management, warehousing, and transportation to a third-party or supply chain management provider. Raw material suppliers, distributors, and other value-added service providers are examples of third-party logistics providers. These services are frequently combined and used to give convenience to end-users. A parent business's decision to outsource logistics is usually based on the size of the company, the complexity of the logistics, and the relative economic benefits of outsourcing.
Material management, supply chain management, distribution management, shipment packaging, and channel management are all examples of logistics outsourcing. Outsourced logistics providers' round-the-clock dispatch and delivery services are in high demand by e-commerce web portals and retailers. The benefits of the logistics outsourcing market include increased supplier capabilities due to the use of information technology, operation specialization, a focus on core skills, and consistent growth.
Globalization, time-proportional economy, virtual organizations, improved consumer awareness, strategic considerations to gain more flexibility, and better IT infrastructural support are all major reasons driving the growth of the logistics outsourcing market.
However, this industry has some downsides, including a lack of monitoring control over logistics and risks linked with vendor reliability.
| Report Metric |
Details |
| Market size available for years |
2023–2030 |
| Base year considered |
2023 |
| Forecast period |
2024–2030 |
| Forecast unit |
Value (USD Million) |
| Segments covered |
Logistics Providers, Mode of Transportation, and Region. |
| Regions covered |
North America (the U.S. and Canada), Europe (UK, Germany, France, Italy, Spain, Russia, Rest of Europe), Asia-Pacific (China, India, Japan, Australia, South East Asia, Rest of Asia Pacific), Latin America and the Middle East and Africa (Brazil, Saudi Arabia, UAE, Rest of LAMEA) |
| Companies covered |
United Parcel Service of America, Inc., XPO Logistics, Inc., A.P. Moller - Marsk A/S, DHL International GmbH, Kuehne + Nagel International AG, FedEx Corporation, Deutsche Bahn AG, Nippon Express Co. Ltd., DSV A/S, SNCF Group. |
Covid-19 Impact on Logistics Outsourcing Market
The outbreak of the covid-19 has a severe and swift impact on the automobile and transportation industry. This is majorly due to the shutdown of assembly plants in the US, interruptions across Europe in large-scale manufacturing, and disruption in the export of Chinese parts. In addition to this, the industry is dealing with reduced demand across the globe due to changes in customer behavior and shifts in a supply-demand chain. A recent study shows a 39% decline in sales of automotive all over the world. Moreover, the nationwide lockdowns have substantially affected the transportation sector. Restrictions on transportation accounted for a 45 to 55% decline in public as well as private transport sectors.
Logistics Outsourcing Market Segment Overview
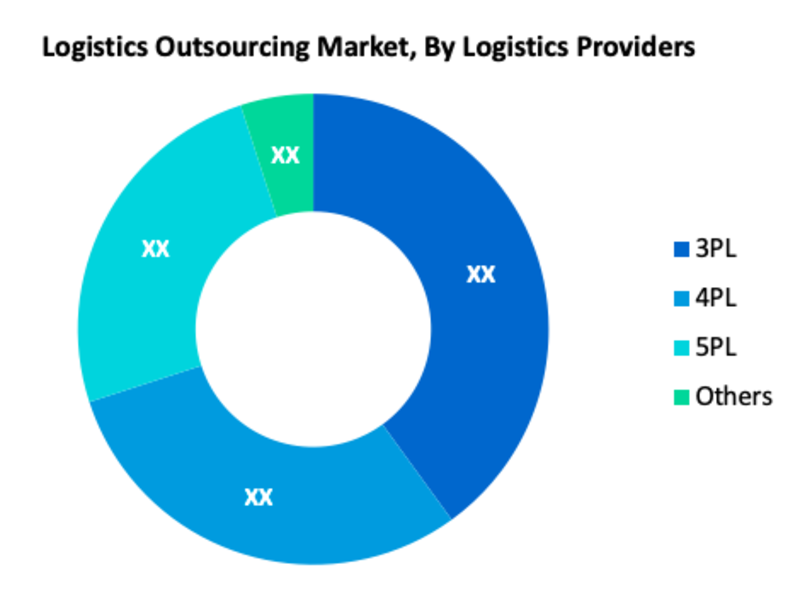
According to Logistics Providers, 3PL is one of the most important segments in the global Logistics Outsourcing market. The transfer of all or part of a company's logistical tasks to a third-party company is known as logistics outsourcing. It's also known as "contract logistics" or "3PL logistics," which refers to the use of outsourcers to handle logistics. At the time, logistics outsourcing only encompassed basic services like freight transportation and storage. A third-party logistics provider (or 3PL) provides a rented or owned class A or B warehouse.
Logistics Outsourcing Market, By Logistics Providers
· 3PL
· 4PL
· 5PL
· Others
Logistics Outsourcing Market, By Mode of Transportation
· Railways
· Roadways
· Waterways
· Airways
Logistics Outsourcing Market Regional Overview
The global Logistics Outsourcing market is divided into North America, Europe, Asia Pacific, Latin America, and the Middle East & Africa. North America commanded a major share of the market and is predictable to maintain its supremacy over the forecast period. Additionally, in order to attract economic customers, the market in the Asia-Pacific region has shown a stable and constant expansion through service improvements by enterprises. Companies must change their attention away from integrated services and toward a diverse product and service portfolio. With a greater emphasis on the growing B2C sector, logistics outsourcing will expand to include value-added and specialized services.
Logistics Outsourcing Market, By Geography
· North America (US & Canada)
· Europe (UK, Germany, France, Italy, Spain, Russia & Rest of Europe)
· Asia-Pacific (Japan, China, India, Australia, & South Korea, & Rest of Asia-Pacific)
· LAMEA (Brazil, Saudi Arabia, UAE & Rest of LAMEA)
Logistics Outsourcing Market, Key Players
· United Parcel Service of America, Inc.
· XPO Logistics, Inc.
· A.P. Moller - Marsk A/S
· DHL International GmbH
· Kuehne + Nagel International AG
· FedEx Corporation
· Deutsche Bahn AG
· Nippon Express Co. Ltd.
· DSV A/S
· SNCF Group
Frequently Asked Questions (FAQ) :
Q1. What are the driving factors for the global Logistics Outsourcing market?
Globalization, time-proportional economy, virtual organizations, improved consumer awareness, etc. are all major reasons driving the growth of the logistics outsourcing market
Q2. What are the restraining factors for the global Logistics Outsourcing market?
The global Logistics Outsourcing market has some downsides, including a lack of monitoring control over logistics and risks linked with vendor reliability.
Q3. Which segment is projected to hold the largest share in the global Logistics Outsourcing market?
3PL segment is projected to hold the largest share in the global Logistics Outsourcing market
Q4. Which region holds the largest share in the global Logistics Outsourcing market?
North America holds the largest share in the global Logistics Outsourcing market
Q5. Which are the prominent players in the global Logistics Outsourcing market?
United Parcel Service of America, Inc., XPO Logistics, Inc., A.P. Moller - Marsk A/S, DHL International GmbH, Kuehne + Nagel International AG, FedEx Corporation, Deutsche Bahn AG, Nippon Express Co. Ltd., DSV A/S, SNCF Group. are some key players in the global Logistics Outsourcing market.
List of Figures
Figure 1: Global Logistics Outsourcing Market Revenue Breakdown (USD Billion, %) by Region, 2019 & 2027
Figure 2: Global Logistics Outsourcing Market Value Share (%), By Segment 1, 2019 & 2027
Figure 3: Global Logistics Outsourcing Market Forecast (USD Billion), by Sub-Segment 1, 2016-2027
Figure 4: Global Logistics Outsourcing Market Forecast (USD Billion), by Sub-Segment 2, 2016-2027
Figure 5: Global Logistics Outsourcing Market Value Share (%), By Segment 2, 2019 & 2027
Figure 6: Global Logistics Outsourcing Market Forecast (USD Billion), by Sub-Segment 1, 2016-2027
Figure 7: Global Logistics Outsourcing Market Forecast (USD Billion), by Sub-Segment 2, 2016-2027
Figure 8: Global Logistics Outsourcing Market Forecast (USD Billion), by Sub-Segment 3, 2016-2027
Figure 9: Global Logistics Outsourcing Market Forecast (USD Billion), by Others, 2016-2027
Figure 10: Global Logistics Outsourcing Market Value Share (%), By Segment 3, 2019 & 2027
Figure 11: Global Logistics Outsourcing Market Forecast (USD Billion), by Sub-Segment 1, 2016-2027
Figure 12: Global Logistics Outsourcing Market Forecast (USD Billion), by Sub-Segment 2, 2016-2027
Figure 13: Global Logistics Outsourcing Market Forecast (USD Billion), by Sub-Segment 3, 2016-2027
Figure 14: Global Logistics Outsourcing Market Forecast (USD Billion), by Others, 2016-2027
Figure 15: Global Logistics Outsourcing Market Value (USD Billion), by Region, 2019 & 2027
Figure 16: North America Logistics Outsourcing Market Value Share (%), By Segment 1, 2019 & 2027
Figure 17: North America Logistics Outsourcing Market Forecast (USD Billion), by Sub-Segment 1, 2016-2027
Figure 18: North America Logistics Outsourcing Market Forecast (USD Billion), by Sub-Segment 2, 2016-2027
Figure 19: North America Logistics Outsourcing Market Value Share (%), By Segment 2, 2019 & 2027
Figure 20: North America Logistics Outsourcing Market Forecast (USD Billion), by Sub-Segment 1, 2016-2027
Figure 21: North America Logistics Outsourcing Market Forecast (USD Billion), by Sub-Segment 2, 2016-2027
Figure 22: North America Logistics Outsourcing Market Forecast (USD Billion), by Sub-Segment 3, 2016-2027
Figure 23: North America Logistics Outsourcing Market Forecast (USD Billion), by Others, 2016-2027
Figure 24: North America Logistics Outsourcing Market Value Share (%), By Segment 3, 2019 & 2027
Figure 25: North America Logistics Outsourcing Market Forecast (USD Billion), by Sub-Segment 1, 2016-2027
Figure 26: North America Logistics Outsourcing Market Forecast (USD Billion), by Sub-Segment 2, 2016-2027
Figure 27: North America Logistics Outsourcing Market Forecast (USD Billion), by Sub-Segment 3, 2016-2027
Figure 28: North America Logistics Outsourcing Market Forecast (USD Billion), by Others, 2016-2027
Figure 29: North America Logistics Outsourcing Market Forecast (USD Billion), by U.S., 2016-2027
Figure 30: North America Logistics Outsourcing Market Forecast (USD Billion), by Canada, 2016-2027
Figure 31: Latin America Logistics Outsourcing Market Value Share (%), By Segment 1, 2019 & 2027
Figure 32: Latin America Logistics Outsourcing Market Forecast (USD Billion), by Sub-Segment 1, 2016-2027
Figure 33: Latin America Logistics Outsourcing Market Forecast (USD Billion), by Sub-Segment 2, 2016-2027
Figure 34: Latin America Logistics Outsourcing Market Value Share (%), By Segment 2, 2019 & 2027
Figure 35: Latin America Logistics Outsourcing Market Forecast (USD Billion), by Sub-Segment 1, 2016-2027
Figure 36: Latin America Logistics Outsourcing Market Forecast (USD Billion), by Sub-Segment 2, 2016-2027
Figure 37: Latin America Logistics Outsourcing Market Forecast (USD Billion), by Sub-Segment 3, 2016-2027
Figure 38: Latin America Logistics Outsourcing Market Forecast (USD Billion), by Others, 2016-2027
Figure 39: Latin America Logistics Outsourcing Market Value Share (%), By Segment 3, 2019 & 2027
Figure 40: Latin America Logistics Outsourcing Market Forecast (USD Billion), by Sub-Segment 1, 2016-2027
Figure 41: Latin America Logistics Outsourcing Market Forecast (USD Billion), by Sub-Segment 2, 2016-2027
Figure 42: Latin America Logistics Outsourcing Market Forecast (USD Billion), by Sub-Segment 3, 2016-2027
Figure 43: Latin America Logistics Outsourcing Market Forecast (USD Billion), by Others, 2016-2027
Figure 44: Latin America Logistics Outsourcing Market Forecast (USD Billion), by Brazil, 2016-2027
Figure 45: Latin America Logistics Outsourcing Market Forecast (USD Billion), by Mexico, 2016-2027
Figure 46: Latin America Logistics Outsourcing Market Forecast (USD Billion), by Rest of Latin America, 2016-2027
Figure 47: Europe Logistics Outsourcing Market Value Share (%), By Segment 1, 2019 & 2027
Figure 48: Europe Logistics Outsourcing Market Forecast (USD Billion), by Sub-Segment 1, 2016-2027
Figure 49: Europe Logistics Outsourcing Market Forecast (USD Billion), by Sub-Segment 2, 2016-2027
Figure 50: Europe Logistics Outsourcing Market Value Share (%), By Segment 2, 2019 & 2027
Figure 51: Europe Logistics Outsourcing Market Forecast (USD Billion), by Sub-Segment 1, 2016-2027
Figure 52: Europe Logistics Outsourcing Market Forecast (USD Billion), by Sub-Segment 2, 2016-2027
Figure 53: Europe Logistics Outsourcing Market Forecast (USD Billion), by Sub-Segment 3, 2016-2027
Figure 54: Europe Logistics Outsourcing Market Forecast (USD Billion), by Others, 2016-2027
Figure 55: Europe Logistics Outsourcing Market Value Share (%), By Segment 3, 2019 & 2027
Figure 56: Europe Logistics Outsourcing Market Forecast (USD Billion), by Sub-Segment 1, 2016-2027
Figure 57: Europe Logistics Outsourcing Market Forecast (USD Billion), by Sub-Segment 2, 2016-2027
Figure 58: Europe Logistics Outsourcing Market Forecast (USD Billion), by Sub-Segment 3, 2016-2027
Figure 59: Europe Logistics Outsourcing Market Forecast (USD Billion), by Others, 2016-2027
Figure 60: Europe Logistics Outsourcing Market Forecast (USD Billion), by U.K., 2016-2027
Figure 61: Europe Logistics Outsourcing Market Forecast (USD Billion), by Germany, 2016-2027
Figure 62: Europe Logistics Outsourcing Market Forecast (USD Billion), by France, 2016-2027
Figure 63: Europe Logistics Outsourcing Market Forecast (USD Billion), by Italy, 2016-2027
Figure 64: Europe Logistics Outsourcing Market Forecast (USD Billion), by Spain, 2016-2027
Figure 65: Europe Logistics Outsourcing Market Forecast (USD Billion), by Russia, 2016-2027
Figure 66: Europe Logistics Outsourcing Market Forecast (USD Billion), by Rest of Europe, 2016-2027
Figure 67: Asia Pacific Logistics Outsourcing Market Value Share (%), By Segment 1, 2019 & 2027
Figure 68: Asia Pacific Logistics Outsourcing Market Forecast (USD Billion), by Sub-Segment 1, 2016-2027
Figure 69: Asia Pacific Logistics Outsourcing Market Forecast (USD Billion), by Sub-Segment 2, 2016-2027
Figure 70: Asia Pacific Logistics Outsourcing Market Value Share (%), By Segment 2, 2019 & 2027
Figure 71: Asia Pacific Logistics Outsourcing Market Forecast (USD Billion), by Sub-Segment 1, 2016-2027
Figure 72: Asia Pacific Logistics Outsourcing Market Forecast (USD Billion), by Sub-Segment 2, 2016-2027
Figure 73: Asia Pacific Logistics Outsourcing Market Forecast (USD Billion), by Sub-Segment 3, 2016-2027
Figure 74: Asia Pacific Logistics Outsourcing Market Forecast (USD Billion), by Others, 2016-2027
Figure 75: Asia Pacific Logistics Outsourcing Market Value Share (%), By Segment 3, 2019 & 2027
Figure 76: Asia Pacific Logistics Outsourcing Market Forecast (USD Billion), by Sub-Segment 1, 2016-2027
Figure 77: Asia Pacific Logistics Outsourcing Market Forecast (USD Billion), by Sub-Segment 2, 2016-2027
Figure 78: Asia Pacific Logistics Outsourcing Market Forecast (USD Billion), by Sub-Segment 3, 2016-2027
Figure 79: Asia Pacific Logistics Outsourcing Market Forecast (USD Billion), by Others, 2016-2027
Figure 80: Asia Pacific Logistics Outsourcing Market Forecast (USD Billion), by China, 2016-2027
Figure 81: Asia Pacific Logistics Outsourcing Market Forecast (USD Billion), by India, 2016-2027
Figure 82: Asia Pacific Logistics Outsourcing Market Forecast (USD Billion), by Japan, 2016-2027
Figure 83: Asia Pacific Logistics Outsourcing Market Forecast (USD Billion), by Australia, 2016-2027
Figure 84: Asia Pacific Logistics Outsourcing Market Forecast (USD Billion), by Southeast Asia, 2016-2027
Figure 85: Asia Pacific Logistics Outsourcing Market Forecast (USD Billion), by Rest of Asia Pacific, 2016-2027
Figure 86: Middle East & Africa Logistics Outsourcing Market Value Share (%), By Segment 1, 2019 & 2027
Figure 87: Middle East & Africa Logistics Outsourcing Market Forecast (USD Billion), by Sub-Segment 1, 2016-2027
Figure 88: Middle East & Africa Logistics Outsourcing Market Forecast (USD Billion), by Sub-Segment 2, 2016-2027
Figure 89: Middle East & Africa Logistics Outsourcing Market Value Share (%), By Segment 2, 2019 & 2027
Figure 90: Middle East & Africa Logistics Outsourcing Market Forecast (USD Billion), by Sub-Segment 1, 2016-2027
Figure 91: Middle East & Africa Logistics Outsourcing Market Forecast (USD Billion), by Sub-Segment 2, 2016-2027
Figure 92: Middle East & Africa Logistics Outsourcing Market Forecast (USD Billion), by Sub-Segment 3, 2016-2027
Figure 93: Middle East & Africa Logistics Outsourcing Market Forecast (USD Billion), by Others, 2016-2027
Figure 94: Middle East & Africa Logistics Outsourcing Market Value Share (%), By Segment 3, 2019 & 2027
Figure 95: Middle East & Africa Logistics Outsourcing Market Forecast (USD Billion), by Sub-Segment 1, 2016-2027
Figure 96: Middle East & Africa Logistics Outsourcing Market Forecast (USD Billion), by Sub-Segment 2, 2016-2027
Figure 97: Middle East & Africa Logistics Outsourcing Market Forecast (USD Billion), by Sub-Segment 3, 2016-2027
Figure 98: Middle East & Africa Logistics Outsourcing Market Forecast (USD Billion), by Others, 2016-2027
Figure 99: Middle East & Africa Logistics Outsourcing Market Forecast (USD Billion), by GCC, 2016-2027
Figure 100: Middle East & Africa Logistics Outsourcing Market Forecast (USD Billion), by South Africa, 2016-2027
Figure 101: Middle East & Africa Logistics Outsourcing Market Forecast (USD Billion), by Rest of Middle East & Africa, 2016-2027
List of Tables
Table 1: Global Logistics Outsourcing Market Revenue (USD Billion) Forecast, by Segment 1, 2016-2027
Table 2: Global Logistics Outsourcing Market Revenue (USD Billion) Forecast, by Segment 2, 2016-2027
Table 3: Global Logistics Outsourcing Market Revenue (USD Billion) Forecast, by Segment 3, 2016-2027
Table 4: Global Logistics Outsourcing Market Revenue (USD Billion) Forecast, by Region, 2016-2027
Table 5: North America Logistics Outsourcing Market Revenue (USD Billion) Forecast, by Segment 1, 2016-2027
Table 6: North America Logistics Outsourcing Market Revenue (USD Billion) Forecast, by Segment 2, 2016-2027
Table 7: North America Logistics Outsourcing Market Revenue (USD Billion) Forecast, by Segment 3, 2016-2027
Table 8: North America Logistics Outsourcing Market Revenue (USD Billion) Forecast, by Country, 2016-2027
Table 9: Europe Logistics Outsourcing Market Revenue (USD Billion) Forecast, by Segment 1, 2016-2027
Table 10: Europe Logistics Outsourcing Market Revenue (USD Billion) Forecast, by Segment 2, 2016-2027
Table 11: Europe Logistics Outsourcing Market Revenue (USD Billion) Forecast, by Segment 3, 2016-2027
Table 12: Europe Logistics Outsourcing Market Revenue (USD Billion) Forecast, by Country, 2016-2027
Table 13: Latin America Logistics Outsourcing Market Revenue (USD Billion) Forecast, by Segment 1, 2016-2027
Table 14: Latin America Logistics Outsourcing Market Revenue (USD Billion) Forecast, by Segment 2, 2016-2027
Table 15: Latin America Logistics Outsourcing Market Revenue (USD Billion) Forecast, by Segment 3, 2016-2027
Table 16: Latin America Logistics Outsourcing Market Revenue (USD Billion) Forecast, by Country, 2016-2027
Table 17: Asia Pacific Logistics Outsourcing Market Revenue (USD Billion) Forecast, by Segment 1, 2016-2027
Table 18: Asia Pacific Logistics Outsourcing Market Revenue (USD Billion) Forecast, by Segment 2, 2016-2027
Table 19: Asia Pacific Logistics Outsourcing Market Revenue (USD Billion) Forecast, by Segment 3, 2016-2027
Table 20: Asia Pacific Logistics Outsourcing Market Revenue (USD Billion) Forecast, by Country, 2016-2027
Table 21: Middle East & Africa Logistics Outsourcing Market Revenue (USD Billion) Forecast, by Segment 1, 2016-2027
Table 22: Middle East & Africa Logistics Outsourcing Market Revenue (USD Billion) Forecast, by Segment 2, 2016-2027
Table 23: Middle East & Africa Logistics Outsourcing Market Revenue (USD Billion) Forecast, by Segment 3, 2016-2027
Table 24: Middle East & Africa Logistics Outsourcing Market Revenue (USD Billion) Forecast, by Country, 2016-2027
Research Process
Data Library Research are conducted by industry experts who offer insight on
industry structure, market segmentations technology assessment and competitive landscape (CL), and penetration, as well as on emerging trends. Their analysis is based on primary interviews (~ 80%) and secondary research (~ 20%) as well as years of professional expertise in their respective industries. Adding to this, by analysing historical trends and current market positions, our analysts predict where the market will be headed for the next five years. Furthermore, the varying trends of segment & categories geographically presented are also studied and the estimated based on the primary & secondary research.
In this particular report from the supply side Data Library Research has conducted primary surveys (interviews) with the key level executives (VP, CEO’s, Marketing Director, Business Development Manager
and SOFT) of the companies that active & prominent as well as the midsized organization
FIGURE 1: DLR RESEARH PROCESS

Primary Research
Extensive primary research was conducted to gain a deeper insight of the market and industry performance. The analysis is based on both primary and secondary research as well as years of professional expertise in the respective industries.
In addition to analysing current and historical trends, our analysts predict where the market is headed over the next five years.
It varies by segment for these categories geographically presented in the list of market tables. Speaking about this particular report we have conducted primary surveys (interviews) with the key level executives (VP, CEO’s, Marketing Director, Business Development Manager and many more) of the major players active in the market.
Secondary Research
Secondary research was mainly used to collect and identify information useful for the extensive, technical, market-oriented, and Friend’s study of the Global Extra Neutral Alcohol. It was also used to obtain key information about major players, market classification and segmentation according to the industry trends, geographical markets, and developments related to the market and technology perspectives. For this study, analysts have gathered information from various credible sources, such as annual reports, sec filings, journals, white papers, SOFT presentations, and company web sites.
Market Size Estimation
Both, top-down and bottom-up approaches were used to estimate and validate the size of the Global market and to estimate the size of various other dependent submarkets in the overall Extra Neutral Alcohol. The key players in the market were identified through secondary research and their market contributions in the respective geographies were determined through primary and secondary research.
Forecast Model
