Marine Applications Inertial Systems Market Overview and Analysis

  • The Marine Grade Inertial Navigation System (INS) market is projected to reach USD 2.5 billion by 2033 from USD 1.2 billion in 2024, at a compound annual growth rate (CAGR) of around 9.1%.

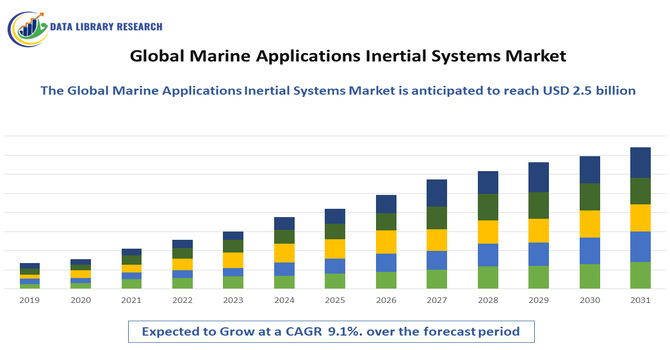
Is projected to grow at a Compound Annual Growth Rate (CAGR) of approximately 10.31% to 10.50% over the forecast period, typically extending from 2025 to 2030 or 2031.

The growth of the Global Marine Applications Inertial Systems Market is primarily driven by the increasing demand for precise and reliable navigation systems in commercial, defense, and offshore marine operations. Advancements in sensor technologies have enhanced the accuracy and performance of inertial systems, making them indispensable for vessels operating in dynamic marine environments. The rise of autonomous and remotely operated vessels has further accelerated adoption, as these systems provide critical real-time positioning and orientation data required for safe and efficient navigation. Additionally, stringent maritime regulations and the need for compliance with international safety standards are encouraging the integration of advanced inertial systems.

Marine Applications Inertial Systems Market Latest Trends

The Global Marine Applications Inertial Systems Market is undergoing major transformations driven by AI and ML integration, which enhance real-time error correction, predictive maintenance, and navigation efficiency. Advances in MEMS technology are enabling miniaturized, cost-effective IMUs, expanding access to high-precision navigation for smaller and unmanned marine vessels. Additionally, the growing adoption of hybrid INS-GNSS systems is improving accuracy in signal-challenged environments. These trends are fueling innovation and broadening applications across defense, offshore energy, and autonomous maritime operations, supporting sustained market growth.

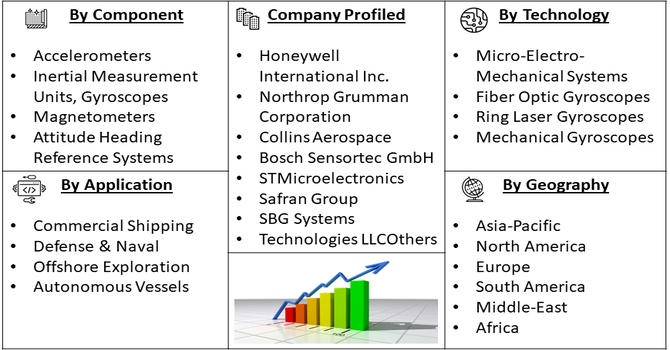
Segmentation: Global Marine Applications Inertial Systems Market is segmented By Component (Accelerometers, Inertial Measurement Units, Gyroscopes, Magnetometers, and Attitude Heading Reference Systems), Application (Commercial Shipping, Defense & Naval, Offshore Exploration, and Autonomous Vessels), Technology (Micro-Electro-Mechanical Systems, Fiber Optic Gyroscopes, Ring Laser Gyroscopes, and Mechanical Gyroscopes), and Geography (North America, Europe, Asia-Pacific, Middle East and Africa, and South America). The report provides the value (in USD million) for the above segments.

Market Drivers:

  • Rising Demand for Precise Navigation and Safety in Marine Operations

The increasing need for accurate navigation, positioning, and vessel control in commercial shipping, offshore exploration, and defense operations is a key driver for the market. Inertial systems provide real-time data on a vessel’s position, orientation, and velocity, ensuring safe and efficient navigation even in environments where GPS signals may be weak or unavailable. This reliability is critical for reducing operational risks, preventing collisions, and enhancing overall maritime safety.

In April 2023, Orolia, a Safran company, partnered with Xona Space Systems to integrate Xona’s low Earth orbit (LEO) satellite constellation and navigation signals into its Skydel-based simulation and testing platforms. Xona is developing PULSAR, a high-performance PNT (Positioning, Navigation, and Timing) service using a commercial LEO satellite network.

This collaboration supports the rising demand for precise navigation and enhanced safety in marine operations. By enabling more accurate and resilient PNT capabilities—especially in environments where traditional GNSS signals may be disrupted—this advancement strengthens the reliability of inertial systems in global marine applications, particularly for autonomous and GPS-challenged scenarios.

  • Growth of Autonomous and Unmanned Vessels

The surge in the development and deployment of autonomous ships, remotely operated vehicles (ROVs), and unmanned underwater vehicles (UUVs) is driving the demand for advanced inertial systems. For instance, in May 2023, Kongsberg Maritime (a subsidiary of Kongsberg Gruppen ASA) successfully demonstrated remote and autonomous navigation technologies on a cargo vessel off the coast of Norway. The test was recognized as one of the most advanced autonomous navigation demonstrations ever conducted at sea. This high-profile demonstration underscores the growing viability and sophistication of autonomous maritime technologies. As remote and autonomous vessels require precise, real-time navigation without human intervention, advanced inertial navigation systems (INS) are critical to their operation—especially in environments where satellite signals may be unreliable. Such initiatives accelerate the adoption of INS across commercial and defense maritime sectors, driving growth and innovation in the global marine applications market.

Market Restraints:

  • Sensor Drift and Calibration Issues

Inertial navigation systems, particularly those relying on Micro-Electro-Mechanical Systems (MEMS), are susceptible to sensor drift over time. This drift can lead to cumulative errors in position and orientation estimates, affecting the accuracy of navigation. Regular calibration is required to mitigate this issue, but it can be complex and resource-intensive, especially in dynamic marine environments.

Moreover, in high-precision marine applications, even minor sensor drift in MEMS-based inertial navigation systems can result in significant navigational errors over long durations or distances. This challenge is further compounded when operating in GPS-denied or signal-degraded environments, where reliance on inertial data becomes critical. To maintain accuracy, advanced error-correction algorithms and sensor fusion techniques—such as combining INS with GNSS or Doppler velocity logs—are increasingly being adopted. However, these solutions often raise system complexity and cost, making them less accessible for smaller or unmanned marine vessels.

Socio Economic Impact on Marine Applications Inertial Systems Market

The Marine Applications Inertial Systems Market provides a crucial foundation for global security, resource exploration, and trade. Economically, these highly accurate navigation systems are indispensable for the efficient operation of commercial shipping, offshore oil and gas exploration, and deep-sea research, enabling multi-billion dollar industries to operate reliably even in GPS-denied environments. Socially, the technology enhances maritime safety and security by ensuring precise navigation for naval fleets and autonomous underwater vehicles. This precision is vital for national defense, preventing accidents, mapping the ocean floor, and protecting critical sea lanes that facilitate the majority of global trade, thereby ensuring economic stability.

Segmental Analysis:

  • Inertial Measurement Units (IMUs) segment is expected to witness highest growth over the forecast period

Inertial Measurement Units (IMUs) are the most critical component in marine inertial systems, as they integrate accelerometers and gyroscopes to provide comprehensive data on a vessel’s motion, velocity, and orientation. IMUs are essential for accurate navigation and positioning, especially in environments where GPS signals are unreliable, such as deep-sea or under-ice operations. Their ability to continuously monitor movement makes them indispensable for both commercial and defense applications.

In June 2025, Honeywell expanded its navigation solutions portfolio with the launch of the HG3900 Inertial Measurement Unit (IMU), a compact, lightweight, and low-power tactical-grade device offering accuracy comparable to larger near-navigation-grade IMUs. The HG3900's compact and efficient design makes it ideal for integration into smaller or power-constrained marine platforms, including unmanned and autonomous vessels. Its high performance and reduced footprint support the growing demand for lightweight, reliable inertial systems in marine navigation, especially in GPS-denied environments. This innovation enhances the scalability and accessibility of advanced INS technologies across a wider range of maritime applications.

  • Autonomous Vessels segment is expected to witness highest growth over the forecast period

The autonomous vessels segment is expected to witness the highest growth among applications. Autonomous and unmanned vessels rely heavily on inertial systems for precise navigation and operation without human intervention. These systems enable real-time orientation, positioning, and route correction, ensuring safety and efficiency in challenging maritime conditions, including offshore exploration and military missions. @@@@ In February 2024, Türkiye’s Tersan Shipyard was awarded a contract by Norwegian ferry operator Fjord1 AS to construct four battery-powered, autonomous double-ended ferries. This contract highlighted the accelerating shift toward autonomous and unmanned vessels in the maritime industry. As these ferries operate without traditional human navigation, they rely heavily on advanced inertial navigation systems (INS) for precise, real-time positioning and control—especially in GPS-denied environments. The growing adoption of autonomous vessels is expected to significantly boost demand for high-accuracy INS solutions in global marine applications.

  • Micro-Electro-Mechanical Systems (MEMS) segment is expected to witness highest growth over the forecast period

MEMS technology is increasingly preferred in marine inertial systems due to its compact design, affordability, and sufficient accuracy for a wide range of applications. MEMS-based inertial systems are ideal for both small vessels and large ships, as well as unmanned surface and underwater vehicles, providing high performance without the high costs associated with fiber optic or ring laser gyroscopes. In October 2025, Infleqtion, announced a strategic partnership with Silicon Light Machines, a Silicon Valley-based MEMS innovator. This collaboration highlights the growing role of MEMS in cutting-edge quantum technologies. Integrating MEMS-based phase modulators into quantum systems demonstrates how advanced MEMS can enable ultra-precise control, miniaturization, and scalability. Such innovations are expected to drive demand for high-performance MEMS components across quantum computing and other next-generation computing and sensing applications, fueling growth in the global MEMS segment, thereby contributing the market’s growth.

  • North America region is expected to witness highest growth over the forecast period

The North America region is expected to witness the highest growth in the Global Marine Applications Inertial Systems Market over the forecast period. This growth is driven by the region’s advanced naval and commercial maritime infrastructure, early adoption of cutting-edge navigation technologies, and substantial investments in research and development.

The presence of sophisticated defense operations, autonomous vessel initiatives, and large-scale offshore exploration projects further fuels demand for high-precision inertial systems. For instance, in August 2025, Blue Water Autonomy, a Boston-based tech and shipbuilding firm focused on developing highly producible unmanned vessels for the U.S. Navy, announced in 2025 that it had raised USD 50 million in Series A funding, led by GV. Existing investors—Eclipse, Riot, and Impatient Ventures—also participated. This followed a USD 14 million seed round in April 2025, bringing the company's total funding to USD 64 million. As part of the announcement, GV Managing Partner Dave Munichiello joined the company’s Board of Directors. Blue Water Autonomy’s funding boost underscored growing investment in autonomous naval technologies in North America. The development of unmanned naval vessels demands precise, resilient navigation systems, particularly in GPS-denied environments. This trend is expected to drive significant demand for advanced inertial navigation systems (INS), solidifying North America's position as a key growth hub in the global marine INS market. Additionally, stringent regulatory standards for maritime safety and the need for reliable navigation in challenging environments support the adoption of advanced inertial systems, making North America a leading market globally.

Marine Applications Inertial Systems Market Competitive Landscape

The global marine applications inertial systems market is characterized by the presence of several key players who are actively involved in the development and supply of advanced inertial navigation systems. These companies offer a range of products, including accelerometers, gyroscopes, inertial measurement units (IMUs), and attitude heading reference systems (AHRS), catering to various marine applications such as commercial shipping, defense, offshore exploration, and autonomous vessels.

Key Companies:

  • Honeywell International Inc.
  • Northrop Grumman Corporation
  • Collins Aerospace
  • Bosch Sensortec GmbH
  • STMicroelectronics
  • Safran Group
  • SBG Systems
  • Raytheon Anschütz GmbH
  • KVH Industries Inc.
  • Silicon Sensing Systems Ltd.
  • VectorNav Technologies LLC
  • Teledyne Technologies Inc.
  • Trimble Inc.
  • L3Harris Technologies Inc.
  • MEMSIC Inc.
  • iMAR Navigation GmbH
  • Oxford Technical Solutions Ltd.
  • Inertial Labs Inc.
  • Point One Navigation
  • Tersus GNSS Inc.

Recent Development

  • In January 2025, ANELLO Photonics, launched ANELLO Maritime INS, its advanced Inertial Navigation System for maritime applications. This product represented a major advancement in navigation technology, designed to enhance performance in GPS-denied or spoofed marine environments.


  • In June 2024, Inertial Labs, a provider of navigation and positioning solutions, launched INS-FI. This GPS-aided Inertial Navigation System reflected over two decades of expertise in delivering INS solutions for land, marine, and aerial platforms globally. Built with tactical-grade Fiber Optic Gyroscope (FOG) technology, the INS-FI stood out as one of the most advanced and reliable systems available. Its IP67 rating indicated high ruggedness and strong protection against EMC/EMI, ensuring dependable performance in even the most challenging environments.


Frequently Asked Questions (FAQ) :

Q1. What the main growth driving factors for this market?

The Global Marine Applications Inertial Systems Market is primarily propelled by the increasing demand for high-precision navigation and positioning systems, particularly within the defense and commercial marine industries. The rising adoption of autonomous and unmanned marine vehicles (AUVs/USVs) for applications like oceanography and offshore exploration is a key driver. Furthermore, advancements in sensor technology, such as Fiber Optic Gyros (FOG) and miniaturized MEMS, offer improved performance and are fueling market expansion, driven by the need for reliable navigation in GPS-denied or challenging marine environments.

Q2. What are the main restraining factors for this market?

Major restraints for the Global Marine Applications Inertial Systems Market include the high initial investment costs associated with high-precision systems like Marine Grade Inertial Navigation Systems (INS). The inherent technical challenge of integration drift error over extended periods of operation also poses a barrier. Moreover, the technical complexity involved in integrating these advanced systems with existing ship navigation setups and the requirement for specialized, skilled personnel to operate and maintain them can limit broader market adoption, especially among smaller operators.

Q3. Which segment is expected to witness high growth?

The Unmanned Marine Vehicles segment, encompassing both Autonomous Underwater Vehicles (AUVs) and Unmanned Surface Vehicles (USVs), is expected to witness the highest growth in the marine applications inertial systems market. This surge is attributed to the growing use of these vehicles in diverse applications such as offshore oil and gas exploration, oceanographic research, and naval defense. The critical requirement for robust, highly accurate, and reliable navigation and stabilization in these autonomous platforms is the primary catalyst for this segment's rapid expansion.

Q4. Who are the top major players for this market?

Key industry players dominating the Global Marine Applications Inertial Systems Market include prominent defense and technology companies such as Northrop Grumman Corporation, Honeywell International Inc., Safran Electronics & Defense, and Thales Group. Other major competitors offering specialized solutions are Teledyne Technologies, Trimble Inc., and Exail Technologies. These global players leverage their expertise in high-precision navigation and sensor technology to provide a range of products, including high-grade Inertial Measurement Units (IMUs) and Inertial Navigation Systems (INS) for various naval and commercial marine platforms.

Q5. Which country is the largest player?

Geographically, North America holds the largest revenue share in the overall inertial systems and related marine electronics markets, largely driven by the United States. The country's substantial defense spending, extensive naval operations (including a large fleet of ships and submarines), and the presence of major technology and aerospace & defense companies contribute to its dominance.

Marine Applications Inertial Systems MARKET STUDY GLOBAL MARKET ANALYSIS, INSIGHTS AND FORECAST, 2022-2029

    1. Introduction

    • 1.1. Research Scope
    • 1.2. Market Segmentation
    • 1.3. Research Methodology
    • 1.4. Definitions and Assumptions

    2. Executive Summary

      3. Market Dynamics

      • 3.1. Market Drivers
      • 3.2. Market Restraints
      • 3.3. Market Opportunities

      4. Key Insights

      • 4.1. Key Emerging Trends – For Major Countries
      • 4.2. Latest Technological Advancement
      • 4.3. Regulatory Landscape
      • 4.4. Industry SWOT Analysis
      • 4.5. Porters Five Forces Analysis

      5. Global Marine Applications Inertial Systems Market Analysis (USD Billion), Insights and Forecast, 2018-2029

      • 5.1. Key Findings / Summary
      • 5.2. Market Analysis, Insights and Forecast – By Segment 1
        • 5.2.1. Sub-Segment 1
        • 5.2.2. Sub-Segment 2
      • 5.3. Market Analysis, Insights and Forecast – By Segment 2
        • 5.3.1. Sub-Segment 1
        • 5.3.2. Sub-Segment 2
        • 5.3.3. Sub-Segment 3
        • 5.3.4. Others
      • 5.4. Market Analysis, Insights and Forecast – By Segment 3
        • 5.4.1. Sub-Segment 1
        • 5.4.2. Sub-Segment 2
        • 5.4.3. Sub-Segment 3
        • 5.4.4. Others
      • 5.5. Market Analysis, Insights and Forecast – By Region
        • 5.5.1. North America
        • 5.5.2. Latin America
        • 5.5.3. Europe
        • 5.5.4. Asia Pacific
        • 5.5.5. Middle East and Africa

      6. North America Marine Applications Inertial Systems Market Analysis (USD Billion), Insights and Forecast, 2018-2029

      • 6.1. Key Findings / Summary
      • 6.2. Market Analysis, Insights and Forecast – By Segment 1
        • 6.2.1. Sub-Segment 1
        • 6.2.2. Sub-Segment 2
      • 6.3. Market Analysis, Insights and Forecast – By Segment 2
        • 6.3.1. Sub-Segment 1
        • 6.3.2. Sub-Segment 2
        • 6.3.3. Sub-Segment 3
        • 6.3.4. Others
      • 6.4. Market Analysis, Insights and Forecast – By Segment 3
        • 6.4.1. Sub-Segment 1
        • 6.4.2. Sub-Segment 2
        • 6.4.3. Sub-Segment 3
        • 6.4.4. Others
      • 6.5. Market Analysis, Insights and Forecast – By Country
        • 6.5.1. U.S.
        • 6.5.2. Canada

      7. Latin America Marine Applications Inertial Systems Market Analysis (USD Billion), Insights and Forecast, 2018-2029

      • 7.1. Key Findings / Summary
      • 7.2. Market Analysis, Insights and Forecast – By Segment 1
        • 7.2.1. Sub-Segment 1
        • 7.2.2. Sub-Segment 2
      • 7.3. Market Analysis, Insights and Forecast – By Segment 2
        • 7.3.1. Sub-Segment 1
        • 7.3.2. Sub-Segment 2
        • 7.3.3. Sub-Segment 3
        • 7.3.4. Others
      • 7.4. Market Analysis, Insights and Forecast – By Segment 3
        • 7.4.1. Sub-Segment 1
        • 7.4.2. Sub-Segment 2
        • 7.4.3. Sub-Segment 3
        • 7.4.4. Others
      • 7.5. Insights and Forecast – By Country
        • 7.5.1. Brazil
        • 7.5.2. Mexico
        • 7.5.3. Rest of Latin America

      8. Europe Marine Applications Inertial Systems Market Analysis (USD Billion), Insights and Forecast, 2018-2029

      • 8.1. Key Findings / Summary
      • 8.2. Market Analysis, Insights and Forecast – By Segment 1
        • 8.2.1. Sub-Segment 1
        • 8.2.2. Sub-Segment 2
      • 8.3. Market Analysis, Insights and Forecast – By Segment 2
        • 8.3.1. Sub-Segment 1
        • 8.3.2. Sub-Segment 2
        • 8.3.3. Sub-Segment 3
        • 8.3.4. Others
      • 8.4. Market Analysis, Insights and Forecast – By Segment 3
        • 8.4.1. Sub-Segment 1
        • 8.4.2. Sub-Segment 2
        • 8.4.3. Sub-Segment 3
        • 8.4.4. Others
      • 8.5. Market Analysis, Insights and Forecast – By Country
        • 8.5.1. UK
        • 8.5.2. Germany
        • 8.5.3. France
        • 8.5.4. Italy
        • 8.5.5. Spain
        • 8.5.6. Russia
        • 8.5.7. Rest of Europe

      9. Asia Pacific Marine Applications Inertial Systems Market Analysis (USD Billion), Insights and Forecast, 2018-2029

      • 9.1. Key Findings / Summary
      • 9.2. Market Analysis, Insights and Forecast – By Segment 1
        • 9.2.1. Sub-Segment 1
        • 9.2.2. Sub-Segment 2
      • 9.3. Market Analysis, Insights and Forecast – By Segment 2
        • 9.3.1. Sub-Segment 1
        • 9.3.2. Sub-Segment 2
        • 9.3.3. Sub-Segment 3
        • 9.3.4. Others
      • 9.4. Market Analysis, Insights and Forecast – By Segment 3
        • 9.4.1. Sub-Segment 1
        • 9.4.2. Sub-Segment 2
        • 9.4.3. Sub-Segment 3
        • 9.4.4. Others
      • 9.5. Market Analysis, Insights and Forecast – By Country
        • 9.5.1. China
        • 9.5.2. India
        • 9.5.3. Japan
        • 9.5.4. Australia
        • 9.5.5. South East Asia
        • 9.5.6. Rest of Asia Pacific

      10. Middle East & Africa Marine Applications Inertial Systems Market Analysis (USD Billion), Insights and Forecast, 2018-2029

      • 10.1. Key Findings / Summary
      • 10.2. Market Analysis, Insights and Forecast – By Segment 1
        • 10.2.1. Sub-Segment 1
        • 10.2.2. Sub-Segment 2
      • 10.3. Market Analysis, Insights and Forecast – By Segment 2
        • 10.3.1. Sub-Segment 1
        • 10.3.2. Sub-Segment 2
        • 10.3.3. Sub-Segment 3
        • 10.3.4. Others
      • 10.4. Market Analysis, Insights and Forecast – By Segment 3
        • 10.4.1. Sub-Segment 1
        • 10.4.2. Sub-Segment 2
        • 10.4.3. Sub-Segment 3
        • 10.4.4. Others
      • 10.5. Market Analysis, Insights and Forecast – By Country
        • 10.5.1. GCC
        • 10.5.2. South Africa
        • 10.5.3. Rest of Middle East & Africa

      11. Competitive Analysis

      • 11.1. Company Market Share Analysis, 2018
      • 11.2. Key Industry Developments
      • 11.3. Company Profile
        • 11.3.1. Company 1
          • 11.3.1.1. Business Overview
          • 11.3.1.2. Segment 1 & Service Offering
          • 11.3.1.3. Overall Revenue
          • 11.3.1.4. Geographic Presence
          • 11.3.1.5. Recent Development
        *Similar details will be provided for the following companies
        • 11.3.2. Company 2
        • 11.3.3. Company 3
        • 11.3.4. Company 4
        • 11.3.5. Company 5
        • 11.3.6. Company 6
        • 11.3.7. Company 7
        • 11.3.8. Company 8
        • 11.3.9. Company 9
        • 11.3.10. Company 10
        • 11.3.11. Company 11
        • 11.3.12. Company 12
      List of Figures

      Figure 1: Global Marine Applications Inertial Systems Market Revenue Breakdown (USD Billion, %) by Region, 2022 & 2029
      Figure 2: Global Marine Applications Inertial Systems Market Value Share (%), By Segment 1, 2022 & 2029
      Figure 3: Global Marine Applications Inertial Systems Market Forecast (USD Billion), by Sub-Segment 1, 2018-2029
      Figure 4: Global Marine Applications Inertial Systems Market Forecast (USD Billion), by Sub-Segment 2, 2018-2029
      Figure 5: Global Marine Applications Inertial Systems Market Value Share (%), By Segment 2, 2022 & 2029
      Figure 6: Global Marine Applications Inertial Systems Market Forecast (USD Billion), by Sub-Segment 1, 2018-2029
      Figure 7: Global Marine Applications Inertial Systems Market Forecast (USD Billion), by Sub-Segment 2, 2018-2029
      Figure 8: Global Marine Applications Inertial Systems Market Forecast (USD Billion), by Sub-Segment 3, 2018-2029
      Figure 9: Global Marine Applications Inertial Systems Market Forecast (USD Billion), by Others, 2018-2029
      Figure 10: Global Marine Applications Inertial Systems Market Value Share (%), By Segment 3, 2022 & 2029
      Figure 11: Global Marine Applications Inertial Systems Market Forecast (USD Billion), by Sub-Segment 1, 2018-2029
      Figure 12: Global Marine Applications Inertial Systems Market Forecast (USD Billion), by Sub-Segment 2, 2018-2029
      Figure 13: Global Marine Applications Inertial Systems Market Forecast (USD Billion), by Sub-Segment 3, 2018-2029
      Figure 14: Global Marine Applications Inertial Systems Market Forecast (USD Billion), by Others, 2018-2029
      Figure 15: Global Marine Applications Inertial Systems Market Value (USD Billion), by Region, 2022 & 2029
      Figure 16: North America Marine Applications Inertial Systems Market Value Share (%), By Segment 1, 2022 & 2029
      Figure 17: North America Marine Applications Inertial Systems Market Forecast (USD Billion), by Sub-Segment 1, 2018-2029
      Figure 18: North America Marine Applications Inertial Systems Market Forecast (USD Billion), by Sub-Segment 2, 2018-2029
      Figure 19: North America Marine Applications Inertial Systems Market Value Share (%), By Segment 2, 2022 & 2029
      Figure 20: North America Marine Applications Inertial Systems Market Forecast (USD Billion), by Sub-Segment 1, 2018-2029
      Figure 21: North America Marine Applications Inertial Systems Market Forecast (USD Billion), by Sub-Segment 2, 2018-2029
      Figure 22: North America Marine Applications Inertial Systems Market Forecast (USD Billion), by Sub-Segment 3, 2018-2029
      Figure 23: North America Marine Applications Inertial Systems Market Forecast (USD Billion), by Others, 2018-2029
      Figure 24: North America Marine Applications Inertial Systems Market Value Share (%), By Segment 3, 2022 & 2029
      Figure 25: North America Marine Applications Inertial Systems Market Forecast (USD Billion), by Sub-Segment 1, 2018-2029
      Figure 26: North America Marine Applications Inertial Systems Market Forecast (USD Billion), by Sub-Segment 2, 2018-2029
      Figure 27: North America Marine Applications Inertial Systems Market Forecast (USD Billion), by Sub-Segment 3, 2018-2029
      Figure 28: North America Marine Applications Inertial Systems Market Forecast (USD Billion), by Others, 2018-2029
      Figure 29: North America Marine Applications Inertial Systems Market Forecast (USD Billion), by U.S., 2018-2029
      Figure 30: North America Marine Applications Inertial Systems Market Forecast (USD Billion), by Canada, 2018-2029
      Figure 31: Latin America Marine Applications Inertial Systems Market Value Share (%), By Segment 1, 2022 & 2029
      Figure 32: Latin America Marine Applications Inertial Systems Market Forecast (USD Billion), by Sub-Segment 1, 2018-2029
      Figure 33: Latin America Marine Applications Inertial Systems Market Forecast (USD Billion), by Sub-Segment 2, 2018-2029
      Figure 34: Latin America Marine Applications Inertial Systems Market Value Share (%), By Segment 2, 2022 & 2029
      Figure 35: Latin America Marine Applications Inertial Systems Market Forecast (USD Billion), by Sub-Segment 1, 2018-2029
      Figure 36: Latin America Marine Applications Inertial Systems Market Forecast (USD Billion), by Sub-Segment 2, 2018-2029
      Figure 37: Latin America Marine Applications Inertial Systems Market Forecast (USD Billion), by Sub-Segment 3, 2018-2029
      Figure 38: Latin America Marine Applications Inertial Systems Market Forecast (USD Billion), by Others, 2018-2029
      Figure 39: Latin America Marine Applications Inertial Systems Market Value Share (%), By Segment 3, 2022 & 2029
      Figure 40: Latin America Marine Applications Inertial Systems Market Forecast (USD Billion), by Sub-Segment 1, 2018-2029
      Figure 41: Latin America Marine Applications Inertial Systems Market Forecast (USD Billion), by Sub-Segment 2, 2018-2029
      Figure 42: Latin America Marine Applications Inertial Systems Market Forecast (USD Billion), by Sub-Segment 3, 2018-2029
      Figure 43: Latin America Marine Applications Inertial Systems Market Forecast (USD Billion), by Others, 2018-2029
      Figure 44: Latin America Marine Applications Inertial Systems Market Forecast (USD Billion), by Brazil, 2018-2029
      Figure 45: Latin America Marine Applications Inertial Systems Market Forecast (USD Billion), by Mexico, 2018-2029
      Figure 46: Latin America Marine Applications Inertial Systems Market Forecast (USD Billion), by Rest of Latin America, 2018-2029
      Figure 47: Europe Marine Applications Inertial Systems Market Value Share (%), By Segment 1, 2022 & 2029
      Figure 48: Europe Marine Applications Inertial Systems Market Forecast (USD Billion), by Sub-Segment 1, 2018-2029
      Figure 49: Europe Marine Applications Inertial Systems Market Forecast (USD Billion), by Sub-Segment 2, 2018-2029
      Figure 50: Europe Marine Applications Inertial Systems Market Value Share (%), By Segment 2, 2022 & 2029
      Figure 51: Europe Marine Applications Inertial Systems Market Forecast (USD Billion), by Sub-Segment 1, 2018-2029
      Figure 52: Europe Marine Applications Inertial Systems Market Forecast (USD Billion), by Sub-Segment 2, 2018-2029
      Figure 53: Europe Marine Applications Inertial Systems Market Forecast (USD Billion), by Sub-Segment 3, 2018-2029
      Figure 54: Europe Marine Applications Inertial Systems Market Forecast (USD Billion), by Others, 2018-2029
      Figure 55: Europe Marine Applications Inertial Systems Market Value Share (%), By Segment 3, 2022 & 2029
      Figure 56: Europe Marine Applications Inertial Systems Market Forecast (USD Billion), by Sub-Segment 1, 2018-2029
      Figure 57: Europe Marine Applications Inertial Systems Market Forecast (USD Billion), by Sub-Segment 2, 2018-2029
      Figure 58: Europe Marine Applications Inertial Systems Market Forecast (USD Billion), by Sub-Segment 3, 2018-2029
      Figure 59: Europe Marine Applications Inertial Systems Market Forecast (USD Billion), by Others, 2018-2029
      Figure 60: Europe Marine Applications Inertial Systems Market Forecast (USD Billion), by U.K., 2018-2029
      Figure 61: Europe Marine Applications Inertial Systems Market Forecast (USD Billion), by Germany, 2018-2029
      Figure 62: Europe Marine Applications Inertial Systems Market Forecast (USD Billion), by France, 2018-2029
      Figure 63: Europe Marine Applications Inertial Systems Market Forecast (USD Billion), by Italy, 2018-2029
      Figure 64: Europe Marine Applications Inertial Systems Market Forecast (USD Billion), by Spain, 2018-2029
      Figure 65: Europe Marine Applications Inertial Systems Market Forecast (USD Billion), by Russia, 2018-2029
      Figure 66: Europe Marine Applications Inertial Systems Market Forecast (USD Billion), by Rest of Europe, 2018-2029
      Figure 67: Asia Pacific Marine Applications Inertial Systems Market Value Share (%), By Segment 1, 2022 & 2029
      Figure 68: Asia Pacific Marine Applications Inertial Systems Market Forecast (USD Billion), by Sub-Segment 1, 2018-2029
      Figure 69: Asia Pacific Marine Applications Inertial Systems Market Forecast (USD Billion), by Sub-Segment 2, 2018-2029
      Figure 70: Asia Pacific Marine Applications Inertial Systems Market Value Share (%), By Segment 2, 2022 & 2029
      Figure 71: Asia Pacific Marine Applications Inertial Systems Market Forecast (USD Billion), by Sub-Segment 1, 2018-2029
      Figure 72: Asia Pacific Marine Applications Inertial Systems Market Forecast (USD Billion), by Sub-Segment 2, 2018-2029
      Figure 73: Asia Pacific Marine Applications Inertial Systems Market Forecast (USD Billion), by Sub-Segment 3, 2018-2029
      Figure 74: Asia Pacific Marine Applications Inertial Systems Market Forecast (USD Billion), by Others, 2018-2029
      Figure 75: Asia Pacific Marine Applications Inertial Systems Market Value Share (%), By Segment 3, 2022 & 2029
      Figure 76: Asia Pacific Marine Applications Inertial Systems Market Forecast (USD Billion), by Sub-Segment 1, 2018-2029
      Figure 77: Asia Pacific Marine Applications Inertial Systems Market Forecast (USD Billion), by Sub-Segment 2, 2018-2029
      Figure 78: Asia Pacific Marine Applications Inertial Systems Market Forecast (USD Billion), by Sub-Segment 3, 2018-2029
      Figure 79: Asia Pacific Marine Applications Inertial Systems Market Forecast (USD Billion), by Others, 2018-2029
      Figure 80: Asia Pacific Marine Applications Inertial Systems Market Forecast (USD Billion), by China, 2018-2029
      Figure 81: Asia Pacific Marine Applications Inertial Systems Market Forecast (USD Billion), by India, 2018-2029
      Figure 82: Asia Pacific Marine Applications Inertial Systems Market Forecast (USD Billion), by Japan, 2018-2029
      Figure 83: Asia Pacific Marine Applications Inertial Systems Market Forecast (USD Billion), by Australia, 2018-2029
      Figure 84: Asia Pacific Marine Applications Inertial Systems Market Forecast (USD Billion), by Southeast Asia, 2018-2029
      Figure 85: Asia Pacific Marine Applications Inertial Systems Market Forecast (USD Billion), by Rest of Asia Pacific, 2018-2029
      Figure 86: Middle East & Africa Marine Applications Inertial Systems Market Value Share (%), By Segment 1, 2022 & 2029
      Figure 87: Middle East & Africa Marine Applications Inertial Systems Market Forecast (USD Billion), by Sub-Segment 1, 2018-2029
      Figure 88: Middle East & Africa Marine Applications Inertial Systems Market Forecast (USD Billion), by Sub-Segment 2, 2018-2029
      Figure 89: Middle East & Africa Marine Applications Inertial Systems Market Value Share (%), By Segment 2, 2022 & 2029
      Figure 90: Middle East & Africa Marine Applications Inertial Systems Market Forecast (USD Billion), by Sub-Segment 1, 2018-2029
      Figure 91: Middle East & Africa Marine Applications Inertial Systems Market Forecast (USD Billion), by Sub-Segment 2, 2018-2029
      Figure 92: Middle East & Africa Marine Applications Inertial Systems Market Forecast (USD Billion), by Sub-Segment 3, 2018-2029
      Figure 93: Middle East & Africa Marine Applications Inertial Systems Market Forecast (USD Billion), by Others, 2018-2029
      Figure 94: Middle East & Africa Marine Applications Inertial Systems Market Value Share (%), By Segment 3, 2022 & 2029
      Figure 95: Middle East & Africa Marine Applications Inertial Systems Market Forecast (USD Billion), by Sub-Segment 1, 2018-2029
      Figure 96: Middle East & Africa Marine Applications Inertial Systems Market Forecast (USD Billion), by Sub-Segment 2, 2018-2029
      Figure 97: Middle East & Africa Marine Applications Inertial Systems Market Forecast (USD Billion), by Sub-Segment 3, 2018-2029
      Figure 98: Middle East & Africa Marine Applications Inertial Systems Market Forecast (USD Billion), by Others, 2018-2029
      Figure 99: Middle East & Africa Marine Applications Inertial Systems Market Forecast (USD Billion), by GCC, 2018-2029
      Figure 100: Middle East & Africa Marine Applications Inertial Systems Market Forecast (USD Billion), by South Africa, 2018-2029
      Figure 101: Middle East & Africa Marine Applications Inertial Systems Market Forecast (USD Billion), by Rest of Middle East & Africa, 2018-2029 
      List of Tables
      Table 1: Global Marine Applications Inertial Systems Market Revenue (USD Billion) Forecast, by Segment 1, 2018-2029
      Table 2: Global Marine Applications Inertial Systems Market Revenue (USD Billion) Forecast, by Segment 2, 2018-2029
      Table 3: Global Marine Applications Inertial Systems Market Revenue (USD Billion) Forecast, by Segment 3, 2018-2029
      Table 4: Global Marine Applications Inertial Systems Market Revenue (USD Billion) Forecast, by Region, 2018-2029
      Table 5: North America Marine Applications Inertial Systems Market Revenue (USD Billion) Forecast, by Segment 1, 2018-2029
      Table 6: North America Marine Applications Inertial Systems Market Revenue (USD Billion) Forecast, by Segment 2, 2018-2029
      Table 7: North America Marine Applications Inertial Systems Market Revenue (USD Billion) Forecast, by Segment 3, 2018-2029
      Table 8: North America Marine Applications Inertial Systems Market Revenue (USD Billion) Forecast, by Country, 2018-2029
      Table 9: Europe Marine Applications Inertial Systems Market Revenue (USD Billion) Forecast, by Segment 1, 2018-2029
      Table 10: Europe Marine Applications Inertial Systems Market Revenue (USD Billion) Forecast, by Segment 2, 2018-2029
      Table 11: Europe Marine Applications Inertial Systems Market Revenue (USD Billion) Forecast, by Segment 3, 2018-2029
      Table 12: Europe Marine Applications Inertial Systems Market Revenue (USD Billion) Forecast, by Country, 2018-2029
      Table 13: Latin America Marine Applications Inertial Systems Market Revenue (USD Billion) Forecast, by Segment 1, 2018-2029
      Table 14: Latin America Marine Applications Inertial Systems Market Revenue (USD Billion) Forecast, by Segment 2, 2018-2029
      Table 15: Latin America Marine Applications Inertial Systems Market Revenue (USD Billion) Forecast, by Segment 3, 2018-2029
      Table 16: Latin America Marine Applications Inertial Systems Market Revenue (USD Billion) Forecast, by Country, 2018-2029
      Table 17: Asia Pacific Marine Applications Inertial Systems Market Revenue (USD Billion) Forecast, by Segment 1, 2018-2029
      Table 18: Asia Pacific Marine Applications Inertial Systems Market Revenue (USD Billion) Forecast, by Segment 2, 2018-2029
      Table 19: Asia Pacific Marine Applications Inertial Systems Market Revenue (USD Billion) Forecast, by Segment 3, 2018-2029
      Table 20: Asia Pacific Marine Applications Inertial Systems Market Revenue (USD Billion) Forecast, by Country, 2018-2029
      Table 21: Middle East & Africa Marine Applications Inertial Systems Market Revenue (USD Billion) Forecast, by Segment 1, 2018-2029
      Table 22: Middle East & Africa Marine Applications Inertial Systems Market Revenue (USD Billion) Forecast, by Segment 2, 2018-2029
      Table 23: Middle East & Africa Marine Applications Inertial Systems Market Revenue (USD Billion) Forecast, by Segment 3, 2018-2029
      Table 24: Middle East & Africa Marine Applications Inertial Systems Market Revenue (USD Billion) Forecast, by Country, 2018-2029
      Research Process

      Data Library Research are conducted by industry experts who offer insight on industry structure, market segmentations technology assessment and competitive landscape (CL), and penetration, as well as on emerging trends. Their analysis is based on primary interviews (~ 80%) and secondary research (~ 20%) as well as years of professional expertise in their respective industries. Adding to this, by analysing historical trends and current market positions, our analysts predict where the market will be headed for the next five years. Furthermore, the varying trends of segment & categories geographically presented are also studied and the estimated based on the primary & secondary research.

      In this particular report from the supply side Data Library Research has conducted primary surveys (interviews) with the key level executives (VP, CEO’s, Marketing Director, Business Development Manager and SOFT) of the companies that active & prominent as well as the midsized organization

      FIGURE 1: DLR RESEARH PROCESS

      research-methodology1

      Primary Research

      Extensive primary research was conducted to gain a deeper insight of the market and industry performance. The analysis is based on both primary and secondary research as well as years of professional expertise in the respective industries.

      In addition to analysing current and historical trends, our analysts predict where the market is headed over the next five years.

      It varies by segment for these categories geographically presented in the list of market tables. Speaking about this particular report we have conducted primary surveys (interviews) with the key level executives (VP, CEO’s, Marketing Director, Business Development Manager and many more) of the major players active in the market.

      Secondary Research

      Secondary research was mainly used to collect and identify information useful for the extensive, technical, market-oriented, and Friend’s study of the Global Extra Neutral Alcohol. It was also used to obtain key information about major players, market classification and segmentation according to the industry trends, geographical markets, and developments related to the market and technology perspectives. For this study, analysts have gathered information from various credible sources, such as annual reports, sec filings, journals, white papers, SOFT presentations, and company web sites.

      Market Size Estimation

      Both, top-down and bottom-up approaches were used to estimate and validate the size of the Global market and to estimate the size of various other dependent submarkets in the overall Extra Neutral Alcohol. The key players in the market were identified through secondary research and their market contributions in the respective geographies were determined through primary and secondary research.

      Forecast Model

      research-methodology2

      Happy to Assist You

      If you have a question?

      info@datalibraryresearch.com

      IND : +91 955 279 0357

      Browse Related Reports