Medical Engraving Market Overview and Analysis
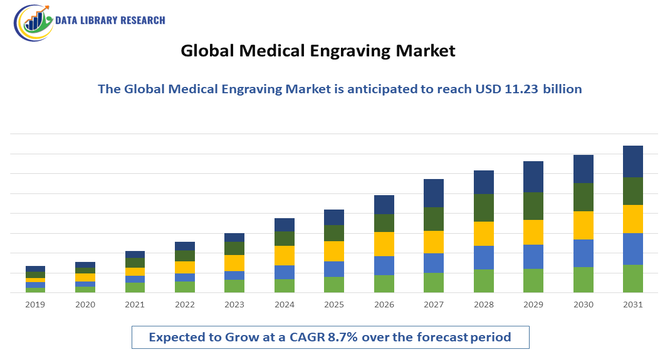
- The market size is often cited within the broader laser marking/engraving sector, which was valued at around USD 4.2 billion in 2025, expected to reach USD 11.23 billion by 2032. The market is forecasted to continue this substantial expansion, with a Compound Annual Growth Rate (CAGR) expected to range between 8.7% through the forecast period, 2025-2032.
Get Complete Analysis Of The Report - Download Updated Free Sample PDF
The growth in the Global Medical Engraving Market is primarily driven by the increasing demand for high-precision and durable identification and traceability solutions in the healthcare sector. Medical engraving is widely used for marking surgical instruments, implants, medical devices, and laboratory equipment, ensuring compliance with regulatory standards, improving patient safety, and preventing counterfeiting.
Medical Engraving Market Latest Trends
Key recent trends in the Global Medical Engraving Market are driven by the increasing adoption of advanced engraving and marking technologies that meet stringent healthcare regulations and traceability requirements. There is a strong shift toward laser engraving and high resolution marking systems, particularly fiber laser and UV laser technologies, which provide superior precision, speed, and durability on a wide range of medical materials including metals and polymers—critical for permanent identification on surgical instruments and implants. These technologies support unique device identification (UDI) compliance and enhance patient safety by enabling traceability and counterfeit prevention. Manufacturers are also integrating automated, high throughput engraving solutions directly into production lines to improve consistency and reduce operational costs.
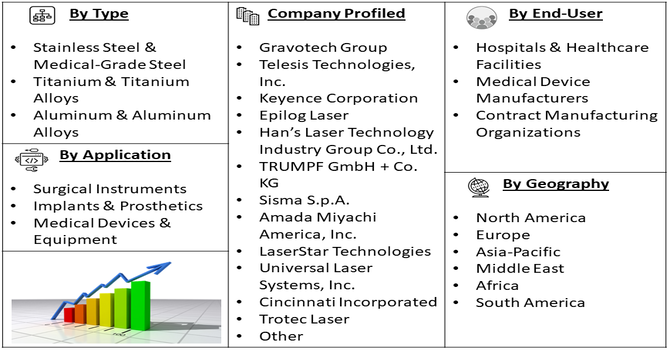
Segmentation: Global Medical Engraving Market is segmented By Technology (Dot Peen / Impact Engraving, Chemical Etching / Engraving, Mechanical Engraving), Material Type (Stainless Steel & Medical-Grade Steel, Titanium & Titanium Alloys, Aluminum & Aluminum Alloys), Application (Surgical Instruments, Implants & Prosthetics, Medical Devices & Equipment), End-User (Hospitals & Healthcare Facilities, Medical Device Manufacturers, Contract Manufacturing Organizations), and Geography (North America, Europe, Asia-Pacific, Middle East and Africa, and South America). The report provides the value (in USD million) for the above segments.
For Detailed Market Segmentation - Get a Free Sample PDF
Market Drivers:
- Increasing Need for Unique Device Identification (UDI) and Regulatory Compliance
A major driver for the medical engraving market is the growing emphasis on unique device identification (UDI) and stringent regulatory standards in the healthcare industry. Agencies such as the U.S. FDA, European Medicines Agency (EMA), and ISO require permanent, legible, and traceable markings on medical devices, surgical instruments, and implants to enhance patient safety and ensure accountability. Medical engraving provides a reliable solution to meet these requirements, enabling manufacturers to comply with regulations, track devices throughout their lifecycle, and prevent counterfeit products. The adoption of UDI standards has particularly boosted demand for high-precision engraving technologies like laser and dot-peen marking.
- Growth of Healthcare Infrastructure and Medical Device Manufacturing
The expansion of hospitals, surgical centers, and medical laboratories, along with the growing production of surgical instruments, implants, and diagnostic equipment, is another key driver. Increasing surgical procedures and rising healthcare investments globally require instruments and devices to be permanently and accurately marked for identification, sterilization tracking, and maintenance purposes. Advanced engraving technologies, such as fiber laser engraving and automated micro-engraving systems, allow manufacturers to handle high-volume production while ensuring precision and durability of markings. This growth in healthcare infrastructure and medical device production is directly contributing to increased adoption of medical engraving solutions worldwide.
Market Restraints:
- High Initial Investment and Operational Costs
A significant restraint for the medical engraving market is the high cost associated with advanced engraving technologies, particularly laser engraving systems such as fiber, CO₂, and UV lasers. These systems require substantial capital investment for equipment acquisition, installation, and maintenance. Additionally, operational costs, including electricity consumption, trained personnel, and consumables, can be high, especially for manufacturers in small and medium-sized enterprises (SMEs). The high upfront and recurring costs may limit adoption, particularly in developing regions or among smaller medical device manufacturers with constrained budgets.
Socioeconomic Impact on Medical Engraving Market
The Medical Engraving Market has a notable socioeconomic impact, improving healthcare quality and patient safety by enabling precise marking of medical devices, surgical instruments, and implants. Accurate engraving ensures traceability, compliance with regulatory standards, and reduction of medical errors, which is critical for both hospitals and manufacturers. The market also creates employment opportunities across manufacturing, engineering, and maintenance sectors, supporting skilled labor demand. Advancements in engraving technologies enhance efficiency, reduce material waste, and lower production costs, benefiting the broader healthcare economy. Furthermore, by enabling the production of reliable, high-quality medical components, the market contributes to improved patient outcomes, operational efficiency, and trust in healthcare systems, positively affecting social well-being and economic development.
Segmental Analysis:
- Dot Peen / Impact Engraving segment is expected to witness the highest growth over the forecast period
Dot peen or impact engraving is widely used in the medical industry due to its durability, precision, and suitability for marking metals such as stainless steel and titanium. This method creates permanent, legible markings that withstand sterilization processes and repeated handling, making it ideal for surgical instruments, implants, and medical devices. The growing need for traceability, compliance with UDI standards, and anti-counterfeiting measures is driving the adoption of dot peen engraving, particularly in large-scale medical device manufacturing where consistent and reliable marking is critical.
- Titanium & Titanium Alloys segment is expected to witness the highest growth over the forecast period
Titanium and its alloys are increasingly used in implants, prosthetics, and high-performance surgical instruments due to their biocompatibility, strength, and corrosion resistance. Engraving on titanium requires high-precision techniques such as laser and dot peen engraving, as the material is hard and challenging to mark manually. The rising demand for titanium-based implants, especially in orthopedics and dental applications, is driving growth for medical engraving services that can deliver permanent, accurate, and compliant markings on these critical components.
- Surgical Instruments segment is expected to witness the highest growth over the forecast period
Surgical instruments represent a significant application segment, as these tools must be accurately marked for identification, sterilization tracking, and regulatory compliance. Medical engraving ensures instruments are traceable throughout their lifecycle, preventing mix-ups during surgical procedures and enhancing patient safety. The increasing number of surgical procedures worldwide, combined with stringent hospital standards and regulatory mandates, is fueling the adoption of engraving solutions for stainless steel, titanium, and other surgical tool materials.
- Medical Device Manufacturers segment is expected to witness the highest growth over the forecast period
Medical device manufacturers are the primary end-users of engraving services, as they require permanent, precise markings on implants, surgical instruments, and diagnostic devices to comply with global regulatory standards. Engraving ensures traceability, quality assurance, and product differentiation, which are crucial for maintaining credibility and market share. The growth of medical device production, driven by technological innovation and rising healthcare demand, directly supports the expansion of the medical engraving market.
- North America segment is expected to witness the highest growth over the forecast period
North America dominates the market due to its advanced healthcare infrastructure, stringent regulatory environment, and high adoption of medical device technologies. U.S. FDA mandates and ISO compliance standards drive demand for precise, permanent markings on implants and surgical instruments. Additionally, the region has a strong presence of medical device manufacturers and contract manufacturing organizations that rely on high-precision engraving technologies. Continuous investments in healthcare infrastructure and the adoption of automation in medical device manufacturing further strengthen market growth in North America.
| Report Matrics |
Details |
| Market Size Value |
USD 11.23 billion |
| Growth Rate |
CAGR of 8.7 % |
| Forecast |
2026-2033 |
| Historical data |
2021-2024 |
| Base Year |
2025 |
| Report Coverage |
Forecasted revenue, company rating, competitive environment, growth drivers, and trends |
| Segment Coverage |
Type, Application, End-User, Geography |
| Regional Scope |
North America, Europe, Asia Pacific, Middle East |
| Customized scope |
Free customization of reports (With 3 months of analysis support) |
| To Learn More About This Report |
Request a Free Sample Copy |
Medical Engraving Market Competitive Landscape
The competitive landscape of the Global Medical Engraving Market is marked by the presence of specialized engraving equipment manufacturers, contract service providers, and integrated solutions firms that cater to stringent medical industry requirements such as traceability, regulatory compliance (UDI/FDA/ISO), and permanent marking durability. Companies compete on technology innovation (laser, dot peen, micro engraving), precision and consistency, automation, software integration, and after sales support. Strategic partnerships with medical device OEMs, investments in R&D for high speed and high resolution engraving solutions, and expansion into emerging markets are key competitive strategies. Demand for enhanced engraving on complex materials like titanium and advanced alloys continues to drive innovation and differentiation among market players.
Key Players:
- Gravotech Group
- Telesis Technologies, Inc.
- Keyence Corporation
- Epilog Laser
- Han’s Laser Technology Industry Group Co., Ltd.
- TRUMPF GmbH + Co. KG
- Sisma S.p.A.
- Amada Miyachi America, Inc.
- LaserStar Technologies
- Universal Laser Systems, Inc.
- Jenoptik AG
- Rofin Baasel Lasertech GmbH
- Cincinnati Incorporated
- Trotec Laser
- Mitsubishi Electric Corporation
- HPI Laser, Inc.
- Precise Parts, LLC
- Technifor (Linx Group)
- Cincinnati Gearing Systems, Inc.
- Adept Technology, Inc.
Recent Development
- In 2025, Vektor Medical received FDA 510(k) clearance for its next-generation vMap technology, enhancing non-invasive cardiac mapping with advanced features like atrial flutter mapping, 3D visualization, and secure data connectivity. These innovations increased demand for precise, customizable medical components, boosting the Medical Engraving Market by requiring accurate marking, traceability, and integration of engraved identifiers on devices used in advanced cardiac care.
- In June 2025, Ricoh USA, Inc. established Ricoh 3D for Healthcare, LLC to accelerate adoption of FDA-cleared, patient-specific medical devices, addressing hospitals’ demand for rapid, customized solutions. This initiative increased the need for precise and durable medical engraving on implants and device components, driving growth in the Medical Engraving Market by supporting traceability, regulatory compliance, and high-quality personalization in advanced healthcare manufacturing.
Frequently Asked Questions (FAQ) :
Q1. What are the main growth-driving factors for this market?
The main driver is the growing demand for medical devices, fueled by the increasing aging population and chronic diseases. Regulatory mandates for device traceability, such as Unique Device Identification (UDI), require permanent, readable marks on implants and instruments, accelerating the adoption of high-precision engraving technologies.
Q2. What are the main restraining factors for this market?
Restraining factors include the high initial capital investment required for specialized laser engraving systems and related infrastructure. The market is also hindered by the complexity and lack of global uniformity in regulatory standards for marking medical devices, increasing compliance costs for manufacturers.
Q3. Which segment is expected to witness high growth?
The Orthopedics and Implants segment is expected to witness high growth due to the critical need for permanent traceability markings on items like hip and knee replacements. Geographically, the Asia-Pacific region is the fastest-growing market, driven by expanding healthcare expenditure and device manufacturing facilities.
Q4. Who are the top major players for this market?
The demand for medical engraving is primarily driven by large medical device manufacturers who outsource or manage in-house marking. Key industry influencers include major global players like Medtronic, Johnson & Johnson, Abbott, and Stryker, who set the quality and traceability standards for all engraved components.
Q5. Which country is the largest player?
North America, specifically the United States, holds the largest revenue share in this market. This dominance is due to the presence of numerous global medical device headquarters, significant R&D spending, and a robust, early-established regulatory framework that strictly enforces the marking and traceability of medical products.
List of Figures
Figure 1: Global Medical Engraving Market Revenue Breakdown (USD Billion, %) by Region, 2022 & 2029
Figure 2: Global Medical Engraving Market Value Share (%), By Segment 1, 2022 & 2029
Figure 3: Global Medical Engraving Market Forecast (USD Billion), by Sub-Segment 1, 2018-2029
Figure 4: Global Medical Engraving Market Forecast (USD Billion), by Sub-Segment 2, 2018-2029
Figure 5: Global Medical Engraving Market Value Share (%), By Segment 2, 2022 & 2029
Figure 6: Global Medical Engraving Market Forecast (USD Billion), by Sub-Segment 1, 2018-2029
Figure 7: Global Medical Engraving Market Forecast (USD Billion), by Sub-Segment 2, 2018-2029
Figure 8: Global Medical Engraving Market Forecast (USD Billion), by Sub-Segment 3, 2018-2029
Figure 9: Global Medical Engraving Market Forecast (USD Billion), by Others, 2018-2029
Figure 10: Global Medical Engraving Market Value Share (%), By Segment 3, 2022 & 2029
Figure 11: Global Medical Engraving Market Forecast (USD Billion), by Sub-Segment 1, 2018-2029
Figure 12: Global Medical Engraving Market Forecast (USD Billion), by Sub-Segment 2, 2018-2029
Figure 13: Global Medical Engraving Market Forecast (USD Billion), by Sub-Segment 3, 2018-2029
Figure 14: Global Medical Engraving Market Forecast (USD Billion), by Others, 2018-2029
Figure 15: Global Medical Engraving Market Value (USD Billion), by Region, 2022 & 2029
Figure 16: North America Medical Engraving Market Value Share (%), By Segment 1, 2022 & 2029
Figure 17: North America Medical Engraving Market Forecast (USD Billion), by Sub-Segment 1, 2018-2029
Figure 18: North America Medical Engraving Market Forecast (USD Billion), by Sub-Segment 2, 2018-2029
Figure 19: North America Medical Engraving Market Value Share (%), By Segment 2, 2022 & 2029
Figure 20: North America Medical Engraving Market Forecast (USD Billion), by Sub-Segment 1, 2018-2029
Figure 21: North America Medical Engraving Market Forecast (USD Billion), by Sub-Segment 2, 2018-2029
Figure 22: North America Medical Engraving Market Forecast (USD Billion), by Sub-Segment 3, 2018-2029
Figure 23: North America Medical Engraving Market Forecast (USD Billion), by Others, 2018-2029
Figure 24: North America Medical Engraving Market Value Share (%), By Segment 3, 2022 & 2029
Figure 25: North America Medical Engraving Market Forecast (USD Billion), by Sub-Segment 1, 2018-2029
Figure 26: North America Medical Engraving Market Forecast (USD Billion), by Sub-Segment 2, 2018-2029
Figure 27: North America Medical Engraving Market Forecast (USD Billion), by Sub-Segment 3, 2018-2029
Figure 28: North America Medical Engraving Market Forecast (USD Billion), by Others, 2018-2029
Figure 29: North America Medical Engraving Market Forecast (USD Billion), by U.S., 2018-2029
Figure 30: North America Medical Engraving Market Forecast (USD Billion), by Canada, 2018-2029
Figure 31: Latin America Medical Engraving Market Value Share (%), By Segment 1, 2022 & 2029
Figure 32: Latin America Medical Engraving Market Forecast (USD Billion), by Sub-Segment 1, 2018-2029
Figure 33: Latin America Medical Engraving Market Forecast (USD Billion), by Sub-Segment 2, 2018-2029
Figure 34: Latin America Medical Engraving Market Value Share (%), By Segment 2, 2022 & 2029
Figure 35: Latin America Medical Engraving Market Forecast (USD Billion), by Sub-Segment 1, 2018-2029
Figure 36: Latin America Medical Engraving Market Forecast (USD Billion), by Sub-Segment 2, 2018-2029
Figure 37: Latin America Medical Engraving Market Forecast (USD Billion), by Sub-Segment 3, 2018-2029
Figure 38: Latin America Medical Engraving Market Forecast (USD Billion), by Others, 2018-2029
Figure 39: Latin America Medical Engraving Market Value Share (%), By Segment 3, 2022 & 2029
Figure 40: Latin America Medical Engraving Market Forecast (USD Billion), by Sub-Segment 1, 2018-2029
Figure 41: Latin America Medical Engraving Market Forecast (USD Billion), by Sub-Segment 2, 2018-2029
Figure 42: Latin America Medical Engraving Market Forecast (USD Billion), by Sub-Segment 3, 2018-2029
Figure 43: Latin America Medical Engraving Market Forecast (USD Billion), by Others, 2018-2029
Figure 44: Latin America Medical Engraving Market Forecast (USD Billion), by Brazil, 2018-2029
Figure 45: Latin America Medical Engraving Market Forecast (USD Billion), by Mexico, 2018-2029
Figure 46: Latin America Medical Engraving Market Forecast (USD Billion), by Rest of Latin America, 2018-2029
Figure 47: Europe Medical Engraving Market Value Share (%), By Segment 1, 2022 & 2029
Figure 48: Europe Medical Engraving Market Forecast (USD Billion), by Sub-Segment 1, 2018-2029
Figure 49: Europe Medical Engraving Market Forecast (USD Billion), by Sub-Segment 2, 2018-2029
Figure 50: Europe Medical Engraving Market Value Share (%), By Segment 2, 2022 & 2029
Figure 51: Europe Medical Engraving Market Forecast (USD Billion), by Sub-Segment 1, 2018-2029
Figure 52: Europe Medical Engraving Market Forecast (USD Billion), by Sub-Segment 2, 2018-2029
Figure 53: Europe Medical Engraving Market Forecast (USD Billion), by Sub-Segment 3, 2018-2029
Figure 54: Europe Medical Engraving Market Forecast (USD Billion), by Others, 2018-2029
Figure 55: Europe Medical Engraving Market Value Share (%), By Segment 3, 2022 & 2029
Figure 56: Europe Medical Engraving Market Forecast (USD Billion), by Sub-Segment 1, 2018-2029
Figure 57: Europe Medical Engraving Market Forecast (USD Billion), by Sub-Segment 2, 2018-2029
Figure 58: Europe Medical Engraving Market Forecast (USD Billion), by Sub-Segment 3, 2018-2029
Figure 59: Europe Medical Engraving Market Forecast (USD Billion), by Others, 2018-2029
Figure 60: Europe Medical Engraving Market Forecast (USD Billion), by U.K., 2018-2029
Figure 61: Europe Medical Engraving Market Forecast (USD Billion), by Germany, 2018-2029
Figure 62: Europe Medical Engraving Market Forecast (USD Billion), by France, 2018-2029
Figure 63: Europe Medical Engraving Market Forecast (USD Billion), by Italy, 2018-2029
Figure 64: Europe Medical Engraving Market Forecast (USD Billion), by Spain, 2018-2029
Figure 65: Europe Medical Engraving Market Forecast (USD Billion), by Russia, 2018-2029
Figure 66: Europe Medical Engraving Market Forecast (USD Billion), by Rest of Europe, 2018-2029
Figure 67: Asia Pacific Medical Engraving Market Value Share (%), By Segment 1, 2022 & 2029
Figure 68: Asia Pacific Medical Engraving Market Forecast (USD Billion), by Sub-Segment 1, 2018-2029
Figure 69: Asia Pacific Medical Engraving Market Forecast (USD Billion), by Sub-Segment 2, 2018-2029
Figure 70: Asia Pacific Medical Engraving Market Value Share (%), By Segment 2, 2022 & 2029
Figure 71: Asia Pacific Medical Engraving Market Forecast (USD Billion), by Sub-Segment 1, 2018-2029
Figure 72: Asia Pacific Medical Engraving Market Forecast (USD Billion), by Sub-Segment 2, 2018-2029
Figure 73: Asia Pacific Medical Engraving Market Forecast (USD Billion), by Sub-Segment 3, 2018-2029
Figure 74: Asia Pacific Medical Engraving Market Forecast (USD Billion), by Others, 2018-2029
Figure 75: Asia Pacific Medical Engraving Market Value Share (%), By Segment 3, 2022 & 2029
Figure 76: Asia Pacific Medical Engraving Market Forecast (USD Billion), by Sub-Segment 1, 2018-2029
Figure 77: Asia Pacific Medical Engraving Market Forecast (USD Billion), by Sub-Segment 2, 2018-2029
Figure 78: Asia Pacific Medical Engraving Market Forecast (USD Billion), by Sub-Segment 3, 2018-2029
Figure 79: Asia Pacific Medical Engraving Market Forecast (USD Billion), by Others, 2018-2029
Figure 80: Asia Pacific Medical Engraving Market Forecast (USD Billion), by China, 2018-2029
Figure 81: Asia Pacific Medical Engraving Market Forecast (USD Billion), by India, 2018-2029
Figure 82: Asia Pacific Medical Engraving Market Forecast (USD Billion), by Japan, 2018-2029
Figure 83: Asia Pacific Medical Engraving Market Forecast (USD Billion), by Australia, 2018-2029
Figure 84: Asia Pacific Medical Engraving Market Forecast (USD Billion), by Southeast Asia, 2018-2029
Figure 85: Asia Pacific Medical Engraving Market Forecast (USD Billion), by Rest of Asia Pacific, 2018-2029
Figure 86: Middle East & Africa Medical Engraving Market Value Share (%), By Segment 1, 2022 & 2029
Figure 87: Middle East & Africa Medical Engraving Market Forecast (USD Billion), by Sub-Segment 1, 2018-2029
Figure 88: Middle East & Africa Medical Engraving Market Forecast (USD Billion), by Sub-Segment 2, 2018-2029
Figure 89: Middle East & Africa Medical Engraving Market Value Share (%), By Segment 2, 2022 & 2029
Figure 90: Middle East & Africa Medical Engraving Market Forecast (USD Billion), by Sub-Segment 1, 2018-2029
Figure 91: Middle East & Africa Medical Engraving Market Forecast (USD Billion), by Sub-Segment 2, 2018-2029
Figure 92: Middle East & Africa Medical Engraving Market Forecast (USD Billion), by Sub-Segment 3, 2018-2029
Figure 93: Middle East & Africa Medical Engraving Market Forecast (USD Billion), by Others, 2018-2029
Figure 94: Middle East & Africa Medical Engraving Market Value Share (%), By Segment 3, 2022 & 2029
Figure 95: Middle East & Africa Medical Engraving Market Forecast (USD Billion), by Sub-Segment 1, 2018-2029
Figure 96: Middle East & Africa Medical Engraving Market Forecast (USD Billion), by Sub-Segment 2, 2018-2029
Figure 97: Middle East & Africa Medical Engraving Market Forecast (USD Billion), by Sub-Segment 3, 2018-2029
Figure 98: Middle East & Africa Medical Engraving Market Forecast (USD Billion), by Others, 2018-2029
Figure 99: Middle East & Africa Medical Engraving Market Forecast (USD Billion), by GCC, 2018-2029
Figure 100: Middle East & Africa Medical Engraving Market Forecast (USD Billion), by South Africa, 2018-2029
Figure 101: Middle East & Africa Medical Engraving Market Forecast (USD Billion), by Rest of Middle East & Africa, 2018-2029
List of Tables
Table 1: Global Medical Engraving Market Revenue (USD Billion) Forecast, by Segment 1, 2018-2029
Table 2: Global Medical Engraving Market Revenue (USD Billion) Forecast, by Segment 2, 2018-2029
Table 3: Global Medical Engraving Market Revenue (USD Billion) Forecast, by Segment 3, 2018-2029
Table 4: Global Medical Engraving Market Revenue (USD Billion) Forecast, by Region, 2018-2029
Table 5: North America Medical Engraving Market Revenue (USD Billion) Forecast, by Segment 1, 2018-2029
Table 6: North America Medical Engraving Market Revenue (USD Billion) Forecast, by Segment 2, 2018-2029
Table 7: North America Medical Engraving Market Revenue (USD Billion) Forecast, by Segment 3, 2018-2029
Table 8: North America Medical Engraving Market Revenue (USD Billion) Forecast, by Country, 2018-2029
Table 9: Europe Medical Engraving Market Revenue (USD Billion) Forecast, by Segment 1, 2018-2029
Table 10: Europe Medical Engraving Market Revenue (USD Billion) Forecast, by Segment 2, 2018-2029
Table 11: Europe Medical Engraving Market Revenue (USD Billion) Forecast, by Segment 3, 2018-2029
Table 12: Europe Medical Engraving Market Revenue (USD Billion) Forecast, by Country, 2018-2029
Table 13: Latin America Medical Engraving Market Revenue (USD Billion) Forecast, by Segment 1, 2018-2029
Table 14: Latin America Medical Engraving Market Revenue (USD Billion) Forecast, by Segment 2, 2018-2029
Table 15: Latin America Medical Engraving Market Revenue (USD Billion) Forecast, by Segment 3, 2018-2029
Table 16: Latin America Medical Engraving Market Revenue (USD Billion) Forecast, by Country, 2018-2029
Table 17: Asia Pacific Medical Engraving Market Revenue (USD Billion) Forecast, by Segment 1, 2018-2029
Table 18: Asia Pacific Medical Engraving Market Revenue (USD Billion) Forecast, by Segment 2, 2018-2029
Table 19: Asia Pacific Medical Engraving Market Revenue (USD Billion) Forecast, by Segment 3, 2018-2029
Table 20: Asia Pacific Medical Engraving Market Revenue (USD Billion) Forecast, by Country, 2018-2029
Table 21: Middle East & Africa Medical Engraving Market Revenue (USD Billion) Forecast, by Segment 1, 2018-2029
Table 22: Middle East & Africa Medical Engraving Market Revenue (USD Billion) Forecast, by Segment 2, 2018-2029
Table 23: Middle East & Africa Medical Engraving Market Revenue (USD Billion) Forecast, by Segment 3, 2018-2029
Table 24: Middle East & Africa Medical Engraving Market Revenue (USD Billion) Forecast, by Country, 2018-2029
Research Process
Data Library Research are conducted by industry experts who offer insight on
industry structure, market segmentations technology assessment and competitive landscape (CL), and penetration, as well as on emerging trends. Their analysis is based on primary interviews (~ 80%) and secondary research (~ 20%) as well as years of professional expertise in their respective industries. Adding to this, by analysing historical trends and current market positions, our analysts predict where the market will be headed for the next five years. Furthermore, the varying trends of segment & categories geographically presented are also studied and the estimated based on the primary & secondary research.
In this particular report from the supply side Data Library Research has conducted primary surveys (interviews) with the key level executives (VP, CEO’s, Marketing Director, Business Development Manager
and SOFT) of the companies that active & prominent as well as the midsized organization
FIGURE 1: DLR RESEARH PROCESS
![research-methodology1]()
Primary Research
Extensive primary research was conducted to gain a deeper insight of the market and industry performance. The analysis is based on both primary and secondary research as well as years of professional expertise in the respective industries.
In addition to analysing current and historical trends, our analysts predict where the market is headed over the next five years.
It varies by segment for these categories geographically presented in the list of market tables. Speaking about this particular report we have conducted primary surveys (interviews) with the key level executives (VP, CEO’s, Marketing Director, Business Development Manager and many more) of the major players active in the market.
Secondary Research
Secondary research was mainly used to collect and identify information useful for the extensive, technical, market-oriented, and Friend’s study of the Global Extra Neutral Alcohol. It was also used to obtain key information about major players, market classification and segmentation according to the industry trends, geographical markets, and developments related to the market and technology perspectives. For this study, analysts have gathered information from various credible sources, such as annual reports, sec filings, journals, white papers, SOFT presentations, and company web sites.
Market Size Estimation
Both, top-down and bottom-up approaches were used to estimate and validate the size of the Global market and to estimate the size of various other dependent submarkets in the overall Extra Neutral Alcohol. The key players in the market were identified through secondary research and their market contributions in the respective geographies were determined through primary and secondary research.
Forecast Model
![research-methodology2]()