Menopause App Market Overview and Analysis:

This market is forecast to exhibit strong double-digit growth with a CAGR of around 17.2% over the forecast period (2025–2032). Valued at approximately USD 345.6 million in 2025, the market is projected to reach USD 891.6 million by 2032.

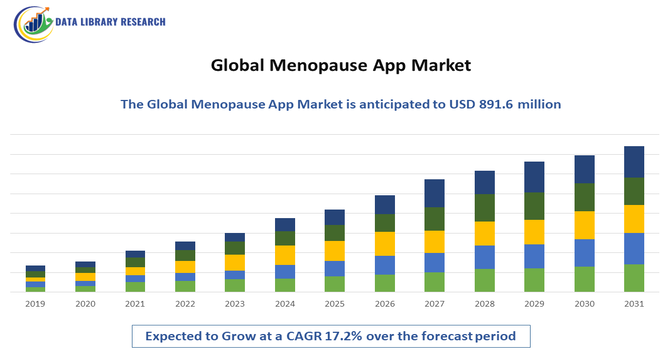
The Global Menopause App Market is witnessing robust growth, driven by the rising adoption of digital health solutions, increasing awareness of women’s health, and the growing prevalence of menopause-related symptoms among the aging female population. Menopause apps are designed to assist women in tracking symptoms, monitoring hormonal changes, managing lifestyle adjustments, and accessing educational and therapeutic support during the menopausal transition. The market is gaining momentum due to the growing emphasis on personalized healthcare, integration of artificial intelligence (AI) and machine learning (ML) for predictive symptom tracking, and the rising popularity of telemedicine platforms that offer remote consultations with gynecologists and wellness experts.

Menopause App Market Latest Trends:

The Global Menopause App Market is experiencing rapid transformation, driven by emerging digital health trends and the growing focus on women’s midlife wellness. The key trends is the expansion of FemTech into menopause care, as developers shift focus from fertility and menstrual tracking toward supporting women aged 40–60 through perimenopause and postmenopause. The market is seeing increasing adoption of AI-driven and wearable-integrated solutions, enabling personalized insights, predictive symptom tracking, and seamless integration with smart devices for real-time monitoring of hot flashes, sleep patterns, and mood fluctuations.

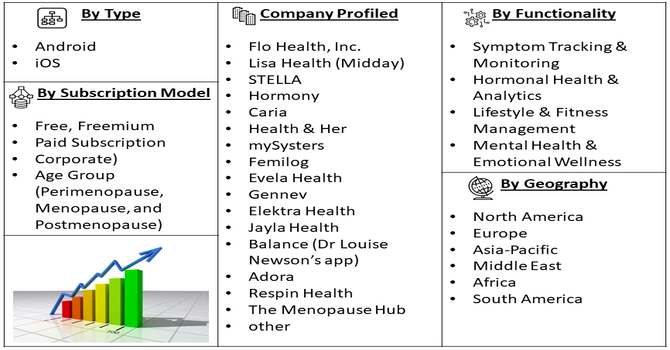
Segmentation: The Global Menopause App Market is segmented By Platform Type (Android, and iOS), Functionality (Symptom Tracking & Monitoring, Hormonal Health & Analytics, Lifestyle & Fitness Management, Mental Health & Emotional Wellness), Subscription Model (Free, Freemium, Paid Subscription, and Corporate), Age Group (Perimenopause, Menopause, and Postmenopause), and Geography (North America, Europe, Asia-Pacific, Middle East and Africa, and South America). The report provides the value (in USD million) for the above segments.

Market Drivers:

  • Rising Awareness and Focus on Women’s Health and Wellness

Increasing global awareness about menopause and its impact on women’s physical and mental health is a major driver of the menopause app market. Governments, healthcare organizations, and FemTech companies are actively promoting discussions around menopause, reducing stigma, and encouraging women to seek digital health support. For instance, as part of PM Narendra Modi’s “Swasth Nari, Sashakt Parivar Abhiyaan,” JIPMER Nursing College organized a Postnatal Depression awareness campaign on 22 September 2025 in Puducherry. Nursing faculty and students educated OPD patients and the public through talks, counselling, and materials, promoting early recognition and support. The initiative improved women’s mental and physical wellbeing and highlighted the need for digital health tools, indirectly influencing the global menopause and women’s health app market.

As more women prioritize holistic wellness and preventive healthcare, menopause apps that provide symptom tracking, lifestyle recommendations, and educational resources are witnessing growing adoption. This heightened awareness, coupled with greater acceptance of digital health tools, is significantly expanding the market’s user base.

  • Technological Advancements and Integration of AI and Wearable Devices

The integration of artificial intelligence (AI), machine learning (ML), and wearable technologies is revolutionizing menopause care. Modern menopause apps now offer personalized insights, predictive analytics for symptom management, and data synchronization with smartwatches and fitness trackers. For instance, in March 2025, Sidekick Health launched a 12-week clinical study in Germany to evaluate its prescription digital therapeutic, MENO! App, targeting unmet needs of menopausal women. The study validated the app’s effectiveness in symptom relief and showcased technological advancements, including AI integration and wearable compatibility, reinforcing innovation in digital health and boosting growth and adoption within the global menopause app market.

Market Restraints:

  • Data Privacy and Security Concerns

The major restraints in the global menopause app market is the growing concern over data privacy and security. These apps collect highly sensitive personal health information, including hormonal data, mental health status, and lifestyle habits. Inadequate data protection measures, lack of transparency in data usage, and instances of third-party data sharing have led to user distrust. As regulatory scrutiny over digital health platforms intensifies—particularly under frameworks like GDPR and HIPAA—companies face increasing compliance challenges. This has slowed adoption among privacy-conscious users and limited the expansion of some apps in regions with strict data protection laws.

Socio Economic Impact on Menopause App Market

The global menopause app market is reshaping socioeconomic dynamics by empowering millions of women to better manage symptoms through digital tools, which not only improves quality of life but also helps reduce healthcare costs and productivity losses; with the market already valued in the hundreds of millions and growing rapidly, it attracts major investment, spurs innovation in femtech, and addresses a long neglected healthcare gap—yet it also risks deepening inequalities, since subscription costs or digital literacy barriers may exclude lower income women from these benefits.

Segmental Analysis:

  • Android segment is expected to witness highest growth over the forecast period

The Android segment holds the largest share of the global menopause app market, primarily due to the widespread availability and affordability of Android smartphones, especially in emerging economies such as India, China, and Brazil. The open-source nature of the Android platform allows developers to introduce affordable and easily accessible menopause management applications to a broad user base. Additionally, the Google Play Store’s vast ecosystem supports a diverse range of wellness and health-tracking apps, enhancing accessibility for women across various income levels. The increasing compatibility of Android devices with wearable technologies and fitness trackers further drives the segment’s growth.

  • Symptom Tracking & Monitoring segment is expected to witness highest growth over the forecast period

The Symptom Tracking & Monitoring segment dominates the market as it forms the core function of most menopause apps. These apps enable women to record, monitor, and analyze symptoms such as hot flashes, mood changes, sleep disturbances, and menstrual irregularities. With the integration of artificial intelligence (AI) and data analytics, modern tracking features now offer predictive insights, helping users anticipate and manage symptoms more effectively. Continuous monitoring not only empowers women to understand their bodies but also facilitates data sharing with healthcare providers for personalized treatment. The growing demand for self-management tools and increased awareness about menopausal health contribute significantly to the expansion of this segment.

  • Freemium segment is expected to witness highest growth over the forecast period

The Freemium model accounts for the highest revenue share in the menopause app market, as it allows users to access essential tracking features for free while offering advanced analytics, virtual consultations, and lifestyle guidance through paid premium tiers. This model has proven successful in attracting large user bases while generating steady revenue from premium upgrades. Additionally, it caters to diverse economic groups by providing flexibility between free and subscription-based access. The success of the freemium model is further enhanced by app developers’ strategies to integrate targeted advertisements and personalized recommendations, creating a balance between accessibility and profitability.

  • Perimenopause (40–50 years) segment is expected to witness highest growth over the forecast period

The Perimenopause segment represents the largest user group in the menopause app market, as women in this age range experience early hormonal fluctuations and symptom onset. This phase is marked by irregular menstrual cycles, mood swings, sleep disruptions, and physical changes that encourage women to seek digital health support. Perimenopausal women are increasingly turning to mobile apps for tracking symptoms, accessing educational content, and receiving lifestyle recommendations to ease the transition into menopause. The segment’s dominance is also supported by growing awareness campaigns and the adoption of digital health tools among women in their 40s who are more tech-savvy and health-conscious.

  • North America is expected to witness highest growth over the forecast period

North America dominates the global menopause app market, driven by high smartphone penetration, strong digital health infrastructure, and widespread acceptance of FemTech solutions.

The region’s leading position is reinforced by growing awareness of women’s health issues, availability of advanced apps with AI and telehealth integration, and the presence of key market players offering evidence-based digital therapeutic solutions. For instance, in October 2025, a USD 5 million grant from the Steven & Alexandra Cohen Foundation, led by Alex Cohen, funded the digital-innovation phase of the NextGen Now initiative, creating a digital ecosystem for updated educational content. The project supported training for current and future healthcare professionals, advanced AI and wearable technology integration, and strengthened North America’s menopause app market by enhancing digital tools for midlife women’s care.

The U.S. market, in particular, benefits from collaborations between healthcare providers, employers, and insurers to integrate menopause support into workplace wellness programs. Furthermore, strong regulatory frameworks for digital health technologies and a growing emphasis on personalized medicine continue to stimulate market expansion across the region.

Menopause App Market Competitive Landscape:

The Global Menopause App Market is moderately fragmented and highly competitive, with numerous FemTech startups and digital health companies introducing innovative solutions for women’s midlife health. Key players are focusing on integrating AI-driven analytics, wearable connectivity, and telehealth features to enhance user engagement and personalization. Strategic collaborations with healthcare providers, wellness platforms, and pharmaceutical companies are becoming common to expand service offerings and credibility. Companies are also emphasizing evidence-based content, data privacy, and holistic wellness support to differentiate themselves in an increasingly crowded market.

Key Players:

  • Flo Health, Inc.
  • Lisa Health (Midday)
  • STELLA
  • Hormony
  • Caria
  • Health & Her
  • mySysters
  • Femilog
  • Evela Health
  • Gennev
  • Elektra Health
  • Jayla Health
  • Balance (Dr Louise Newson’s app)
  • Adora
  • Respin Health
  • The Menopause Hub
  • MenoLabs (via app / community component)
  • MenoPal
  • MenoConnect
  • MenoCoach

Recent Development

  • In July 2025, Doctors at UCLH and University College London (UCL) developed the digital decision-making tool, MENO.pause, to assist clinicians in managing menopause symptoms tailored to individual patients’ health needs. The app incorporated the latest national and international guidelines from NICE, BMS, and BGCS, enabling GPs and hospital staff to deliver evidence-based, high-quality care. Its launch highlighted the growing role of digital solutions in the global menopause app market, promoting personalized treatment and expanding femtech innovation.


  • In January 2025, Bayer Consumer Health entered the UK menopause market with the launch of CanesMeno, a digital education platform and scientifically-backed product range designed to support the estimated 13 million perimenopausal or menopausal women—about a third of the UK’s female population. This initiative strengthened the global menopause app market by demonstrating major consumer health companies’ commitment to digital solutions, increasing awareness, driving adoption of tech-enabled menopause management, and encouraging innovation in femtech products worldwide.


Frequently Asked Questions (FAQ) :

Q1. What are the main growth-driving factors for this market?

The market is primarily driven by the rapidly aging global female population, with over a billion women expected to be post-menopausal by 2025. This large demographic is seeking digital tools for symptom management, tracking, and personalized health guidance. Increased investment in women's health technology (FemTech) and rising consumer awareness of digital health solutions also propel growth.

Q2. What are the main restraining factors for this market?

Key restraining factors include user concerns over data privacy and security, as these apps handle highly sensitive personal health information. Additionally, the existing social stigma surrounding menopause can make some women reluctant to use or discuss dedicated apps. There is also a lack of sufficient technological proficiency among some older users, limiting the potential user base.

Q3. Which segment is expected to witness high growth?

Within the broader women's health market, the Menopause app segment itself is projected to be among the fastest-growing categories. Furthermore, the demand for Personalized Insights features is set for high growth. These features use AI and tailored data to provide customized recommendations for symptom relief, lifestyle adjustments, and communication with healthcare providers.

Q4. Who are the top major players for this market?

The market is highly competitive and features a mix of specialized FemTech startups and established health app developers. Some of the top players include Flo Health, Clue, Natural Cycles, Glow, and Ovia Health. These companies are continually adding specific menopause-related features and integrating them with broader women's health and wellness platforms to capture market share.

Q5. Which country is the largest player?

North America holds the largest market share in the Menopause App and the broader Women's Health App market. This dominance is due to the high digital literacy, widespread smartphone adoption, and a strong culture of health awareness and high spending on digital healthcare services in the region, particularly in the United States.

Menopause App MARKET STUDY GLOBAL MARKET ANALYSIS, INSIGHTS AND FORECAST, 2022-2029

    1. Introduction

    • 1.1. Research Scope
    • 1.2. Market Segmentation
    • 1.3. Research Methodology
    • 1.4. Definitions and Assumptions

    2. Executive Summary

      3. Market Dynamics

      • 3.1. Market Drivers
      • 3.2. Market Restraints
      • 3.3. Market Opportunities

      4. Key Insights

      • 4.1. Key Emerging Trends – For Major Countries
      • 4.2. Latest Technological Advancement
      • 4.3. Regulatory Landscape
      • 4.4. Industry SWOT Analysis
      • 4.5. Porters Five Forces Analysis

      5. Global Menopause App Market Analysis (USD Billion), Insights and Forecast, 2018-2029

      • 5.1. Key Findings / Summary
      • 5.2. Market Analysis, Insights and Forecast – By Segment 1
        • 5.2.1. Sub-Segment 1
        • 5.2.2. Sub-Segment 2
      • 5.3. Market Analysis, Insights and Forecast – By Segment 2
        • 5.3.1. Sub-Segment 1
        • 5.3.2. Sub-Segment 2
        • 5.3.3. Sub-Segment 3
        • 5.3.4. Others
      • 5.4. Market Analysis, Insights and Forecast – By Segment 3
        • 5.4.1. Sub-Segment 1
        • 5.4.2. Sub-Segment 2
        • 5.4.3. Sub-Segment 3
        • 5.4.4. Others
      • 5.5. Market Analysis, Insights and Forecast – By Region
        • 5.5.1. North America
        • 5.5.2. Latin America
        • 5.5.3. Europe
        • 5.5.4. Asia Pacific
        • 5.5.5. Middle East and Africa

      6. North America Menopause App Market Analysis (USD Billion), Insights and Forecast, 2018-2029

      • 6.1. Key Findings / Summary
      • 6.2. Market Analysis, Insights and Forecast – By Segment 1
        • 6.2.1. Sub-Segment 1
        • 6.2.2. Sub-Segment 2
      • 6.3. Market Analysis, Insights and Forecast – By Segment 2
        • 6.3.1. Sub-Segment 1
        • 6.3.2. Sub-Segment 2
        • 6.3.3. Sub-Segment 3
        • 6.3.4. Others
      • 6.4. Market Analysis, Insights and Forecast – By Segment 3
        • 6.4.1. Sub-Segment 1
        • 6.4.2. Sub-Segment 2
        • 6.4.3. Sub-Segment 3
        • 6.4.4. Others
      • 6.5. Market Analysis, Insights and Forecast – By Country
        • 6.5.1. U.S.
        • 6.5.2. Canada

      7. Latin America Menopause App Market Analysis (USD Billion), Insights and Forecast, 2018-2029

      • 7.1. Key Findings / Summary
      • 7.2. Market Analysis, Insights and Forecast – By Segment 1
        • 7.2.1. Sub-Segment 1
        • 7.2.2. Sub-Segment 2
      • 7.3. Market Analysis, Insights and Forecast – By Segment 2
        • 7.3.1. Sub-Segment 1
        • 7.3.2. Sub-Segment 2
        • 7.3.3. Sub-Segment 3
        • 7.3.4. Others
      • 7.4. Market Analysis, Insights and Forecast – By Segment 3
        • 7.4.1. Sub-Segment 1
        • 7.4.2. Sub-Segment 2
        • 7.4.3. Sub-Segment 3
        • 7.4.4. Others
      • 7.5. Insights and Forecast – By Country
        • 7.5.1. Brazil
        • 7.5.2. Mexico
        • 7.5.3. Rest of Latin America

      8. Europe Menopause App Market Analysis (USD Billion), Insights and Forecast, 2018-2029

      • 8.1. Key Findings / Summary
      • 8.2. Market Analysis, Insights and Forecast – By Segment 1
        • 8.2.1. Sub-Segment 1
        • 8.2.2. Sub-Segment 2
      • 8.3. Market Analysis, Insights and Forecast – By Segment 2
        • 8.3.1. Sub-Segment 1
        • 8.3.2. Sub-Segment 2
        • 8.3.3. Sub-Segment 3
        • 8.3.4. Others
      • 8.4. Market Analysis, Insights and Forecast – By Segment 3
        • 8.4.1. Sub-Segment 1
        • 8.4.2. Sub-Segment 2
        • 8.4.3. Sub-Segment 3
        • 8.4.4. Others
      • 8.5. Market Analysis, Insights and Forecast – By Country
        • 8.5.1. UK
        • 8.5.2. Germany
        • 8.5.3. France
        • 8.5.4. Italy
        • 8.5.5. Spain
        • 8.5.6. Russia
        • 8.5.7. Rest of Europe

      9. Asia Pacific Menopause App Market Analysis (USD Billion), Insights and Forecast, 2018-2029

      • 9.1. Key Findings / Summary
      • 9.2. Market Analysis, Insights and Forecast – By Segment 1
        • 9.2.1. Sub-Segment 1
        • 9.2.2. Sub-Segment 2
      • 9.3. Market Analysis, Insights and Forecast – By Segment 2
        • 9.3.1. Sub-Segment 1
        • 9.3.2. Sub-Segment 2
        • 9.3.3. Sub-Segment 3
        • 9.3.4. Others
      • 9.4. Market Analysis, Insights and Forecast – By Segment 3
        • 9.4.1. Sub-Segment 1
        • 9.4.2. Sub-Segment 2
        • 9.4.3. Sub-Segment 3
        • 9.4.4. Others
      • 9.5. Market Analysis, Insights and Forecast – By Country
        • 9.5.1. China
        • 9.5.2. India
        • 9.5.3. Japan
        • 9.5.4. Australia
        • 9.5.5. South East Asia
        • 9.5.6. Rest of Asia Pacific

      10. Middle East & Africa Menopause App Market Analysis (USD Billion), Insights and Forecast, 2018-2029

      • 10.1. Key Findings / Summary
      • 10.2. Market Analysis, Insights and Forecast – By Segment 1
        • 10.2.1. Sub-Segment 1
        • 10.2.2. Sub-Segment 2
      • 10.3. Market Analysis, Insights and Forecast – By Segment 2
        • 10.3.1. Sub-Segment 1
        • 10.3.2. Sub-Segment 2
        • 10.3.3. Sub-Segment 3
        • 10.3.4. Others
      • 10.4. Market Analysis, Insights and Forecast – By Segment 3
        • 10.4.1. Sub-Segment 1
        • 10.4.2. Sub-Segment 2
        • 10.4.3. Sub-Segment 3
        • 10.4.4. Others
      • 10.5. Market Analysis, Insights and Forecast – By Country
        • 10.5.1. GCC
        • 10.5.2. South Africa
        • 10.5.3. Rest of Middle East & Africa

      11. Competitive Analysis

      • 11.1. Company Market Share Analysis, 2018
      • 11.2. Key Industry Developments
      • 11.3. Company Profile
        • 11.3.1. Company 1
          • 11.3.1.1. Business Overview
          • 11.3.1.2. Segment 1 & Service Offering
          • 11.3.1.3. Overall Revenue
          • 11.3.1.4. Geographic Presence
          • 11.3.1.5. Recent Development
        *Similar details will be provided for the following companies
        • 11.3.2. Company 2
        • 11.3.3. Company 3
        • 11.3.4. Company 4
        • 11.3.5. Company 5
        • 11.3.6. Company 6
        • 11.3.7. Company 7
        • 11.3.8. Company 8
        • 11.3.9. Company 9
        • 11.3.10. Company 10
        • 11.3.11. Company 11
        • 11.3.12. Company 12
      List of Figures

      Figure 1: Global Menopause App Market Revenue Breakdown (USD Billion, %) by Region, 2022 & 2029
      Figure 2: Global Menopause App Market Value Share (%), By Segment 1, 2022 & 2029
      Figure 3: Global Menopause App Market Forecast (USD Billion), by Sub-Segment 1, 2018-2029
      Figure 4: Global Menopause App Market Forecast (USD Billion), by Sub-Segment 2, 2018-2029
      Figure 5: Global Menopause App Market Value Share (%), By Segment 2, 2022 & 2029
      Figure 6: Global Menopause App Market Forecast (USD Billion), by Sub-Segment 1, 2018-2029
      Figure 7: Global Menopause App Market Forecast (USD Billion), by Sub-Segment 2, 2018-2029
      Figure 8: Global Menopause App Market Forecast (USD Billion), by Sub-Segment 3, 2018-2029
      Figure 9: Global Menopause App Market Forecast (USD Billion), by Others, 2018-2029
      Figure 10: Global Menopause App Market Value Share (%), By Segment 3, 2022 & 2029
      Figure 11: Global Menopause App Market Forecast (USD Billion), by Sub-Segment 1, 2018-2029
      Figure 12: Global Menopause App Market Forecast (USD Billion), by Sub-Segment 2, 2018-2029
      Figure 13: Global Menopause App Market Forecast (USD Billion), by Sub-Segment 3, 2018-2029
      Figure 14: Global Menopause App Market Forecast (USD Billion), by Others, 2018-2029
      Figure 15: Global Menopause App Market Value (USD Billion), by Region, 2022 & 2029
      Figure 16: North America Menopause App Market Value Share (%), By Segment 1, 2022 & 2029
      Figure 17: North America Menopause App Market Forecast (USD Billion), by Sub-Segment 1, 2018-2029
      Figure 18: North America Menopause App Market Forecast (USD Billion), by Sub-Segment 2, 2018-2029
      Figure 19: North America Menopause App Market Value Share (%), By Segment 2, 2022 & 2029
      Figure 20: North America Menopause App Market Forecast (USD Billion), by Sub-Segment 1, 2018-2029
      Figure 21: North America Menopause App Market Forecast (USD Billion), by Sub-Segment 2, 2018-2029
      Figure 22: North America Menopause App Market Forecast (USD Billion), by Sub-Segment 3, 2018-2029
      Figure 23: North America Menopause App Market Forecast (USD Billion), by Others, 2018-2029
      Figure 24: North America Menopause App Market Value Share (%), By Segment 3, 2022 & 2029
      Figure 25: North America Menopause App Market Forecast (USD Billion), by Sub-Segment 1, 2018-2029
      Figure 26: North America Menopause App Market Forecast (USD Billion), by Sub-Segment 2, 2018-2029
      Figure 27: North America Menopause App Market Forecast (USD Billion), by Sub-Segment 3, 2018-2029
      Figure 28: North America Menopause App Market Forecast (USD Billion), by Others, 2018-2029
      Figure 29: North America Menopause App Market Forecast (USD Billion), by U.S., 2018-2029
      Figure 30: North America Menopause App Market Forecast (USD Billion), by Canada, 2018-2029
      Figure 31: Latin America Menopause App Market Value Share (%), By Segment 1, 2022 & 2029
      Figure 32: Latin America Menopause App Market Forecast (USD Billion), by Sub-Segment 1, 2018-2029
      Figure 33: Latin America Menopause App Market Forecast (USD Billion), by Sub-Segment 2, 2018-2029
      Figure 34: Latin America Menopause App Market Value Share (%), By Segment 2, 2022 & 2029
      Figure 35: Latin America Menopause App Market Forecast (USD Billion), by Sub-Segment 1, 2018-2029
      Figure 36: Latin America Menopause App Market Forecast (USD Billion), by Sub-Segment 2, 2018-2029
      Figure 37: Latin America Menopause App Market Forecast (USD Billion), by Sub-Segment 3, 2018-2029
      Figure 38: Latin America Menopause App Market Forecast (USD Billion), by Others, 2018-2029
      Figure 39: Latin America Menopause App Market Value Share (%), By Segment 3, 2022 & 2029
      Figure 40: Latin America Menopause App Market Forecast (USD Billion), by Sub-Segment 1, 2018-2029
      Figure 41: Latin America Menopause App Market Forecast (USD Billion), by Sub-Segment 2, 2018-2029
      Figure 42: Latin America Menopause App Market Forecast (USD Billion), by Sub-Segment 3, 2018-2029
      Figure 43: Latin America Menopause App Market Forecast (USD Billion), by Others, 2018-2029
      Figure 44: Latin America Menopause App Market Forecast (USD Billion), by Brazil, 2018-2029
      Figure 45: Latin America Menopause App Market Forecast (USD Billion), by Mexico, 2018-2029
      Figure 46: Latin America Menopause App Market Forecast (USD Billion), by Rest of Latin America, 2018-2029
      Figure 47: Europe Menopause App Market Value Share (%), By Segment 1, 2022 & 2029
      Figure 48: Europe Menopause App Market Forecast (USD Billion), by Sub-Segment 1, 2018-2029
      Figure 49: Europe Menopause App Market Forecast (USD Billion), by Sub-Segment 2, 2018-2029
      Figure 50: Europe Menopause App Market Value Share (%), By Segment 2, 2022 & 2029
      Figure 51: Europe Menopause App Market Forecast (USD Billion), by Sub-Segment 1, 2018-2029
      Figure 52: Europe Menopause App Market Forecast (USD Billion), by Sub-Segment 2, 2018-2029
      Figure 53: Europe Menopause App Market Forecast (USD Billion), by Sub-Segment 3, 2018-2029
      Figure 54: Europe Menopause App Market Forecast (USD Billion), by Others, 2018-2029
      Figure 55: Europe Menopause App Market Value Share (%), By Segment 3, 2022 & 2029
      Figure 56: Europe Menopause App Market Forecast (USD Billion), by Sub-Segment 1, 2018-2029
      Figure 57: Europe Menopause App Market Forecast (USD Billion), by Sub-Segment 2, 2018-2029
      Figure 58: Europe Menopause App Market Forecast (USD Billion), by Sub-Segment 3, 2018-2029
      Figure 59: Europe Menopause App Market Forecast (USD Billion), by Others, 2018-2029
      Figure 60: Europe Menopause App Market Forecast (USD Billion), by U.K., 2018-2029
      Figure 61: Europe Menopause App Market Forecast (USD Billion), by Germany, 2018-2029
      Figure 62: Europe Menopause App Market Forecast (USD Billion), by France, 2018-2029
      Figure 63: Europe Menopause App Market Forecast (USD Billion), by Italy, 2018-2029
      Figure 64: Europe Menopause App Market Forecast (USD Billion), by Spain, 2018-2029
      Figure 65: Europe Menopause App Market Forecast (USD Billion), by Russia, 2018-2029
      Figure 66: Europe Menopause App Market Forecast (USD Billion), by Rest of Europe, 2018-2029
      Figure 67: Asia Pacific Menopause App Market Value Share (%), By Segment 1, 2022 & 2029
      Figure 68: Asia Pacific Menopause App Market Forecast (USD Billion), by Sub-Segment 1, 2018-2029
      Figure 69: Asia Pacific Menopause App Market Forecast (USD Billion), by Sub-Segment 2, 2018-2029
      Figure 70: Asia Pacific Menopause App Market Value Share (%), By Segment 2, 2022 & 2029
      Figure 71: Asia Pacific Menopause App Market Forecast (USD Billion), by Sub-Segment 1, 2018-2029
      Figure 72: Asia Pacific Menopause App Market Forecast (USD Billion), by Sub-Segment 2, 2018-2029
      Figure 73: Asia Pacific Menopause App Market Forecast (USD Billion), by Sub-Segment 3, 2018-2029
      Figure 74: Asia Pacific Menopause App Market Forecast (USD Billion), by Others, 2018-2029
      Figure 75: Asia Pacific Menopause App Market Value Share (%), By Segment 3, 2022 & 2029
      Figure 76: Asia Pacific Menopause App Market Forecast (USD Billion), by Sub-Segment 1, 2018-2029
      Figure 77: Asia Pacific Menopause App Market Forecast (USD Billion), by Sub-Segment 2, 2018-2029
      Figure 78: Asia Pacific Menopause App Market Forecast (USD Billion), by Sub-Segment 3, 2018-2029
      Figure 79: Asia Pacific Menopause App Market Forecast (USD Billion), by Others, 2018-2029
      Figure 80: Asia Pacific Menopause App Market Forecast (USD Billion), by China, 2018-2029
      Figure 81: Asia Pacific Menopause App Market Forecast (USD Billion), by India, 2018-2029
      Figure 82: Asia Pacific Menopause App Market Forecast (USD Billion), by Japan, 2018-2029
      Figure 83: Asia Pacific Menopause App Market Forecast (USD Billion), by Australia, 2018-2029
      Figure 84: Asia Pacific Menopause App Market Forecast (USD Billion), by Southeast Asia, 2018-2029
      Figure 85: Asia Pacific Menopause App Market Forecast (USD Billion), by Rest of Asia Pacific, 2018-2029
      Figure 86: Middle East & Africa Menopause App Market Value Share (%), By Segment 1, 2022 & 2029
      Figure 87: Middle East & Africa Menopause App Market Forecast (USD Billion), by Sub-Segment 1, 2018-2029
      Figure 88: Middle East & Africa Menopause App Market Forecast (USD Billion), by Sub-Segment 2, 2018-2029
      Figure 89: Middle East & Africa Menopause App Market Value Share (%), By Segment 2, 2022 & 2029
      Figure 90: Middle East & Africa Menopause App Market Forecast (USD Billion), by Sub-Segment 1, 2018-2029
      Figure 91: Middle East & Africa Menopause App Market Forecast (USD Billion), by Sub-Segment 2, 2018-2029
      Figure 92: Middle East & Africa Menopause App Market Forecast (USD Billion), by Sub-Segment 3, 2018-2029
      Figure 93: Middle East & Africa Menopause App Market Forecast (USD Billion), by Others, 2018-2029
      Figure 94: Middle East & Africa Menopause App Market Value Share (%), By Segment 3, 2022 & 2029
      Figure 95: Middle East & Africa Menopause App Market Forecast (USD Billion), by Sub-Segment 1, 2018-2029
      Figure 96: Middle East & Africa Menopause App Market Forecast (USD Billion), by Sub-Segment 2, 2018-2029
      Figure 97: Middle East & Africa Menopause App Market Forecast (USD Billion), by Sub-Segment 3, 2018-2029
      Figure 98: Middle East & Africa Menopause App Market Forecast (USD Billion), by Others, 2018-2029
      Figure 99: Middle East & Africa Menopause App Market Forecast (USD Billion), by GCC, 2018-2029
      Figure 100: Middle East & Africa Menopause App Market Forecast (USD Billion), by South Africa, 2018-2029
      Figure 101: Middle East & Africa Menopause App Market Forecast (USD Billion), by Rest of Middle East & Africa, 2018-2029 
      List of Tables
      Table 1: Global Menopause App Market Revenue (USD Billion) Forecast, by Segment 1, 2018-2029
      Table 2: Global Menopause App Market Revenue (USD Billion) Forecast, by Segment 2, 2018-2029
      Table 3: Global Menopause App Market Revenue (USD Billion) Forecast, by Segment 3, 2018-2029
      Table 4: Global Menopause App Market Revenue (USD Billion) Forecast, by Region, 2018-2029
      Table 5: North America Menopause App Market Revenue (USD Billion) Forecast, by Segment 1, 2018-2029
      Table 6: North America Menopause App Market Revenue (USD Billion) Forecast, by Segment 2, 2018-2029
      Table 7: North America Menopause App Market Revenue (USD Billion) Forecast, by Segment 3, 2018-2029
      Table 8: North America Menopause App Market Revenue (USD Billion) Forecast, by Country, 2018-2029
      Table 9: Europe Menopause App Market Revenue (USD Billion) Forecast, by Segment 1, 2018-2029
      Table 10: Europe Menopause App Market Revenue (USD Billion) Forecast, by Segment 2, 2018-2029
      Table 11: Europe Menopause App Market Revenue (USD Billion) Forecast, by Segment 3, 2018-2029
      Table 12: Europe Menopause App Market Revenue (USD Billion) Forecast, by Country, 2018-2029
      Table 13: Latin America Menopause App Market Revenue (USD Billion) Forecast, by Segment 1, 2018-2029
      Table 14: Latin America Menopause App Market Revenue (USD Billion) Forecast, by Segment 2, 2018-2029
      Table 15: Latin America Menopause App Market Revenue (USD Billion) Forecast, by Segment 3, 2018-2029
      Table 16: Latin America Menopause App Market Revenue (USD Billion) Forecast, by Country, 2018-2029
      Table 17: Asia Pacific Menopause App Market Revenue (USD Billion) Forecast, by Segment 1, 2018-2029
      Table 18: Asia Pacific Menopause App Market Revenue (USD Billion) Forecast, by Segment 2, 2018-2029
      Table 19: Asia Pacific Menopause App Market Revenue (USD Billion) Forecast, by Segment 3, 2018-2029
      Table 20: Asia Pacific Menopause App Market Revenue (USD Billion) Forecast, by Country, 2018-2029
      Table 21: Middle East & Africa Menopause App Market Revenue (USD Billion) Forecast, by Segment 1, 2018-2029
      Table 22: Middle East & Africa Menopause App Market Revenue (USD Billion) Forecast, by Segment 2, 2018-2029
      Table 23: Middle East & Africa Menopause App Market Revenue (USD Billion) Forecast, by Segment 3, 2018-2029
      Table 24: Middle East & Africa Menopause App Market Revenue (USD Billion) Forecast, by Country, 2018-2029
      Research Process

      Data Library Research are conducted by industry experts who offer insight on industry structure, market segmentations technology assessment and competitive landscape (CL), and penetration, as well as on emerging trends. Their analysis is based on primary interviews (~ 80%) and secondary research (~ 20%) as well as years of professional expertise in their respective industries. Adding to this, by analysing historical trends and current market positions, our analysts predict where the market will be headed for the next five years. Furthermore, the varying trends of segment & categories geographically presented are also studied and the estimated based on the primary & secondary research.

      In this particular report from the supply side Data Library Research has conducted primary surveys (interviews) with the key level executives (VP, CEO’s, Marketing Director, Business Development Manager and SOFT) of the companies that active & prominent as well as the midsized organization

      FIGURE 1: DLR RESEARH PROCESS

      research-methodology1

      Primary Research

      Extensive primary research was conducted to gain a deeper insight of the market and industry performance. The analysis is based on both primary and secondary research as well as years of professional expertise in the respective industries.

      In addition to analysing current and historical trends, our analysts predict where the market is headed over the next five years.

      It varies by segment for these categories geographically presented in the list of market tables. Speaking about this particular report we have conducted primary surveys (interviews) with the key level executives (VP, CEO’s, Marketing Director, Business Development Manager and many more) of the major players active in the market.

      Secondary Research

      Secondary research was mainly used to collect and identify information useful for the extensive, technical, market-oriented, and Friend’s study of the Global Extra Neutral Alcohol. It was also used to obtain key information about major players, market classification and segmentation according to the industry trends, geographical markets, and developments related to the market and technology perspectives. For this study, analysts have gathered information from various credible sources, such as annual reports, sec filings, journals, white papers, SOFT presentations, and company web sites.

      Market Size Estimation

      Both, top-down and bottom-up approaches were used to estimate and validate the size of the Global market and to estimate the size of various other dependent submarkets in the overall Extra Neutral Alcohol. The key players in the market were identified through secondary research and their market contributions in the respective geographies were determined through primary and secondary research.

      Forecast Model

      research-methodology2

      Happy to Assist You

      If you have a question?

      info@datalibraryresearch.com

      IND : +91 955 279 0357

      Browse Related Reports