Methanol-powered Ships Market Overview and Analysis
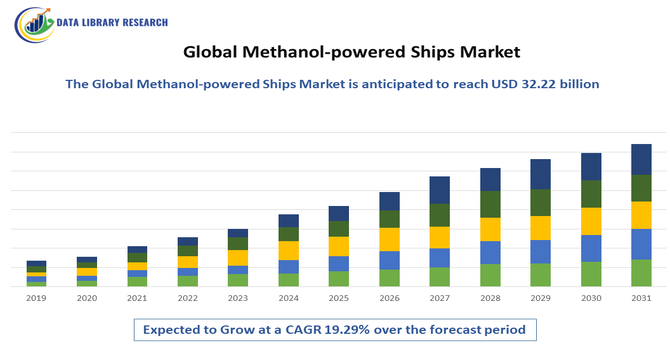
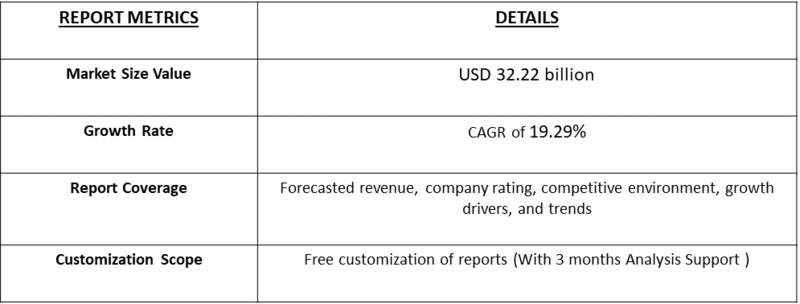
- The Global Methanol-Powered Ships Market is projected to grow from USD 5.09 billion in 2025 to USD 16.98 billion by 2032, at a CAGR of 19.29% from 2025-2032, reaching USD 32.22 billion by 2035.
Get Complete Analysis Of The Report - Download Updated Free Sample PDF
The Global Methanol-Powered Ships Market is experiencing strong momentum, driven primarily by accelerating decarbonization initiatives in the maritime industry and stringent emission regulations imposed by the International Maritime Organization (IMO).
Growing pressure to reduce greenhouse gas emissions, sulfur oxide (SOx), nitrogen oxide (NOx), and particulate matter is pushing shipping companies towards cleaner alternative fuels, with methanol gaining traction due to its lower emissions profile and compatibility with existing fuel infrastructure through dual-fuel engine retrofits. Increased investment from global shipping giants, rising methanol bunkering infrastructure development, and expanding green methanol production capacity—supported by renewable energy projects—are further propelling market growth.
Methanol-powered Ships Market Latest Trends
The maritime industry is increasingly embracing methanol as a ship fuel as it moves from pilot projects to early commercial scale—driven by more than 60 methanol-capable vessels in operation and about 300 additional ones on order. Dual-fuel engines (methanol + conventional) are becoming mainstream, allowing shipowners to transition more smoothly without full commitment to new fuel infrastructure. Major vessel builders and shipping companies are ordering methanol-ready newbuilds, signaling a shift toward methanol-fuel fleets for container ships, tankers, and bulk carriers. At the same time, bunkering and fuel-supply infrastructure is catching up: ports such as Singapore are setting targets for over one million tons of low-carbon methanol bunkers by 2030.
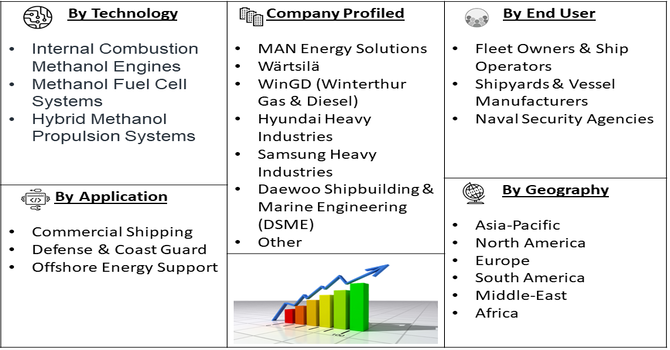
Segmentation: Global Methanol-powered Ships Market is segmented By Vessel Type (Container Ships, Bulk Carriers, Tankers, Ferries & Passenger Ships, Offshore Support Vessels), Fuel Type (Grey Methanol-Powered Ships, Blue Methanol-Powered Ships, Green Methanol-Powered Ships), Engine Type (Dual-Fuel Methanol Engines, Pure Methanol Engines, Methanol-Ready Engines), Technology (Internal Combustion Methanol Engines, Methanol Fuel Cell Systems, Hybrid Methanol Propulsion Systems), Application (Commercial Shipping, Defense & Coast Guard, Offshore Energy Support), By End User (Fleet Owners & Ship Operators, Shipyards & Vessel Manufacturers, Naval Security Agencies), and Geography (North America, Europe, Asia-Pacific, Middle East and Africa, and South America). The report provides the value (in USD million) for the above segments.
For Detailed Market Segmentation - Get a Free Sample PDF
Market Drivers:
- Increasing Global Maritime Decarbonization Mandates and Green Fuel Shift
The transition toward low-emission marine fuels is a major driver, as shipping operators face accelerating regulatory pressures from the International Maritime Organization (IMO), regional governments, and port authorities to reduce sulfur oxides (SOx), nitrogen oxides (NOx), and CO₂ emissions. Methanol is gaining momentum as a preferred clean fuel due to its lower emissions, ease of storage and handling compared to LNG or hydrogen, and compatibility with modified internal combustion engines. Growing commitments to net-zero shipping, along with carbon taxation and emission trading policies in the EU and other regions, are compelling vessel owners to adopt methanol as a scalable pathway toward sustainable maritime operations.
- Rapid Fleet Modernization and Increasing Shipbuilding Investments in Alternative Fuel Vessels
Significant investments in methanol-ready shipbuilding and engine technology by major shipping companies and shipyards are accelerating market growth. Global leaders such as Maersk, CMA CGM, COSCO, and MSC are placing large orders for methanol-powered vessels to future-proof fleets and reduce fuel switching barriers. Advancements in dual-fuel engines, onboard fuel conversion technologies, and expanding methanol bunkering infrastructure at key international ports are also supporting rapid adoption. The rising cost of traditional marine fuels, combined with long-term operational savings and greater fuel flexibility, further encourages fleet operators to shift toward methanol as a commercially viable and environmentally compliant solution.
Market Restraints
- Limited Global Methanol Bunkering Infrastructure
One of the primary challenges is the limited global methanol bunkering infrastructure, as only a few major ports currently support methanol refueling, creating logistical barriers for long-distance maritime operations. Additionally, high initial investment costs associated with retrofitting existing vessels or building methanol-ready ships, combined with the premium pricing of green methanol compared to conventional fuels, pose financial hurdles for shipowners. Fuel availability constraints, along with uncertainties around long-term methanol supply sustainability and scalability, particularly for renewable (green) methanol, further impact decision-making. Moreover, safety concerns related to methanol’s toxicity and flammability necessitate specialized handling systems and regulatory compliance, increasing operational complexity.
Socio Economic Impact on Methanol-powered Ships Market
The Global Methanol Bunkering Infrastructure has generated significant socioeconomic impacts by driving the maritime industry’s transition toward cleaner, more sustainable fuels. As ports and shipping companies invest in methanol-compatible storage, refueling, and distribution systems, the sector creates new employment opportunities, stimulates technological innovation, and attracts foreign investment in port modernization. Economically, methanol bunkering supports energy diversification and reduces reliance on conventional marine fuels, enhancing long-term cost efficiency and environmental compliance. Socially, it contributes to reduced emissions, improved air quality in port cities, and overall public health benefits.
Segmental Analysis
- Dual-Fuel Methanol Engines segment is expected to witness highest growth over the forecast period
Dual-fuel methanol engines dominate the market as they provide flexibility to operate on both methanol and conventional marine fuels. This reduces transition risk for shipowners, supports gradual fleet conversion, and ensures uninterrupted operations despite limited global methanol bunkering infrastructure.
Moreover, the market is driven by stringent environmental regulations and the growing focus on decarbonization, encouraging shipping companies to adopt low-emission alternatives. Investments in methanol bunkering infrastructure across major Asia-Pacific ports, coupled with supportive government policies and incentives, have further facilitated adoption. Additionally, partnerships between shipbuilders, fuel suppliers, and operators are accelerating the deployment of methanol-powered vessels, strengthening the region’s leadership in sustainable maritime transport.
- Internal Combustion Methanol Engines segment is expected to witness highest growth over the forecast period
Internal combustion methanol engines hold the largest share currently due to maturity, cost-efficiency, and ease of integration into existing ship systems. Their compatibility with commercial vessel types and strong manufacturing capability from leading marine engine makers accelerate widespread adoption.
In addition, rising green shipping initiatives and stricter emission regulations in the Asia-Pacific region have bolstered demand for methanol-powered vessels. Increasing collaborations between ports, fuel suppliers, and shipping companies to expand methanol bunkering infrastructure further support market growth. Technological advancements in engine efficiency and safety, alongside government incentives for low-emission fuels, have positioned methanol as a viable alternative, driving accelerated adoption across commercial and cargo fleets.
- Fleet Owners & Ship Operators segment is expected to witness highest growth over the forecast period
Fleet owners & ship operators represent the largest end-user group, driving investments in methanol-powered vessels to comply with global environmental policies and gain competitive sustainability advantages. Increased procurement programs from major maritime companies are accelerating market traction.
- Asia-Pacific region is expected to witness highest growth over the forecast period
The Methanol-Powered Ships Market in Asia-Pacific has experienced significant growth, driven by multiple factors. Stricter environmental regulations, including IMO’s decarbonization targets and regional emission control mandates, have prompted shipping companies to adopt low-carbon alternative fuels like methanol. The region’s rapidly expanding maritime trade, coupled with rising shipbuilding activities in countries such as China, South Korea, and Japan, has accelerated the demand for methanol-ready vessels. Investments in methanol bunkering infrastructure at major ports have enhanced fuel accessibility, further supporting adoption.
Additionally, government incentives and industry collaborations promoting clean energy solutions have encouraged shipping operators to integrate methanol propulsion systems, making the Asia-Pacific a leading hub for sustainable shipping and contributing to the global transition toward low-emission maritime transport. In June 2023, A.P. Moller - Maersk secured green methanol from OCI Global for the maiden voyage of the world’s first methanol-enabled container vessel, sailing 21,500 km from Ulsan, South Korea to Copenhagen, Denmark. This milestone demonstrated operational viability, advanced crew experience with methanol engines, and reinforced Asia-Pacific growth in the Methanol-Powered Ships Market through increased adoption and green fuel accessibility. Thus, all such factors are expected to drive the growth of above market in this region.
To Learn More About This Report - Request a Free Sample Copy
Methanol-powered Ships Market Competitive Landscape
The competitive landscape blends engine manufacturers, shipbuilders, shipping lines placing methanol-ready orders, and methanol producers/suppliers — all competing to scale methanol propulsion, bunkering, and green-methanol supply chains.
Key Players:
- MAN Energy Solutions
- Wärtsilä
- WinGD (Winterthur Gas & Diesel)
- Hyundai Heavy Industries
- Samsung Heavy Industries
- Daewoo Shipbuilding & Marine Engineering (DSME)
- China State Shipbuilding Corporation (CSSC)
- A.P. Moller-Maersk
- CMA CGM
- Stena Bulk
- NYK Line (Nippon Yusen Kabushiki Kaisha)
- Mitsui O.S.K. Lines (MOL)
- COSCO Shipping
- Evergreen Marine
- Methanex
- Proman
- OCI Global
- BP
- GoodFuels
- Linde (maritime fuel solutions)
Recent Development
- In September 2025, The Green Future, a methanol dual-fuel bulk carrier chartered by NYK Bulk & Projects Carriers Ltd. from Kambara Kisen Co., Ltd., received methanol bunkers via a ship-to-ship transfer at Ulsan Port, South Korea. The operation utilized a dedicated bunkering vessel to supply low-carbon methanol fuel, marking a significant step in advancing sustainable maritime fuel adoption.
- In December 2024, Wärtsilä secured an order in Q4 2024 to supply a propulsion package for a 38,000 DWT methanol-ready cement carrier, the world’s largest of its type, being built by Zhejiang Xinle Shipbuilding for NovaAlgoma. This strengthened the Global Methanol-Powered Ships Market by boosting demand for alternative-fuel vessels and supporting maritime decarbonization.
Frequently Asked Questions (FAQ) :
Q1. What are the main growth driving factors for this market?
The main driver is the maritime industry's urgent need for decarbonization to comply with stringent environmental regulations from the International Maritime Organization (IMO). Methanol is seen as a lower-emission fuel alternative, especially in its 'green' (renewable) form, which appeals to shipping companies focused on sustainability (ESG commitments). Technological progress, particularly in reliable dual-fuel engines, offers operational flexibility and accelerates adoption.
Q2. What are the main restraining factors for this market?
Major obstacles include the limited global availability of green methanol (produced from renewable sources) and the high cost associated with its production compared to conventional fuels. Insufficient and developing bunkering (refueling) infrastructure at major ports worldwide also slows adoption. Finally, the initial higher capital investment required for methanol-capable engines and new vessel designs presents a financial barrier for shipowners.
Q3. Which segment is expected to witness high growth?
The Dual-Fuel Engine Technology segment is expected to witness the highest growth. This is due to its operational flexibility, allowing vessels to switch between methanol and traditional fuels, mitigating immediate supply risks. By vessel type, Container Vessels are a leading segment due to major shipping lines (like Maersk) heavily investing in methanol-powered newbuilds to meet their ambitious corporate net-zero targets and drive the shift towards cleaner long-haul shipping.
Q4. Who are the top major players for this market?
The market is led by major shipbuilders and engine manufacturers from Asia. Key players include HD Hyundai Heavy Industries and Samsung Heavy Industries (South Korea), along with Chinese shipbuilders like COSCO Shipping Industries. Large maritime engine producers like MAN Energy Solutions are also crucial. Major shipping lines such as Maersk and CMA CGM are significant players due to their large orders of methanol-powered vessels.
Q5. Which country is the largest player?
Asia Pacific, as a region, is the largest market player, driven by its dominance in global shipbuilding. China and South Korea are the biggest contributors, with their shipyards being the primary builders of methanol-powered vessels. However, Europe is a leading region for adoption and demand, with key shipping companies (like those based in Denmark and Switzerland) aggressively placing orders to meet strict European Union (EU) emissions standards.
List of Figures
Figure 1: Global Methanol-powered Ships Market Revenue Breakdown (USD Billion, %) by Region, 2022 & 2029
Figure 2: Global Methanol-powered Ships Market Value Share (%), By Segment 1, 2022 & 2029
Figure 3: Global Methanol-powered Ships Market Forecast (USD Billion), by Sub-Segment 1, 2018-2029
Figure 4: Global Methanol-powered Ships Market Forecast (USD Billion), by Sub-Segment 2, 2018-2029
Figure 5: Global Methanol-powered Ships Market Value Share (%), By Segment 2, 2022 & 2029
Figure 6: Global Methanol-powered Ships Market Forecast (USD Billion), by Sub-Segment 1, 2018-2029
Figure 7: Global Methanol-powered Ships Market Forecast (USD Billion), by Sub-Segment 2, 2018-2029
Figure 8: Global Methanol-powered Ships Market Forecast (USD Billion), by Sub-Segment 3, 2018-2029
Figure 9: Global Methanol-powered Ships Market Forecast (USD Billion), by Others, 2018-2029
Figure 10: Global Methanol-powered Ships Market Value Share (%), By Segment 3, 2022 & 2029
Figure 11: Global Methanol-powered Ships Market Forecast (USD Billion), by Sub-Segment 1, 2018-2029
Figure 12: Global Methanol-powered Ships Market Forecast (USD Billion), by Sub-Segment 2, 2018-2029
Figure 13: Global Methanol-powered Ships Market Forecast (USD Billion), by Sub-Segment 3, 2018-2029
Figure 14: Global Methanol-powered Ships Market Forecast (USD Billion), by Others, 2018-2029
Figure 15: Global Methanol-powered Ships Market Value (USD Billion), by Region, 2022 & 2029
Figure 16: North America Methanol-powered Ships Market Value Share (%), By Segment 1, 2022 & 2029
Figure 17: North America Methanol-powered Ships Market Forecast (USD Billion), by Sub-Segment 1, 2018-2029
Figure 18: North America Methanol-powered Ships Market Forecast (USD Billion), by Sub-Segment 2, 2018-2029
Figure 19: North America Methanol-powered Ships Market Value Share (%), By Segment 2, 2022 & 2029
Figure 20: North America Methanol-powered Ships Market Forecast (USD Billion), by Sub-Segment 1, 2018-2029
Figure 21: North America Methanol-powered Ships Market Forecast (USD Billion), by Sub-Segment 2, 2018-2029
Figure 22: North America Methanol-powered Ships Market Forecast (USD Billion), by Sub-Segment 3, 2018-2029
Figure 23: North America Methanol-powered Ships Market Forecast (USD Billion), by Others, 2018-2029
Figure 24: North America Methanol-powered Ships Market Value Share (%), By Segment 3, 2022 & 2029
Figure 25: North America Methanol-powered Ships Market Forecast (USD Billion), by Sub-Segment 1, 2018-2029
Figure 26: North America Methanol-powered Ships Market Forecast (USD Billion), by Sub-Segment 2, 2018-2029
Figure 27: North America Methanol-powered Ships Market Forecast (USD Billion), by Sub-Segment 3, 2018-2029
Figure 28: North America Methanol-powered Ships Market Forecast (USD Billion), by Others, 2018-2029
Figure 29: North America Methanol-powered Ships Market Forecast (USD Billion), by U.S., 2018-2029
Figure 30: North America Methanol-powered Ships Market Forecast (USD Billion), by Canada, 2018-2029
Figure 31: Latin America Methanol-powered Ships Market Value Share (%), By Segment 1, 2022 & 2029
Figure 32: Latin America Methanol-powered Ships Market Forecast (USD Billion), by Sub-Segment 1, 2018-2029
Figure 33: Latin America Methanol-powered Ships Market Forecast (USD Billion), by Sub-Segment 2, 2018-2029
Figure 34: Latin America Methanol-powered Ships Market Value Share (%), By Segment 2, 2022 & 2029
Figure 35: Latin America Methanol-powered Ships Market Forecast (USD Billion), by Sub-Segment 1, 2018-2029
Figure 36: Latin America Methanol-powered Ships Market Forecast (USD Billion), by Sub-Segment 2, 2018-2029
Figure 37: Latin America Methanol-powered Ships Market Forecast (USD Billion), by Sub-Segment 3, 2018-2029
Figure 38: Latin America Methanol-powered Ships Market Forecast (USD Billion), by Others, 2018-2029
Figure 39: Latin America Methanol-powered Ships Market Value Share (%), By Segment 3, 2022 & 2029
Figure 40: Latin America Methanol-powered Ships Market Forecast (USD Billion), by Sub-Segment 1, 2018-2029
Figure 41: Latin America Methanol-powered Ships Market Forecast (USD Billion), by Sub-Segment 2, 2018-2029
Figure 42: Latin America Methanol-powered Ships Market Forecast (USD Billion), by Sub-Segment 3, 2018-2029
Figure 43: Latin America Methanol-powered Ships Market Forecast (USD Billion), by Others, 2018-2029
Figure 44: Latin America Methanol-powered Ships Market Forecast (USD Billion), by Brazil, 2018-2029
Figure 45: Latin America Methanol-powered Ships Market Forecast (USD Billion), by Mexico, 2018-2029
Figure 46: Latin America Methanol-powered Ships Market Forecast (USD Billion), by Rest of Latin America, 2018-2029
Figure 47: Europe Methanol-powered Ships Market Value Share (%), By Segment 1, 2022 & 2029
Figure 48: Europe Methanol-powered Ships Market Forecast (USD Billion), by Sub-Segment 1, 2018-2029
Figure 49: Europe Methanol-powered Ships Market Forecast (USD Billion), by Sub-Segment 2, 2018-2029
Figure 50: Europe Methanol-powered Ships Market Value Share (%), By Segment 2, 2022 & 2029
Figure 51: Europe Methanol-powered Ships Market Forecast (USD Billion), by Sub-Segment 1, 2018-2029
Figure 52: Europe Methanol-powered Ships Market Forecast (USD Billion), by Sub-Segment 2, 2018-2029
Figure 53: Europe Methanol-powered Ships Market Forecast (USD Billion), by Sub-Segment 3, 2018-2029
Figure 54: Europe Methanol-powered Ships Market Forecast (USD Billion), by Others, 2018-2029
Figure 55: Europe Methanol-powered Ships Market Value Share (%), By Segment 3, 2022 & 2029
Figure 56: Europe Methanol-powered Ships Market Forecast (USD Billion), by Sub-Segment 1, 2018-2029
Figure 57: Europe Methanol-powered Ships Market Forecast (USD Billion), by Sub-Segment 2, 2018-2029
Figure 58: Europe Methanol-powered Ships Market Forecast (USD Billion), by Sub-Segment 3, 2018-2029
Figure 59: Europe Methanol-powered Ships Market Forecast (USD Billion), by Others, 2018-2029
Figure 60: Europe Methanol-powered Ships Market Forecast (USD Billion), by U.K., 2018-2029
Figure 61: Europe Methanol-powered Ships Market Forecast (USD Billion), by Germany, 2018-2029
Figure 62: Europe Methanol-powered Ships Market Forecast (USD Billion), by France, 2018-2029
Figure 63: Europe Methanol-powered Ships Market Forecast (USD Billion), by Italy, 2018-2029
Figure 64: Europe Methanol-powered Ships Market Forecast (USD Billion), by Spain, 2018-2029
Figure 65: Europe Methanol-powered Ships Market Forecast (USD Billion), by Russia, 2018-2029
Figure 66: Europe Methanol-powered Ships Market Forecast (USD Billion), by Rest of Europe, 2018-2029
Figure 67: Asia Pacific Methanol-powered Ships Market Value Share (%), By Segment 1, 2022 & 2029
Figure 68: Asia Pacific Methanol-powered Ships Market Forecast (USD Billion), by Sub-Segment 1, 2018-2029
Figure 69: Asia Pacific Methanol-powered Ships Market Forecast (USD Billion), by Sub-Segment 2, 2018-2029
Figure 70: Asia Pacific Methanol-powered Ships Market Value Share (%), By Segment 2, 2022 & 2029
Figure 71: Asia Pacific Methanol-powered Ships Market Forecast (USD Billion), by Sub-Segment 1, 2018-2029
Figure 72: Asia Pacific Methanol-powered Ships Market Forecast (USD Billion), by Sub-Segment 2, 2018-2029
Figure 73: Asia Pacific Methanol-powered Ships Market Forecast (USD Billion), by Sub-Segment 3, 2018-2029
Figure 74: Asia Pacific Methanol-powered Ships Market Forecast (USD Billion), by Others, 2018-2029
Figure 75: Asia Pacific Methanol-powered Ships Market Value Share (%), By Segment 3, 2022 & 2029
Figure 76: Asia Pacific Methanol-powered Ships Market Forecast (USD Billion), by Sub-Segment 1, 2018-2029
Figure 77: Asia Pacific Methanol-powered Ships Market Forecast (USD Billion), by Sub-Segment 2, 2018-2029
Figure 78: Asia Pacific Methanol-powered Ships Market Forecast (USD Billion), by Sub-Segment 3, 2018-2029
Figure 79: Asia Pacific Methanol-powered Ships Market Forecast (USD Billion), by Others, 2018-2029
Figure 80: Asia Pacific Methanol-powered Ships Market Forecast (USD Billion), by China, 2018-2029
Figure 81: Asia Pacific Methanol-powered Ships Market Forecast (USD Billion), by India, 2018-2029
Figure 82: Asia Pacific Methanol-powered Ships Market Forecast (USD Billion), by Japan, 2018-2029
Figure 83: Asia Pacific Methanol-powered Ships Market Forecast (USD Billion), by Australia, 2018-2029
Figure 84: Asia Pacific Methanol-powered Ships Market Forecast (USD Billion), by Southeast Asia, 2018-2029
Figure 85: Asia Pacific Methanol-powered Ships Market Forecast (USD Billion), by Rest of Asia Pacific, 2018-2029
Figure 86: Middle East & Africa Methanol-powered Ships Market Value Share (%), By Segment 1, 2022 & 2029
Figure 87: Middle East & Africa Methanol-powered Ships Market Forecast (USD Billion), by Sub-Segment 1, 2018-2029
Figure 88: Middle East & Africa Methanol-powered Ships Market Forecast (USD Billion), by Sub-Segment 2, 2018-2029
Figure 89: Middle East & Africa Methanol-powered Ships Market Value Share (%), By Segment 2, 2022 & 2029
Figure 90: Middle East & Africa Methanol-powered Ships Market Forecast (USD Billion), by Sub-Segment 1, 2018-2029
Figure 91: Middle East & Africa Methanol-powered Ships Market Forecast (USD Billion), by Sub-Segment 2, 2018-2029
Figure 92: Middle East & Africa Methanol-powered Ships Market Forecast (USD Billion), by Sub-Segment 3, 2018-2029
Figure 93: Middle East & Africa Methanol-powered Ships Market Forecast (USD Billion), by Others, 2018-2029
Figure 94: Middle East & Africa Methanol-powered Ships Market Value Share (%), By Segment 3, 2022 & 2029
Figure 95: Middle East & Africa Methanol-powered Ships Market Forecast (USD Billion), by Sub-Segment 1, 2018-2029
Figure 96: Middle East & Africa Methanol-powered Ships Market Forecast (USD Billion), by Sub-Segment 2, 2018-2029
Figure 97: Middle East & Africa Methanol-powered Ships Market Forecast (USD Billion), by Sub-Segment 3, 2018-2029
Figure 98: Middle East & Africa Methanol-powered Ships Market Forecast (USD Billion), by Others, 2018-2029
Figure 99: Middle East & Africa Methanol-powered Ships Market Forecast (USD Billion), by GCC, 2018-2029
Figure 100: Middle East & Africa Methanol-powered Ships Market Forecast (USD Billion), by South Africa, 2018-2029
Figure 101: Middle East & Africa Methanol-powered Ships Market Forecast (USD Billion), by Rest of Middle East & Africa, 2018-2029
List of Tables
Table 1: Global Methanol-powered Ships Market Revenue (USD Billion) Forecast, by Segment 1, 2018-2029
Table 2: Global Methanol-powered Ships Market Revenue (USD Billion) Forecast, by Segment 2, 2018-2029
Table 3: Global Methanol-powered Ships Market Revenue (USD Billion) Forecast, by Segment 3, 2018-2029
Table 4: Global Methanol-powered Ships Market Revenue (USD Billion) Forecast, by Region, 2018-2029
Table 5: North America Methanol-powered Ships Market Revenue (USD Billion) Forecast, by Segment 1, 2018-2029
Table 6: North America Methanol-powered Ships Market Revenue (USD Billion) Forecast, by Segment 2, 2018-2029
Table 7: North America Methanol-powered Ships Market Revenue (USD Billion) Forecast, by Segment 3, 2018-2029
Table 8: North America Methanol-powered Ships Market Revenue (USD Billion) Forecast, by Country, 2018-2029
Table 9: Europe Methanol-powered Ships Market Revenue (USD Billion) Forecast, by Segment 1, 2018-2029
Table 10: Europe Methanol-powered Ships Market Revenue (USD Billion) Forecast, by Segment 2, 2018-2029
Table 11: Europe Methanol-powered Ships Market Revenue (USD Billion) Forecast, by Segment 3, 2018-2029
Table 12: Europe Methanol-powered Ships Market Revenue (USD Billion) Forecast, by Country, 2018-2029
Table 13: Latin America Methanol-powered Ships Market Revenue (USD Billion) Forecast, by Segment 1, 2018-2029
Table 14: Latin America Methanol-powered Ships Market Revenue (USD Billion) Forecast, by Segment 2, 2018-2029
Table 15: Latin America Methanol-powered Ships Market Revenue (USD Billion) Forecast, by Segment 3, 2018-2029
Table 16: Latin America Methanol-powered Ships Market Revenue (USD Billion) Forecast, by Country, 2018-2029
Table 17: Asia Pacific Methanol-powered Ships Market Revenue (USD Billion) Forecast, by Segment 1, 2018-2029
Table 18: Asia Pacific Methanol-powered Ships Market Revenue (USD Billion) Forecast, by Segment 2, 2018-2029
Table 19: Asia Pacific Methanol-powered Ships Market Revenue (USD Billion) Forecast, by Segment 3, 2018-2029
Table 20: Asia Pacific Methanol-powered Ships Market Revenue (USD Billion) Forecast, by Country, 2018-2029
Table 21: Middle East & Africa Methanol-powered Ships Market Revenue (USD Billion) Forecast, by Segment 1, 2018-2029
Table 22: Middle East & Africa Methanol-powered Ships Market Revenue (USD Billion) Forecast, by Segment 2, 2018-2029
Table 23: Middle East & Africa Methanol-powered Ships Market Revenue (USD Billion) Forecast, by Segment 3, 2018-2029
Table 24: Middle East & Africa Methanol-powered Ships Market Revenue (USD Billion) Forecast, by Country, 2018-2029
Research Process
Data Library Research are conducted by industry experts who offer insight on
industry structure, market segmentations technology assessment and competitive landscape (CL), and penetration, as well as on emerging trends. Their analysis is based on primary interviews (~ 80%) and secondary research (~ 20%) as well as years of professional expertise in their respective industries. Adding to this, by analysing historical trends and current market positions, our analysts predict where the market will be headed for the next five years. Furthermore, the varying trends of segment & categories geographically presented are also studied and the estimated based on the primary & secondary research.
In this particular report from the supply side Data Library Research has conducted primary surveys (interviews) with the key level executives (VP, CEO’s, Marketing Director, Business Development Manager
and SOFT) of the companies that active & prominent as well as the midsized organization
FIGURE 1: DLR RESEARH PROCESS
![research-methodology1]()
Primary Research
Extensive primary research was conducted to gain a deeper insight of the market and industry performance. The analysis is based on both primary and secondary research as well as years of professional expertise in the respective industries.
In addition to analysing current and historical trends, our analysts predict where the market is headed over the next five years.
It varies by segment for these categories geographically presented in the list of market tables. Speaking about this particular report we have conducted primary surveys (interviews) with the key level executives (VP, CEO’s, Marketing Director, Business Development Manager and many more) of the major players active in the market.
Secondary Research
Secondary research was mainly used to collect and identify information useful for the extensive, technical, market-oriented, and Friend’s study of the Global Extra Neutral Alcohol. It was also used to obtain key information about major players, market classification and segmentation according to the industry trends, geographical markets, and developments related to the market and technology perspectives. For this study, analysts have gathered information from various credible sources, such as annual reports, sec filings, journals, white papers, SOFT presentations, and company web sites.
Market Size Estimation
Both, top-down and bottom-up approaches were used to estimate and validate the size of the Global market and to estimate the size of various other dependent submarkets in the overall Extra Neutral Alcohol. The key players in the market were identified through secondary research and their market contributions in the respective geographies were determined through primary and secondary research.
Forecast Model
![research-methodology2]()