Global 
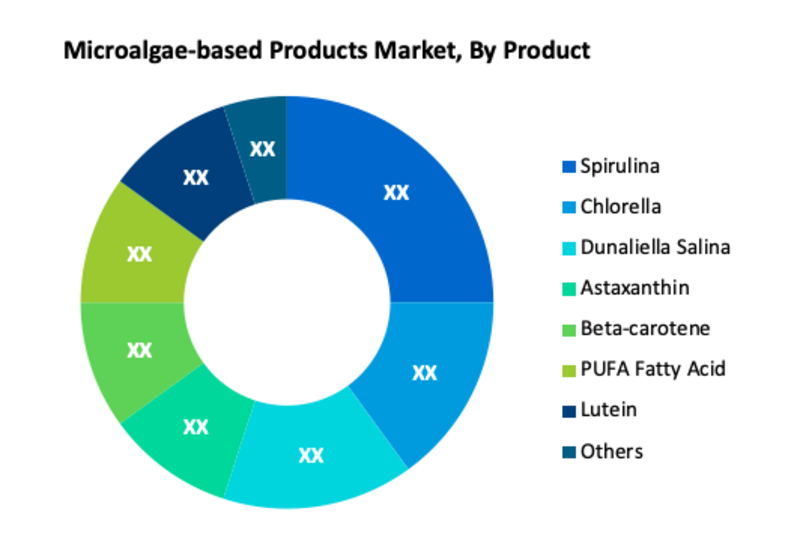
Microalgae-based Products Market, By Product (Spirulina, Chlorella, Dunaliella Salina, Astaxanthin, Beta-carotene, PUFA Fatty Acid, Lutein, Others) By Application (Food & Beverages, Personal Care, Nutraceuticals & Dietary Supplements, Pharmaceuticals, Chemicals, Fuel, Animal Feed, Others), and opportunities and forecast 2023-2030
Microalgae-based Products Market Overview
Microalgae are minute unicellular algae that live in sediments and water columns in both marine and freshwater settings. Microalgae-based products are employed in a variety of biotechnological applications, including wastewater bioremediation, biodiesel generation, and human and animal nutrition dietary supplements. Food and beverage, personal care goods, pharmaceuticals, nutraceuticals, and dietary supplements, chemicals, fuel, and animal feed all use microalgae-based products. The global Microalgae-based Products market is projected to grow at a significant rate in the forthcoming years.
Currently, microalgae-based products are widely used in the manufacture of food supplements and nutraceuticals. The global Microalgae-based Products market is being driven by a growth in consumer knowledge about nutrition and health, as well as a preference for natural alternatives to standard pharmaceutical products.
Another key factor driving the global Microalgae-based Products market is the increased use of high-value compounds in microalgae, such as fatty acids and pigments, in the manufacturing of dietary supplements. Furthermore, manufacturers and public research institutes are increasing their attention on R&D efforts in order to accelerate technological breakthroughs, and new technologies for product development are also projected to boost the market over the forecast period.
Report Metric
Details
Market size available for years
2019–2027
Base year considered
2019
Forecast period
2020–2027
Forecast unit
Value (USD Million)
Segments covered
Product, Application, and Region
Regions covered
North America (the U.S. and Canada), Europe (UK, Germany, France, Italy, Spain, Russia, Rest of Europe), Asia-Pacific (China, India, Japan, Australia, South East Asia, Rest of Asia Pacific), Latin America and the Middle East and Africa (Brazil, Saudi Arabia, UAE, Rest of LAMEA)
Companies covered
EID Parry Ltd., euglena Co, Ltd, Cyanotech Corporation, AstaReal Group, BlueTech International GmbH., Far East Bio-Tec Co., Ltd, Cellana Inc., Ocean Nutrition, Algae Health Sciences - A BGG Company, Earthrise Nutritional, NOW, Necton, Algae International Berhad (AIB), Proalgen Biotech Ltd.
Covid-19 Impact on Microalgae-based Products Market
The ongoing COVID-19 pandemic conditions have severely affected every sector around the world. Whereas, the chemicals and materials sectors were moderately affected during the pandemic. This is primarily due to the uncut demand for chemicals for healthcare, life science, and cleaning agents. However, other elements of chemical and material sectors such as paints, industrial oil, construction materials are facing diminution in demand. Strict lockdown resulted in a nearly 50-60% reduction in supply for raw materials, which directly affected the manufacturing process. Further, halt on many end-use industries directly affected the chemical demand all around the world.
Microalgae-based Products Market Segment Overview
According to Product, the Spirulina segment dominated the global microalgae-based products market in 2020. Spirulina is a protein supplement as well as a health food. As a result, it has acquired appeal in the human nutraceutical business in a variety of developing and undeveloped nations, such as Asia and Africa, where malnutrition is common. Spirulina demand is expected to be high in the near future, thanks to increased consumer knowledge of the health advantages of spirulina-based food products and the vast range of natural colours created by spirulina. The governments of India and South Africa are supporting spirulina production because of its health benefits.
Region-Wise, Europe contributed to the maximum share in the global microalgae-based products market. The presence of a strong industrial base with important manufacturers of medicines and nutraceuticals, as well as packaged food and drinks, is principally responsible for the region's supremacy in the microalgae-based product's market. Microalgae-based products are in high demand in Europe, with applications ranging from food and drinks to animal feed, pharmaceuticals and nutraceuticals, personal care, chemicals, and biofuels. Rising investment in cultivation technologies, combined with a growing emphasis on sustainable solutions, presents lucrative opportunities for the region's microalgae-based products market to grow. Moreover, the market in the Asia Pacific is expected to grow at higher rate in the coming years. North America is also major region for the market.
Microalgae-based Products Market, By Geography
· North America (US & Canada) · Europe (UK, Germany, France, Italy, Spain, Russia & Rest of Europe) · Asia-Pacific (Japan, China, India, Australia, & South Korea, & Rest of Asia-Pacific) · LAMEA (Brazil, Saudi Arabia, UAE & Rest of LAMEA)
Some key developments and strategies adopted by manufacturers in Microalgae-based Products are highlighted below.
· In September 2018, The Algae Biomass Organization (ABO), the trade association for the algae industry, announced Cyanotech Corporation, a world leader in microalgae-based, high-value nutrition and health products, as its newest Gold-level member. As a Gold member of ABO, Cyanotech joins an elite group of companies and organizations that are coordinating the market strategies, policy support and technology advances that will develop algae into a sustainable source of countless products and services.
· In September 2018, Cyanotech® Corporation, a world leader in microalgae-based, high-value nutrition and health products, announced that it has signed an Asset Purchase Agreement with Cellana LLC to acquire a six-acre production and research facility, known as the Kona Demonstration Facility (KDF), located adjacent to Cyanotech’s existing 90-acre site at the Natural Energy Laboratory of Hawaii Authority (NELHA). The acquisition includes all existing equipment and other assets necessary to operate the facility.
Microalgae-based Products Market, Key Players
· EID Parry Ltd. · euglena Co, Ltd · Cyanotech Corporation · AstaReal Group · BlueTech International GmbH. · Far East Bio-Tec Co., Ltd · Cellana Inc. · Ocean Nutrition · Algae Health Sciences - A BGG Company · Earthrise Nutritional · NOW · Necton · Algae International Berhad (AIB) · Proalgen Biotech Ltd.
Frequently Asked Questions (FAQ) :
Q1. What are the driving factors for the Microalgae-based Products market?
A. The global Microalgae-based Products market is being driven by a growth in consumer knowledge about nutrition and health, as well as a preference for natural alternatives to standard pharmaceutical products.
Q2. Which Segments are covered in the Microalgae-based Products Market report?
A. Product, Application, and Region. these segments are covered in the Microalgae-based Products market report.
Q3. Which segment is projected to hold the largest share in the Microalgae-based Products Market?
A. Spirulina segments are projected to hold the largest share in the Microalgae-based Products Market.
Q4. Which region holds the largest share in the Microalgae-based Products market?
A. Europe held the largest share in the global Microalgae-based Products market
Q5. Which are the prominent players in the Microalgae-based Products Market?
A. EID Parry Ltd., euglena Co, Ltd, Cyanotech Corporation, AstaReal Group, BlueTech International GmbH., Far East Bio-Tec Co., Ltd, Cellana Inc., Ocean Nutrition, Algae Health Sciences - A BGG Company, Earthrise Nutritional, NOW, Necton, Algae International Berhad (AIB), Proalgen Biotech Ltd. are some key players in the Microalgae-based Products Market.
Microalgae-based Products Market Study Global Market Analysis, Insights and Forecast, 2020-2027
1. Introduction
1.1. Research Scope
1.2. Market Segmentation
1.3. Research Methodology
1.4. Definitions and Assumptions
2. Executive Summary
3. Market Dynamics
3.1. Market Drivers
3.2. Market Restraints
3.3. Market Opportunities
4. Key Insights
4.1. Key Emerging Trends – For Major Countries
4.2. Latest Technological Advancement
4.3. Regulatory Landscape
4.4. Industry SWOT Analysis
4.5. Porters Five Forces Analysis
5. Global Microalgae-based Products Market Analysis (USD Billion), Insights and Forecast, 2020-2027
5.1. Key Findings / Summary
5.2. Market Analysis, Insights and Forecast – By Product
5.2.1. Spirulina
5.2.2. Chlorella
5.2.3. Dunaliella Salina
5.2.4. Astaxanthin
5.2.5. Beta-carotene
5.2.6. PUFA Fatty Acid
5.2.7. Lutein
5.2.8. Others
5.3. Market Analysis, Insights and Forecast – By Application
5.3.1. Food & Beverages
5.3.2. Personal Care
5.3.3. Nutraceuticals & Dietary Supplements
5.3.4. Pharmaceuticals
5.3.5. Chemicals
5.3.6. Fuel
5.3.7. Animal Feed
5.3.8. Others
5.4. Market Analysis, Insights and Forecast – By Region
5.4.1. North America
5.4.2. Europe
5.4.3. Asia Pacific
5.4.4. Latin America, Middle East and Africa
6. North America Microalgae-based Products Market Analysis (USD Billion), Insights and Forecast, 2020-2027
6.1. Key Findings / Summary
6.2. Market Analysis, Insights and Forecast – By Product
6.2.1. Spirulina
6.2.2. Chlorella
6.2.3. Dunaliella Salina
6.2.4. Astaxanthin
6.2.5. Beta-carotene
6.2.6. PUFA Fatty Acid
6.2.7. Lutein
6.2.8. Others
6.3. Market Analysis, Insights and Forecast – By Application
6.3.1. Food & Beverages
6.3.2. Personal Care
6.3.3. Nutraceuticals & Dietary Supplements
6.3.4. Pharmaceuticals
6.3.5. Chemicals
6.3.6. Fuel
6.3.7. Animal Feed
6.3.8. Others
6.4. Market Analysis, Insights and Forecast – By Country
6.4.1. U.S.
6.4.2. Canada
7. Europe Microalgae-based Products Market Analysis (USD Billion), Insights and Forecast, 2020-2027
7.1. Key Findings / Summary
7.2. Market Analysis, Insights and Forecast – By Product
7.2.1. Spirulina
7.2.2. Chlorella
7.2.3. Dunaliella Salina
7.2.4. Astaxanthin
7.2.5. Beta-carotene
7.2.6. PUFA Fatty Acid
7.2.7. Lutein
7.2.8. Others
7.3. Market Analysis, Insights and Forecast – By Application
7.3.1. Food & Beverages
7.3.2. Personal Care
7.3.3. Nutraceuticals & Dietary Supplements
7.3.4. Pharmaceuticals
7.3.5. Chemicals
7.3.6. Fuel
7.3.7. Animal Feed
7.3.8. Others
7.4. Market Analysis, Insights and Forecast – By Country
7.4.1. UK
7.4.2. Germany
7.4.3. France
7.4.4. Italy
7.4.5. Spain
7.4.6. Russia
7.4.7. Rest of Europe
8. Asia Pacific Microalgae-based Products Market Analysis (USD Billion), Insights and Forecast, 2020-2027
8.1. Key Findings / Summary
8.2. Market Analysis, Insights and Forecast – By Product
8.2.1. Spirulina
8.2.2. Chlorella
8.2.3. Dunaliella Salina
8.2.4. Astaxanthin
8.2.5. Beta-carotene
8.2.6. PUFA Fatty Acid
8.2.7. Lutein
8.2.8. Others
8.3. Market Analysis, Insights and Forecast – By Application
8.3.1. Food & Beverages
8.3.2. Personal Care
8.3.3. Nutraceuticals & Dietary Supplements
8.3.4. Pharmaceuticals
8.3.5. Chemicals
8.3.6. Fuel
8.3.7. Animal Feed
8.3.8. Others
8.4. Market Analysis, Insights and Forecast – By Country
8.4.1. China
8.4.2. India
8.4.3. Japan
8.4.4. Australia
8.4.5. South East Asia
8.4.6. Rest of Asia Pacific
9. Latin America, Middle East and Africa Microalgae-based Products Market Analysis (USD Billion), Insights and Forecast, 2020-2027
9.1. Key Findings / Summary
9.2. Market Analysis, Insights and Forecast – By Product
9.2.1. Spirulina
9.2.2. Chlorella
9.2.3. Dunaliella Salina
9.2.4. Astaxanthin
9.2.5. Beta-carotene
9.2.6. PUFA Fatty Acid
9.2.7. Lutein
9.2.8. Others
9.3. Market Analysis, Insights and Forecast – By Application
9.3.1. Food & Beverages
9.3.2. Personal Care
9.3.3. Nutraceuticals & Dietary Supplements
9.3.4. Pharmaceuticals
9.3.5. Chemicals
9.3.6. Fuel
9.3.7. Animal Feed
9.3.8. Others
9.4. Market Analysis, Insights and Forecast – By Country
9.4.1. Brazil
9.4.2. Saudi Arabia
9.4.3. UAE
9.4.4. Rest of LAMEA
10. Competitive Analysis
10.1. Company Market Share Analysis, 2018
10.2. Key Industry Developments
10.3. Company Profile
10.4. EID Parry Ltd.
10.4.1. Business Overview
10.4.2. Segment 1 & Service Offering
10.4.3. Overall Revenue
10.4.4. Geographic Presence
10.4.5. Recent Development
*Similar details will be provided for the following companies
10.5. euglena Co, Ltd
10.6. Cyanotech Corporation
10.7. AstaReal Group
10.8. BlueTech International GmbH.
10.9. Far East Bio-Tec Co., Ltd
10.10. Cellana Inc.
10.11. Ocean Nutrition
10.12. Algae Health Sciences - A BGG Company
10.13. Earthrise Nutritional
10.14. NOW
10.15. Necton
10.16. Algae International Berhad (AIB)
List of Figures
Figure 1: Global Microalgae-based Products Market Revenue Breakdown (USD Billion, %) by Region, 2019 & 2027
Figure 2: Global Market Value Share (%), By Segment 1, 2019 & 2027
Figure 3: Global Market Forecast (USD Billion), by Sub-Segment 1, 2016-2027
Figure 4: Global Market Forecast (USD Billion), by Sub-Segment 2, 2016-2027
Figure 5: Global Market Value Share (%), By Segment 2, 2019 & 2027
Figure 6: Global Market Forecast (USD Billion), by Sub-Segment 1, 2016-2027
Figure 7: Global Market Forecast (USD Billion), by Sub-Segment 2, 2016-2027
Figure 8: Global Market Forecast (USD Billion), by Sub-Segment 3, 2016-2027
Figure 9: Global Microalgae Market Forecast (USD Billion), by Others, 2016-2027
Figure 10: Global Market Value Share (%), By Segment 3, 2019 & 2027
Figure 11: Global Market Forecast (USD Billion), by Sub-Segment 1, 2016-2027
Figure 12: Global Market Forecast (USD Billion), by Sub-Segment 2, 2016-2027
Figure 13: Global Market Forecast (USD Billion), by Sub-Segment 3, 2016-2027
Figure 14: Global Market Forecast (USD Billion), by Others, 2016-2027
Figure 15: Global Market Value (USD Billion), by Region, 2019 & 2027
Figure 16: North America Microalgae-based Products Market Value Share (%), By Segment 1, 2019 & 2027
Figure 17: North America Market Forecast (USD Billion), by Sub-Segment 1, 2016-2027
Figure 18: North America Market Forecast (USD Billion), by Sub-Segment 2, 2016-2027
Figure 19: North America Market Value Share (%), By Segment 2, 2019 & 2027
Figure 20: North America Market Forecast (USD Billion), by Sub-Segment 1, 2016-2027
Figure 21: North America Market Forecast (USD Billion), by Sub-Segment 2, 2016-2027
Figure 22: North America Market Forecast (USD Billion), by Sub-Segment 3, 2016-2027
Figure 23: North America Market Forecast (USD Billion), by Others, 2016-2027
Figure 24: North America Market Value Share (%), By Segment 3, 2019 & 2027
Figure 25: North America Market Forecast (USD Billion), by Sub-Segment 1, 2016-2027
Figure 26: North America Market Forecast (USD Billion), by Sub-Segment 2, 2016-2027
Figure 27: North America Market Forecast (USD Billion), by Sub-Segment 3, 2016-2027
Figure 28: North America Market Forecast (USD Billion), by Others, 2016-2027
Figure 29: North America Market Forecast (USD Billion), by U.S., 2016-2027
Figure 30: North America Market Forecast (USD Billion), by Canada, 2016-2027
Figure 31: Latin America Microalgae Market Value Share (%), By Segment 1, 2019 & 2027
Figure 32: Latin America Market Forecast (USD Billion), by Sub-Segment 1, 2016-2027
Figure 33: Latin America Microalgae-based Products Market Forecast (USD Billion), by Sub-Segment 2, 2016-2027
Figure 34: Latin America Market Value Share (%), By Segment 2, 2019 & 2027
Figure 35: Latin America Market Forecast (USD Billion), by Sub-Segment 1, 2016-2027
Figure 36: Latin America Market Forecast (USD Billion), by Sub-Segment 2, 2016-2027
Figure 37: Latin America Market Forecast (USD Billion), by Sub-Segment 3, 2016-2027
Figure 38: Latin America Market Forecast (USD Billion), by Others, 2016-2027
Figure 39: Latin America Market Value Share (%), By Segment 3, 2019 & 2027
Figure 40: Latin America Market Forecast (USD Billion), by Sub-Segment 1, 2016-2027
Figure 41: Latin America Market Forecast (USD Billion), by Sub-Segment 2, 2016-2027
Figure 42: Latin America Market Forecast (USD Billion), by Sub-Segment 3, 2016-2027
Figure 43: Latin America Market Forecast (USD Billion), by Others, 2016-2027
Figure 44: Latin America Market Forecast (USD Billion), by Brazil, 2016-2027
Figure 45: Latin America Market Forecast (USD Billion), by Mexico, 2016-2027
Figure 46: Latin America Market Forecast (USD Billion), by Rest of Latin America, 2016-2027
Figure 47: Europe Microalgae-based Products Market Value Share (%), By Segment 1, 2019 & 2027
Figure 48: Europe Market Forecast (USD Billion), by Sub-Segment 1, 2016-2027
Figure 49: Europe Market Forecast (USD Billion), by Sub-Segment 2, 2016-2027
Figure 50: Europe Market Value Share (%), By Segment 2, 2019 & 2027
Figure 51: Europe Market Forecast (USD Billion), by Sub-Segment 1, 2016-2027
Figure 52: Europe Market Forecast (USD Billion), by Sub-Segment 2, 2016-2027
Figure 53: Europe Market Forecast (USD Billion), by Sub-Segment 3, 2016-2027
Figure 54: Europe Market Forecast (USD Billion), by Others, 2016-2027
Figure 55: Europe Market Value Share (%), By Segment 3, 2019 & 2027
Figure 56: Europe Market Forecast (USD Billion), by Sub-Segment 1, 2016-2027
Figure 57: Europe Market Forecast (USD Billion), by Sub-Segment 2, 2016-2027
Figure 58: Europe Market Forecast (USD Billion), by Sub-Segment 3, 2016-2027
Figure 59: Europe Market Forecast (USD Billion), by Others, 2016-2027
Figure 60: Europe Market Forecast (USD Billion), by U.K., 2016-2027
Figure 61: Europe Market Forecast (USD Billion), by Germany, 2016-2027
Figure 62: Europe Market Forecast (USD Billion), by France, 2016-2027
Figure 63: Europe Market Forecast (USD Billion), by Italy, 2016-2027
Figure 64: Europe Market Forecast (USD Billion), by Spain, 2016-2027
Figure 65: Europe Market Forecast (USD Billion), by Russia, 2016-2027
Figure 66: Europe Market Forecast (USD Billion), by Rest of Europe, 2016-2027
Figure 67: Asia Pacific Microalgae-based Products Market Value Share (%), By Segment 1, 2019 & 2027
Figure 68: Asia Pacific Market Forecast (USD Billion), by Sub-Segment 1, 2016-2027
Figure 69: Asia Pacific Market Forecast (USD Billion), by Sub-Segment 2, 2016-2027
Figure 70: Asia Pacific Market Value Share (%), By Segment 2, 2019 & 2027
Figure 71: Asia Pacific Market Forecast (USD Billion), by Sub-Segment 1, 2016-2027
Figure 72: Asia Pacific Market Forecast (USD Billion), by Sub-Segment 2, 2016-2027
Figure 73: Asia Pacific Market Forecast (USD Billion), by Sub-Segment 3, 2016-2027
Figure 74: Asia Pacific Market Forecast (USD Billion), by Others, 2016-2027
Figure 75: Asia Pacific Market Value Share (%), By Segment 3, 2019 & 2027
Figure 76: Asia Pacific Market Forecast (USD Billion), by Sub-Segment 1, 2016-2027
Figure 77: Asia Pacific Market Forecast (USD Billion), by Sub-Segment 2, 2016-2027
Figure 78: Asia Pacific Market Forecast (USD Billion), by Sub-Segment 3, 2016-2027
Figure 79: Asia Pacific Market Forecast (USD Billion), by Others, 2016-2027
Figure 80: Asia Pacific Market Forecast (USD Billion), by China, 2016-2027
Figure 81: Asia Pacific Market Forecast (USD Billion), by India, 2016-2027
Figure 82: Asia Pacific Market Forecast (USD Billion), by Japan, 2016-2027
Figure 83: Asia Pacific Market Forecast (USD Billion), by Australia, 2016-2027
Figure 84: Asia Pacific Market Forecast (USD Billion), by Southeast Asia, 2016-2027
Figure 85: Asia Pacific Market Forecast (USD Billion), by Rest of Asia Pacific, 2016-2027
Figure 86: Middle East & Africa Microalgae-based Products Market Value Share (%), By Segment 1, 2019 & 2027
Figure 87: Middle East & Africa Market Forecast (USD Billion), by Sub-Segment 1, 2016-2027
Figure 88: Middle East & Africa Market Forecast (USD Billion), by Sub-Segment 2, 2016-2027
Figure 89: Middle East & Africa Market Value Share (%), By Segment 2, 2019 & 2027
Figure 90: Middle East & Africa Market Forecast (USD Billion), by Sub-Segment 1, 2016-2027
Figure 91: Middle East & Africa Market Forecast (USD Billion), by Sub-Segment 2, 2016-2027
Figure 92: Middle East & Africa Market Forecast (USD Billion), by Sub-Segment 3, 2016-2027
Figure 93: Middle East & Africa Market Forecast (USD Billion), by Others, 2016-2027
Figure 94: Middle East & Africa Market Value Share (%), By Segment 3, 2019 & 2027
Figure 95: Middle East & Africa Market Forecast (USD Billion), by Sub-Segment 1, 2016-2027
Figure 96: Middle East & Africa Market Forecast (USD Billion), by Sub-Segment 2, 2016-2027
Figure 97: Middle East & Africa Market Forecast (USD Billion), by Sub-Segment 3, 2016-2027
Figure 98: Middle East & Africa Market Forecast (USD Billion), by Others, 2016-2027
Figure 99: Middle East & Africa Market Forecast (USD Billion), by GCC, 2016-2027
Figure 100: Middle East & Africa Market Forecast (USD Billion), by South Africa, 2016-2027
Figure 101: Middle East & Africa Market Forecast (USD Billion), by Rest of Middle East & Africa, 2016-2027
List of Tables
Table 1: Global Microalgae-based Products Market Revenue (USD Billion) Forecast, by Segment 1, 2016-2027
Table 2: Global Market Revenue (USD Billion) Forecast, by Segment 2, 2016-2027
Table 3: Global Market Revenue (USD Billion) Forecast, by Segment 3, 2016-2027
Table 4: Global Market Revenue (USD Billion) Forecast, by Region, 2016-2027
Table 5: North America Microalgae-based Products Market Revenue (USD Billion) Forecast, by Segment 1, 2016-2027
Table 6: North America Market Revenue (USD Billion) Forecast, by Segment 2, 2016-2027
Table 7: North America Market Revenue (USD Billion) Forecast, by Segment 3, 2016-2027
Table 8: North America Market Revenue (USD Billion) Forecast, by Country, 2016-2027
Table 9: Europe Microalgae-based Products Market Revenue (USD Billion) Forecast, by Segment 1, 2016-2027
Table 10: Europe Market Revenue (USD Billion) Forecast, by Segment 2, 2016-2027
Table 11: Europe Market Revenue (USD Billion) Forecast, by Segment 3, 2016-2027
Table 12: Europe Market Revenue (USD Billion) Forecast, by Country, 2016-2027
Table 13: Latin America Microalgae-based Products Market Revenue (USD Billion) Forecast, by Segment 1, 2016-2027
Table 14: Latin America Market Revenue (USD Billion) Forecast, by Segment 2, 2016-2027
Table 15: Latin America Market Revenue (USD Billion) Forecast, by Segment 3, 2016-2027
Table 16: Latin America Market Revenue (USD Billion) Forecast, by Country, 2016-2027
Table 17: Asia Pacific Microalgae-based Products Market Revenue (USD Billion) Forecast, by Segment 1, 2016-2027
Table 18: Asia Pacific Market Revenue (USD Billion) Forecast, by Segment 2, 2016-2027
Table 19: Asia Pacific Market Revenue (USD Billion) Forecast, by Segment 3, 2016-2027
Table 20: Asia Pacific Market Revenue (USD Billion) Forecast, by Country, 2016-2027
Table 21: Middle East & Africa Microalgae-based Products Market Revenue (USD Billion) Forecast, by Segment 1, 2016-2027
Table 22: Middle East & Africa Market Revenue (USD Billion) Forecast, by Segment 2, 2016-2027
Table 23: Middle East & Africa Market Revenue (USD Billion) Forecast, by Segment 3, 2016-2027
Table 24: Middle East & Africa Market Revenue (USD Billion) Forecast, by Country, 2016-2027