Mini Limit Switches Market Overview and Analysis

The Global Mini Limit Switches Market size was valued at approximately USD 1.8 billion in 2025 and is projected to reach around USD 5.1 billion by 2032, growing with a CAGR of 7.9% from 2025-2032.

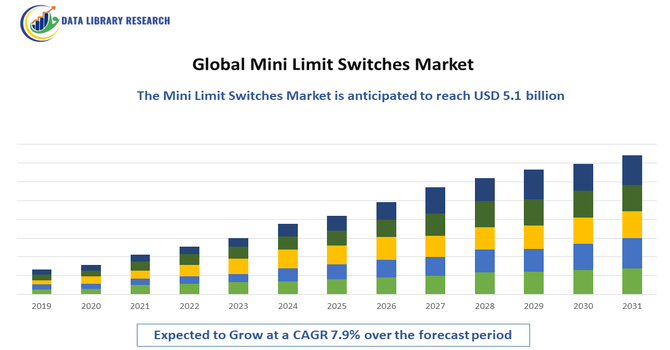
The Global Mini Limit Switches Market involves compact electromechanical devices used to detect object presence or position in automation and control systems. These switches are essential in industries like manufacturing, automotive, and robotics for precise motion control and safety applications.

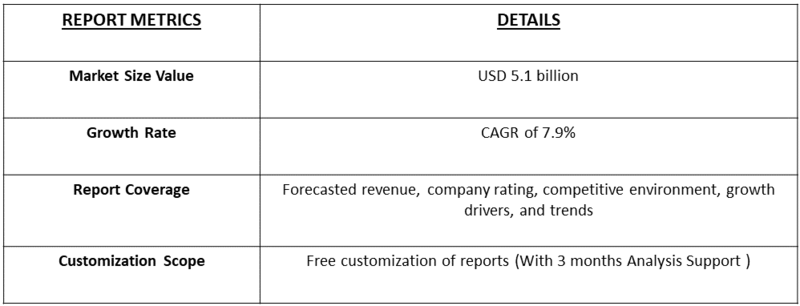
Market growth is driven by increasing automation across industries, rising demand for compact and reliable control devices, advancements in smart manufacturing, and the need for efficient space-saving solutions in machinery. Additionally, expanding applications in automotive safety systems and industrial robotics further propel the market’s expansion globally. Furthermore, the growing emphasis on Industry 4.0 and the integration of Internet of Things (IoT) technologies have accelerated the adoption of mini limit switches, enabling real-time monitoring and enhanced operational efficiency. Strict government regulations regarding workplace safety and machine performance also boost demand. Additionally, rising investments in emerging economies’ manufacturing sectors and continuous innovation in switch materials and designs contribute to market growth by improving durability, sensitivity, and environmental resistance of mini limit switches.

Mini Limit Switches Market Trends

The Global Mini Limit Switches Market has witnessed significant trends, including the shift toward compact, high-precision switches for automation and robotics applications. Increasing adoption of smart factories and Industry 4.0 technologies has driven demand for switches with IoT compatibility and real-time monitoring capabilities. Additionally, manufacturers are focusing on durable, environmentally resistant designs suitable for harsh industrial conditions. The growing use of mini limit switches in automotive, packaging, and electronics sectors, coupled with rising demand in emerging markets, is shaping overall market growth.

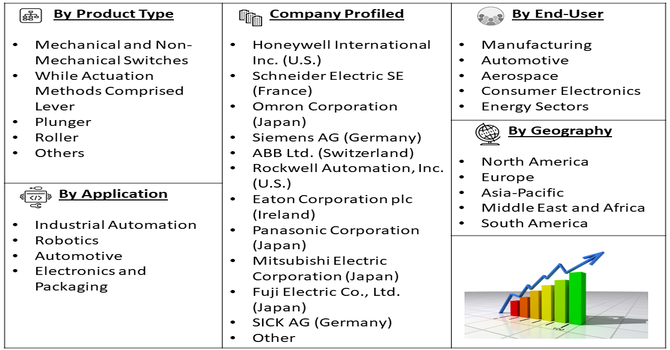
Segmentation: The Global Mini Limit Switches Market was segmented By Type (Mechanical and Non-Mechanical Switches, While Actuation Methods Comprised Lever, Plunger, Roller, and Others), Applications (Industrial Automation, Robotics, Automotive, Electronics and Packaging), End-User Industries ( Manufacturing, Automotive, Aerospace, Consumer Electronics, and Energy Sectors) and Geography (North America, Europe, Asia-Pacific, Middle East and Africa, and South America). The report provides the value (in USD million) for the above segments.

Market Driver:

  • Rising Industrial Automation Adoption

The global surge in industrial automation has significantly driven the mini limit switches market. Manufacturers across automotive, food & beverage, and electronics industries increasingly integrate automated machinery to enhance operational efficiency, reduce labor costs, and improve precision. Mini limit switches, known for their compact design, reliability, and cost-effectiveness, are critical in detecting object position, controlling machinery movement, and ensuring safety in automated systems. As industries continue to expand and modernize their production lines, the demand for mini limit switches is expected to grow, supporting seamless integration in robotics, conveyors, and other automated equipment worldwide.

  • Growing Automotive and Electronics Sectors

The expanding automotive and electronics sectors have contributed to rising demand for mini limit switches globally. In vehicles, these switches are used for door detection, gear position monitoring, and safety systems, while in electronics, they ensure precise control in devices like printers, vending machines, and home appliances. Increasing production of electric vehicles, smart devices, and automated consumer electronics has amplified the need for compact, durable, and accurate limit switches. Additionally, stringent safety and regulatory requirements in these sectors further drive adoption, reinforcing the market’s steady growth trajectory across Asia-Pacific, North America, and Europe.

Market Restraint

  • High Competition from Advanced Sensor Technologies

The growth of alternative sensor technologies, such as proximity sensors, photoelectric sensors, and Hall-effect sensors, has posed a challenge for the mini limit switches market. These non-contact sensors offer higher precision, durability, and flexibility, reducing mechanical wear and maintenance needs. Industries seeking advanced automation solutions increasingly favor these alternatives, which can integrate more easily with modern control systems and IoT platforms. Consequently, mini limit switches face competitive pressure, particularly in high-tech manufacturing and electronics applications, restraining market expansion despite strong demand in traditional industrial and automotive segments.

Socio Economic Impact on Mini Limit Switches Market

The Global Mini Limit Switches Market significantly impacts the economy by enabling widespread industrial and manufacturing automation, directly contributing to increased productivity, efficiency, and reduced operational costs across sectors like automotive and robotics. This efficiency gain, however, has a socioeconomic dual edge: while it boosts GDP and global competitiveness, it also accelerates job displacement in routine manual labor, demanding workforce retraining in maintenance and high-tech automation roles. Societally, these switches enhance worker safety by providing reliable mechanical fail-safes in heavy machinery, reducing industrial accidents and lowering healthcare costs associated with workplace injuries, thus balancing economic growth with social well-being.

Segmental Analysis:

  • Non-Mechanical Switches segment is expected to witness highest growth over the forecast period

The Non-Mechanical Switches segment in the Global Mini Limit Switches Market was projected to witness the highest growth over the forecast period. This growth was driven by increasing adoption of advanced sensing technologies that provide higher precision, durability, and faster response times compared to traditional mechanical switches. Non-mechanical switches, including capacitive, optical, and magnetic types, offered enhanced reliability in harsh environments and reduced maintenance costs, making them suitable for emerging industries such as robotics, medical devices, and smart manufacturing. The rising demand for compact, energy-efficient, and contactless switching solutions further fueled the adoption of non-mechanical switches, positioning this segment as a key driver of market expansion globally.

  • Industrial Automation segment is expected to witness highest growth over the forecast period

The Industrial Automation segment was expected to witness the highest growth over the forecast period, reflecting the global push toward Industry 4.0 and smart manufacturing. Mini limit switches were increasingly integrated into automated assembly lines, robotic systems, and conveyor mechanisms to monitor position, motion, and safety parameters with high precision. Growing demand for process optimization, reduced downtime, and improved operational efficiency encouraged manufacturers to adopt mini limit switches extensively. Additionally, the shift toward predictive maintenance and IoT-enabled smart factories further boosted the adoption of these switches, as industries required reliable and compact sensing solutions capable of sustaining continuous operations under harsh industrial conditions.

  • Aerospace segment is expected to witness highest growth over the forecast period

The Aerospace segment was projected to experience the highest growth over the forecast period due to the increasing demand for lightweight, reliable, and high-performance mini limit switches in aircraft systems. These switches were critical in monitoring flight control surfaces, landing gear operations, fuel systems, and cabin mechanisms, ensuring operational safety and efficiency. Rising global air travel, investments in next-generation aircraft, and advancements in unmanned aerial vehicles (UAVs) created a surge in demand for precise and durable switching solutions. The need for switches capable of withstanding extreme temperatures, vibrations, and pressure variations further reinforced the adoption of mini limit switches in aerospace applications worldwide.

  • North America Region is expected to witness highest growth over the forecast period

The North America region was expected to witness the highest growth over the forecast period, driven by rapid industrial automation adoption, advanced manufacturing technologies, and strong aerospace and automotive sectors. The region’s emphasis on Industry 4.0 initiatives, smart factories, and safety-compliant automation solutions significantly boosted demand for mini limit switches. Additionally, government incentives for technological innovation, robust R&D infrastructure, and the presence of major players in electronics, robotics, and defense industries supported market growth. Increasing demand for efficient, compact, and durable switching solutions across multiple industrial and commercial applications further positioned North America as a leading growth region in the global mini limit switches market.

Mini Limit Switches Market Competitive Analysis

The competitive landscape of the Global Mini Limit Switches Market featured a blend of established multinational corporations and emerging regional players thereby creating a moderately fragmented environment. Key players such as Schneider Electric SE, Omron Corporation, Honeywell International Inc., ABB Ltd. and Siemens AG invested heavily in R&D, advanced product portfolios, and geographic expansion to gain competitive edge. Innovation in miniaturisation, IoT enabled features, ruggedness, and customisation emerged as key differentiators. Regional firms focused on cost effective solutions and local market agility. Strategic collaborations, acquisitions and partnerships reshaped market dynamics, while high entry barriers and regulatory standards limited new entrants.

The major players for above market:

  • Honeywell International Inc. (U.S.)
  • Schneider Electric SE (France)
  • Omron Corporation (Japan)
  • Siemens AG (Germany)
  • ABB Ltd. (Switzerland)
  • Rockwell Automation, Inc. (U.S.)
  • Eaton Corporation plc (Ireland)
  • Panasonic Corporation (Japan)
  • Mitsubishi Electric Corporation (Japan)
  • Fuji Electric Co., Ltd. (Japan)
  • SICK AG (Germany)
  • Balluff GmbH (Germany)
  • Turck Inc. (Germany/U.S.)
  • Schmersal Group (Germany)
  • Bernstein AG (Germany)
  • IDEC Corporation (Japan)
  • Crouzet Automatismes SAS (France)
  • Telemecanique Sensors (France)
  • Bartec Group (Germany)
  • Gama Power Controls Pvt Ltd (India)

Recent Development

  • In October 2025, BMW introduced the Motorway Assistant for the new BMW iX3, gaining approval under UN Regulation No. 171 for Driver Control Assistance Systems (DCAS). This made BMW the first German automaker authorized to offer Level 2 “hands-off” driver assistance, enhancing highway safety and convenience. The system, later extended to other models and countries, received the “Comfort Assistance Systems” Tech Award from auto motor und sport. This advancement boosted demand for precision components, including mini limit switches, as automakers increasingly integrated advanced driver-assistance systems globally.


  • In June 2025, Apple unveiled AppleCare One, a new service that allowed customers to cover multiple Apple products under a single plan. Priced at USD 19.99 per month, the plan protected up to three devices, with the option to add more at USD 5.99 per device monthly. AppleCare One provided one-stop service and support from Apple experts for all covered products, offering simplified and affordable protection. Starting the following day, U.S. customers could enroll directly via iPhone, iPad, Mac, or at Apple Stores.


Frequently Asked Questions (FAQ) :

Q1. What are the main growth driving factors for this market?

The market is primarily propelled by the widespread adoption of industrial automation and smart manufacturing (Industry 4.0) across global sectors. Mini limit switches are essential for providing precise position detection and reliable safety mechanisms in increasingly complex, automated machinery, robotics, and assembly lines. Furthermore, the push for miniaturization of components in applications like consumer electronics and automotive systems creates specific demand for small, high-precision, and durable electromechanical switches.

Q2. What are the main restraining factors for this market?

Major constraints include competition from alternative, non-contact sensing technologies, such as proximity sensors and photo-electric devices, which are often favored for their superior durability in harsh, dirty environments. Additionally, the longevity and reliability of traditional mechanical switches are highly vulnerable to environmental factors like extreme temperatures, vibration, and dust/moisture ingress, necessitating higher IP ratings and increasing material costs to ensure consistent performance.

Q3. Which segment is expected to witness high growth?

The Automotive and Electronics Manufacturing application segments are expected to witness high growth. This is driven by the rapid expansion of electric vehicle (EV) production, requiring compact, reliable switches for safety and control systems, and the dense automation in electronics assembly lines. By function, the segment focused on safety applications is also growing quickly, propelled by stringent global machine safety regulations that mandate reliable switch mechanisms to prevent accidents and ensure operational compliance.

Q4. Who are the top major players for this market?

The market is dominated by well-established global industrial technology and automation companies. Top major players include Honeywell International Inc., OMRON Corporation, Schneider Electric SE, and Siemens AG. These companies leverage their strong brand trust, broad product portfolios, and extensive global distribution networks. Their competitive edge lies in the ability to produce highly reliable, certified switches (e.g., UL, CE) and integrate advanced features like wireless connectivity for IoT-enabled predictive maintenance applications.

Q5. Which country is the largest player?

The Asia Pacific (APAC) region, led by China, is the largest market player in terms of both production and consumption volume. This dominance is due to the region's status as the global manufacturing powerhouse, experiencing rapid industrialization, extensive factory automation, and massive infrastructure development. The high volume of production across the automotive and electronics sectors in China, Japan, and South Korea drives immense, continuous demand for all types of limit switches, including the miniature variants.

Mini Limit Switches MARKET STUDY GLOBAL MARKET ANALYSIS, INSIGHTS AND FORECAST, 2022-2029

    1. Introduction

    • 1.1. Research Scope
    • 1.2. Market Segmentation
    • 1.3. Research Methodology
    • 1.4. Definitions and Assumptions

    2. Executive Summary

      3. Market Dynamics

      • 3.1. Market Drivers
      • 3.2. Market Restraints
      • 3.3. Market Opportunities

      4. Key Insights

      • 4.1. Key Emerging Trends – For Major Countries
      • 4.2. Latest Technological Advancement
      • 4.3. Regulatory Landscape
      • 4.4. Industry SWOT Analysis
      • 4.5. Porters Five Forces Analysis

      5. Global Mini Limit Switches Market Analysis (USD Billion), Insights and Forecast, 2018-2029

      • 5.1. Key Findings / Summary
      • 5.2. Market Analysis, Insights and Forecast – By Segment 1
        • 5.2.1. Sub-Segment 1
        • 5.2.2. Sub-Segment 2
      • 5.3. Market Analysis, Insights and Forecast – By Segment 2
        • 5.3.1. Sub-Segment 1
        • 5.3.2. Sub-Segment 2
        • 5.3.3. Sub-Segment 3
        • 5.3.4. Others
      • 5.4. Market Analysis, Insights and Forecast – By Segment 3
        • 5.4.1. Sub-Segment 1
        • 5.4.2. Sub-Segment 2
        • 5.4.3. Sub-Segment 3
        • 5.4.4. Others
      • 5.5. Market Analysis, Insights and Forecast – By Region
        • 5.5.1. North America
        • 5.5.2. Latin America
        • 5.5.3. Europe
        • 5.5.4. Asia Pacific
        • 5.5.5. Middle East and Africa

      6. North America Mini Limit Switches Market Analysis (USD Billion), Insights and Forecast, 2018-2029

      • 6.1. Key Findings / Summary
      • 6.2. Market Analysis, Insights and Forecast – By Segment 1
        • 6.2.1. Sub-Segment 1
        • 6.2.2. Sub-Segment 2
      • 6.3. Market Analysis, Insights and Forecast – By Segment 2
        • 6.3.1. Sub-Segment 1
        • 6.3.2. Sub-Segment 2
        • 6.3.3. Sub-Segment 3
        • 6.3.4. Others
      • 6.4. Market Analysis, Insights and Forecast – By Segment 3
        • 6.4.1. Sub-Segment 1
        • 6.4.2. Sub-Segment 2
        • 6.4.3. Sub-Segment 3
        • 6.4.4. Others
      • 6.5. Market Analysis, Insights and Forecast – By Country
        • 6.5.1. U.S.
        • 6.5.2. Canada

      7. Latin America Mini Limit Switches Market Analysis (USD Billion), Insights and Forecast, 2018-2029

      • 7.1. Key Findings / Summary
      • 7.2. Market Analysis, Insights and Forecast – By Segment 1
        • 7.2.1. Sub-Segment 1
        • 7.2.2. Sub-Segment 2
      • 7.3. Market Analysis, Insights and Forecast – By Segment 2
        • 7.3.1. Sub-Segment 1
        • 7.3.2. Sub-Segment 2
        • 7.3.3. Sub-Segment 3
        • 7.3.4. Others
      • 7.4. Market Analysis, Insights and Forecast – By Segment 3
        • 7.4.1. Sub-Segment 1
        • 7.4.2. Sub-Segment 2
        • 7.4.3. Sub-Segment 3
        • 7.4.4. Others
      • 7.5. Insights and Forecast – By Country
        • 7.5.1. Brazil
        • 7.5.2. Mexico
        • 7.5.3. Rest of Latin America

      8. Europe Mini Limit Switches Market Analysis (USD Billion), Insights and Forecast, 2018-2029

      • 8.1. Key Findings / Summary
      • 8.2. Market Analysis, Insights and Forecast – By Segment 1
        • 8.2.1. Sub-Segment 1
        • 8.2.2. Sub-Segment 2
      • 8.3. Market Analysis, Insights and Forecast – By Segment 2
        • 8.3.1. Sub-Segment 1
        • 8.3.2. Sub-Segment 2
        • 8.3.3. Sub-Segment 3
        • 8.3.4. Others
      • 8.4. Market Analysis, Insights and Forecast – By Segment 3
        • 8.4.1. Sub-Segment 1
        • 8.4.2. Sub-Segment 2
        • 8.4.3. Sub-Segment 3
        • 8.4.4. Others
      • 8.5. Market Analysis, Insights and Forecast – By Country
        • 8.5.1. UK
        • 8.5.2. Germany
        • 8.5.3. France
        • 8.5.4. Italy
        • 8.5.5. Spain
        • 8.5.6. Russia
        • 8.5.7. Rest of Europe

      9. Asia Pacific Mini Limit Switches Market Analysis (USD Billion), Insights and Forecast, 2018-2029

      • 9.1. Key Findings / Summary
      • 9.2. Market Analysis, Insights and Forecast – By Segment 1
        • 9.2.1. Sub-Segment 1
        • 9.2.2. Sub-Segment 2
      • 9.3. Market Analysis, Insights and Forecast – By Segment 2
        • 9.3.1. Sub-Segment 1
        • 9.3.2. Sub-Segment 2
        • 9.3.3. Sub-Segment 3
        • 9.3.4. Others
      • 9.4. Market Analysis, Insights and Forecast – By Segment 3
        • 9.4.1. Sub-Segment 1
        • 9.4.2. Sub-Segment 2
        • 9.4.3. Sub-Segment 3
        • 9.4.4. Others
      • 9.5. Market Analysis, Insights and Forecast – By Country
        • 9.5.1. China
        • 9.5.2. India
        • 9.5.3. Japan
        • 9.5.4. Australia
        • 9.5.5. South East Asia
        • 9.5.6. Rest of Asia Pacific

      10. Middle East & Africa Mini Limit Switches Market Analysis (USD Billion), Insights and Forecast, 2018-2029

      • 10.1. Key Findings / Summary
      • 10.2. Market Analysis, Insights and Forecast – By Segment 1
        • 10.2.1. Sub-Segment 1
        • 10.2.2. Sub-Segment 2
      • 10.3. Market Analysis, Insights and Forecast – By Segment 2
        • 10.3.1. Sub-Segment 1
        • 10.3.2. Sub-Segment 2
        • 10.3.3. Sub-Segment 3
        • 10.3.4. Others
      • 10.4. Market Analysis, Insights and Forecast – By Segment 3
        • 10.4.1. Sub-Segment 1
        • 10.4.2. Sub-Segment 2
        • 10.4.3. Sub-Segment 3
        • 10.4.4. Others
      • 10.5. Market Analysis, Insights and Forecast – By Country
        • 10.5.1. GCC
        • 10.5.2. South Africa
        • 10.5.3. Rest of Middle East & Africa

      11. Competitive Analysis

      • 11.1. Company Market Share Analysis, 2018
      • 11.2. Key Industry Developments
      • 11.3. Company Profile
        • 11.3.1. Company 1
          • 11.3.1.1. Business Overview
          • 11.3.1.2. Segment 1 & Service Offering
          • 11.3.1.3. Overall Revenue
          • 11.3.1.4. Geographic Presence
          • 11.3.1.5. Recent Development
        *Similar details will be provided for the following companies
        • 11.3.2. Company 2
        • 11.3.3. Company 3
        • 11.3.4. Company 4
        • 11.3.5. Company 5
        • 11.3.6. Company 6
        • 11.3.7. Company 7
        • 11.3.8. Company 8
        • 11.3.9. Company 9
        • 11.3.10. Company 10
        • 11.3.11. Company 11
        • 11.3.12. Company 12
      List of Figures

      Figure 1: Global Mini Limit Switches Market Revenue Breakdown (USD Billion, %) by Region, 2022 & 2029
      Figure 2: Global Mini Limit Switches Market Value Share (%), By Segment 1, 2022 & 2029
      Figure 3: Global Mini Limit Switches Market Forecast (USD Billion), by Sub-Segment 1, 2018-2029
      Figure 4: Global Mini Limit Switches Market Forecast (USD Billion), by Sub-Segment 2, 2018-2029
      Figure 5: Global Mini Limit Switches Market Value Share (%), By Segment 2, 2022 & 2029
      Figure 6: Global Mini Limit Switches Market Forecast (USD Billion), by Sub-Segment 1, 2018-2029
      Figure 7: Global Mini Limit Switches Market Forecast (USD Billion), by Sub-Segment 2, 2018-2029
      Figure 8: Global Mini Limit Switches Market Forecast (USD Billion), by Sub-Segment 3, 2018-2029
      Figure 9: Global Mini Limit Switches Market Forecast (USD Billion), by Others, 2018-2029
      Figure 10: Global Mini Limit Switches Market Value Share (%), By Segment 3, 2022 & 2029
      Figure 11: Global Mini Limit Switches Market Forecast (USD Billion), by Sub-Segment 1, 2018-2029
      Figure 12: Global Mini Limit Switches Market Forecast (USD Billion), by Sub-Segment 2, 2018-2029
      Figure 13: Global Mini Limit Switches Market Forecast (USD Billion), by Sub-Segment 3, 2018-2029
      Figure 14: Global Mini Limit Switches Market Forecast (USD Billion), by Others, 2018-2029
      Figure 15: Global Mini Limit Switches Market Value (USD Billion), by Region, 2022 & 2029
      Figure 16: North America Mini Limit Switches Market Value Share (%), By Segment 1, 2022 & 2029
      Figure 17: North America Mini Limit Switches Market Forecast (USD Billion), by Sub-Segment 1, 2018-2029
      Figure 18: North America Mini Limit Switches Market Forecast (USD Billion), by Sub-Segment 2, 2018-2029
      Figure 19: North America Mini Limit Switches Market Value Share (%), By Segment 2, 2022 & 2029
      Figure 20: North America Mini Limit Switches Market Forecast (USD Billion), by Sub-Segment 1, 2018-2029
      Figure 21: North America Mini Limit Switches Market Forecast (USD Billion), by Sub-Segment 2, 2018-2029
      Figure 22: North America Mini Limit Switches Market Forecast (USD Billion), by Sub-Segment 3, 2018-2029
      Figure 23: North America Mini Limit Switches Market Forecast (USD Billion), by Others, 2018-2029
      Figure 24: North America Mini Limit Switches Market Value Share (%), By Segment 3, 2022 & 2029
      Figure 25: North America Mini Limit Switches Market Forecast (USD Billion), by Sub-Segment 1, 2018-2029
      Figure 26: North America Mini Limit Switches Market Forecast (USD Billion), by Sub-Segment 2, 2018-2029
      Figure 27: North America Mini Limit Switches Market Forecast (USD Billion), by Sub-Segment 3, 2018-2029
      Figure 28: North America Mini Limit Switches Market Forecast (USD Billion), by Others, 2018-2029
      Figure 29: North America Mini Limit Switches Market Forecast (USD Billion), by U.S., 2018-2029
      Figure 30: North America Mini Limit Switches Market Forecast (USD Billion), by Canada, 2018-2029
      Figure 31: Latin America Mini Limit Switches Market Value Share (%), By Segment 1, 2022 & 2029
      Figure 32: Latin America Mini Limit Switches Market Forecast (USD Billion), by Sub-Segment 1, 2018-2029
      Figure 33: Latin America Mini Limit Switches Market Forecast (USD Billion), by Sub-Segment 2, 2018-2029
      Figure 34: Latin America Mini Limit Switches Market Value Share (%), By Segment 2, 2022 & 2029
      Figure 35: Latin America Mini Limit Switches Market Forecast (USD Billion), by Sub-Segment 1, 2018-2029
      Figure 36: Latin America Mini Limit Switches Market Forecast (USD Billion), by Sub-Segment 2, 2018-2029
      Figure 37: Latin America Mini Limit Switches Market Forecast (USD Billion), by Sub-Segment 3, 2018-2029
      Figure 38: Latin America Mini Limit Switches Market Forecast (USD Billion), by Others, 2018-2029
      Figure 39: Latin America Mini Limit Switches Market Value Share (%), By Segment 3, 2022 & 2029
      Figure 40: Latin America Mini Limit Switches Market Forecast (USD Billion), by Sub-Segment 1, 2018-2029
      Figure 41: Latin America Mini Limit Switches Market Forecast (USD Billion), by Sub-Segment 2, 2018-2029
      Figure 42: Latin America Mini Limit Switches Market Forecast (USD Billion), by Sub-Segment 3, 2018-2029
      Figure 43: Latin America Mini Limit Switches Market Forecast (USD Billion), by Others, 2018-2029
      Figure 44: Latin America Mini Limit Switches Market Forecast (USD Billion), by Brazil, 2018-2029
      Figure 45: Latin America Mini Limit Switches Market Forecast (USD Billion), by Mexico, 2018-2029
      Figure 46: Latin America Mini Limit Switches Market Forecast (USD Billion), by Rest of Latin America, 2018-2029
      Figure 47: Europe Mini Limit Switches Market Value Share (%), By Segment 1, 2022 & 2029
      Figure 48: Europe Mini Limit Switches Market Forecast (USD Billion), by Sub-Segment 1, 2018-2029
      Figure 49: Europe Mini Limit Switches Market Forecast (USD Billion), by Sub-Segment 2, 2018-2029
      Figure 50: Europe Mini Limit Switches Market Value Share (%), By Segment 2, 2022 & 2029
      Figure 51: Europe Mini Limit Switches Market Forecast (USD Billion), by Sub-Segment 1, 2018-2029
      Figure 52: Europe Mini Limit Switches Market Forecast (USD Billion), by Sub-Segment 2, 2018-2029
      Figure 53: Europe Mini Limit Switches Market Forecast (USD Billion), by Sub-Segment 3, 2018-2029
      Figure 54: Europe Mini Limit Switches Market Forecast (USD Billion), by Others, 2018-2029
      Figure 55: Europe Mini Limit Switches Market Value Share (%), By Segment 3, 2022 & 2029
      Figure 56: Europe Mini Limit Switches Market Forecast (USD Billion), by Sub-Segment 1, 2018-2029
      Figure 57: Europe Mini Limit Switches Market Forecast (USD Billion), by Sub-Segment 2, 2018-2029
      Figure 58: Europe Mini Limit Switches Market Forecast (USD Billion), by Sub-Segment 3, 2018-2029
      Figure 59: Europe Mini Limit Switches Market Forecast (USD Billion), by Others, 2018-2029
      Figure 60: Europe Mini Limit Switches Market Forecast (USD Billion), by U.K., 2018-2029
      Figure 61: Europe Mini Limit Switches Market Forecast (USD Billion), by Germany, 2018-2029
      Figure 62: Europe Mini Limit Switches Market Forecast (USD Billion), by France, 2018-2029
      Figure 63: Europe Mini Limit Switches Market Forecast (USD Billion), by Italy, 2018-2029
      Figure 64: Europe Mini Limit Switches Market Forecast (USD Billion), by Spain, 2018-2029
      Figure 65: Europe Mini Limit Switches Market Forecast (USD Billion), by Russia, 2018-2029
      Figure 66: Europe Mini Limit Switches Market Forecast (USD Billion), by Rest of Europe, 2018-2029
      Figure 67: Asia Pacific Mini Limit Switches Market Value Share (%), By Segment 1, 2022 & 2029
      Figure 68: Asia Pacific Mini Limit Switches Market Forecast (USD Billion), by Sub-Segment 1, 2018-2029
      Figure 69: Asia Pacific Mini Limit Switches Market Forecast (USD Billion), by Sub-Segment 2, 2018-2029
      Figure 70: Asia Pacific Mini Limit Switches Market Value Share (%), By Segment 2, 2022 & 2029
      Figure 71: Asia Pacific Mini Limit Switches Market Forecast (USD Billion), by Sub-Segment 1, 2018-2029
      Figure 72: Asia Pacific Mini Limit Switches Market Forecast (USD Billion), by Sub-Segment 2, 2018-2029
      Figure 73: Asia Pacific Mini Limit Switches Market Forecast (USD Billion), by Sub-Segment 3, 2018-2029
      Figure 74: Asia Pacific Mini Limit Switches Market Forecast (USD Billion), by Others, 2018-2029
      Figure 75: Asia Pacific Mini Limit Switches Market Value Share (%), By Segment 3, 2022 & 2029
      Figure 76: Asia Pacific Mini Limit Switches Market Forecast (USD Billion), by Sub-Segment 1, 2018-2029
      Figure 77: Asia Pacific Mini Limit Switches Market Forecast (USD Billion), by Sub-Segment 2, 2018-2029
      Figure 78: Asia Pacific Mini Limit Switches Market Forecast (USD Billion), by Sub-Segment 3, 2018-2029
      Figure 79: Asia Pacific Mini Limit Switches Market Forecast (USD Billion), by Others, 2018-2029
      Figure 80: Asia Pacific Mini Limit Switches Market Forecast (USD Billion), by China, 2018-2029
      Figure 81: Asia Pacific Mini Limit Switches Market Forecast (USD Billion), by India, 2018-2029
      Figure 82: Asia Pacific Mini Limit Switches Market Forecast (USD Billion), by Japan, 2018-2029
      Figure 83: Asia Pacific Mini Limit Switches Market Forecast (USD Billion), by Australia, 2018-2029
      Figure 84: Asia Pacific Mini Limit Switches Market Forecast (USD Billion), by Southeast Asia, 2018-2029
      Figure 85: Asia Pacific Mini Limit Switches Market Forecast (USD Billion), by Rest of Asia Pacific, 2018-2029
      Figure 86: Middle East & Africa Mini Limit Switches Market Value Share (%), By Segment 1, 2022 & 2029
      Figure 87: Middle East & Africa Mini Limit Switches Market Forecast (USD Billion), by Sub-Segment 1, 2018-2029
      Figure 88: Middle East & Africa Mini Limit Switches Market Forecast (USD Billion), by Sub-Segment 2, 2018-2029
      Figure 89: Middle East & Africa Mini Limit Switches Market Value Share (%), By Segment 2, 2022 & 2029
      Figure 90: Middle East & Africa Mini Limit Switches Market Forecast (USD Billion), by Sub-Segment 1, 2018-2029
      Figure 91: Middle East & Africa Mini Limit Switches Market Forecast (USD Billion), by Sub-Segment 2, 2018-2029
      Figure 92: Middle East & Africa Mini Limit Switches Market Forecast (USD Billion), by Sub-Segment 3, 2018-2029
      Figure 93: Middle East & Africa Mini Limit Switches Market Forecast (USD Billion), by Others, 2018-2029
      Figure 94: Middle East & Africa Mini Limit Switches Market Value Share (%), By Segment 3, 2022 & 2029
      Figure 95: Middle East & Africa Mini Limit Switches Market Forecast (USD Billion), by Sub-Segment 1, 2018-2029
      Figure 96: Middle East & Africa Mini Limit Switches Market Forecast (USD Billion), by Sub-Segment 2, 2018-2029
      Figure 97: Middle East & Africa Mini Limit Switches Market Forecast (USD Billion), by Sub-Segment 3, 2018-2029
      Figure 98: Middle East & Africa Mini Limit Switches Market Forecast (USD Billion), by Others, 2018-2029
      Figure 99: Middle East & Africa Mini Limit Switches Market Forecast (USD Billion), by GCC, 2018-2029
      Figure 100: Middle East & Africa Mini Limit Switches Market Forecast (USD Billion), by South Africa, 2018-2029
      Figure 101: Middle East & Africa Mini Limit Switches Market Forecast (USD Billion), by Rest of Middle East & Africa, 2018-2029 
      List of Tables
      Table 1: Global Mini Limit Switches Market Revenue (USD Billion) Forecast, by Segment 1, 2018-2029
      Table 2: Global Mini Limit Switches Market Revenue (USD Billion) Forecast, by Segment 2, 2018-2029
      Table 3: Global Mini Limit Switches Market Revenue (USD Billion) Forecast, by Segment 3, 2018-2029
      Table 4: Global Mini Limit Switches Market Revenue (USD Billion) Forecast, by Region, 2018-2029
      Table 5: North America Mini Limit Switches Market Revenue (USD Billion) Forecast, by Segment 1, 2018-2029
      Table 6: North America Mini Limit Switches Market Revenue (USD Billion) Forecast, by Segment 2, 2018-2029
      Table 7: North America Mini Limit Switches Market Revenue (USD Billion) Forecast, by Segment 3, 2018-2029
      Table 8: North America Mini Limit Switches Market Revenue (USD Billion) Forecast, by Country, 2018-2029
      Table 9: Europe Mini Limit Switches Market Revenue (USD Billion) Forecast, by Segment 1, 2018-2029
      Table 10: Europe Mini Limit Switches Market Revenue (USD Billion) Forecast, by Segment 2, 2018-2029
      Table 11: Europe Mini Limit Switches Market Revenue (USD Billion) Forecast, by Segment 3, 2018-2029
      Table 12: Europe Mini Limit Switches Market Revenue (USD Billion) Forecast, by Country, 2018-2029
      Table 13: Latin America Mini Limit Switches Market Revenue (USD Billion) Forecast, by Segment 1, 2018-2029
      Table 14: Latin America Mini Limit Switches Market Revenue (USD Billion) Forecast, by Segment 2, 2018-2029
      Table 15: Latin America Mini Limit Switches Market Revenue (USD Billion) Forecast, by Segment 3, 2018-2029
      Table 16: Latin America Mini Limit Switches Market Revenue (USD Billion) Forecast, by Country, 2018-2029
      Table 17: Asia Pacific Mini Limit Switches Market Revenue (USD Billion) Forecast, by Segment 1, 2018-2029
      Table 18: Asia Pacific Mini Limit Switches Market Revenue (USD Billion) Forecast, by Segment 2, 2018-2029
      Table 19: Asia Pacific Mini Limit Switches Market Revenue (USD Billion) Forecast, by Segment 3, 2018-2029
      Table 20: Asia Pacific Mini Limit Switches Market Revenue (USD Billion) Forecast, by Country, 2018-2029
      Table 21: Middle East & Africa Mini Limit Switches Market Revenue (USD Billion) Forecast, by Segment 1, 2018-2029
      Table 22: Middle East & Africa Mini Limit Switches Market Revenue (USD Billion) Forecast, by Segment 2, 2018-2029
      Table 23: Middle East & Africa Mini Limit Switches Market Revenue (USD Billion) Forecast, by Segment 3, 2018-2029
      Table 24: Middle East & Africa Mini Limit Switches Market Revenue (USD Billion) Forecast, by Country, 2018-2029
      Research Process

      Data Library Research are conducted by industry experts who offer insight on industry structure, market segmentations technology assessment and competitive landscape (CL), and penetration, as well as on emerging trends. Their analysis is based on primary interviews (~ 80%) and secondary research (~ 20%) as well as years of professional expertise in their respective industries. Adding to this, by analysing historical trends and current market positions, our analysts predict where the market will be headed for the next five years. Furthermore, the varying trends of segment & categories geographically presented are also studied and the estimated based on the primary & secondary research.

      In this particular report from the supply side Data Library Research has conducted primary surveys (interviews) with the key level executives (VP, CEO’s, Marketing Director, Business Development Manager and SOFT) of the companies that active & prominent as well as the midsized organization

      FIGURE 1: DLR RESEARH PROCESS

      research-methodology1

      Primary Research

      Extensive primary research was conducted to gain a deeper insight of the market and industry performance. The analysis is based on both primary and secondary research as well as years of professional expertise in the respective industries.

      In addition to analysing current and historical trends, our analysts predict where the market is headed over the next five years.

      It varies by segment for these categories geographically presented in the list of market tables. Speaking about this particular report we have conducted primary surveys (interviews) with the key level executives (VP, CEO’s, Marketing Director, Business Development Manager and many more) of the major players active in the market.

      Secondary Research

      Secondary research was mainly used to collect and identify information useful for the extensive, technical, market-oriented, and Friend’s study of the Global Extra Neutral Alcohol. It was also used to obtain key information about major players, market classification and segmentation according to the industry trends, geographical markets, and developments related to the market and technology perspectives. For this study, analysts have gathered information from various credible sources, such as annual reports, sec filings, journals, white papers, SOFT presentations, and company web sites.

      Market Size Estimation

      Both, top-down and bottom-up approaches were used to estimate and validate the size of the Global market and to estimate the size of various other dependent submarkets in the overall Extra Neutral Alcohol. The key players in the market were identified through secondary research and their market contributions in the respective geographies were determined through primary and secondary research.

      Forecast Model

      research-methodology2

      Happy to Assist You

      If you have a question?

      info@datalibraryresearch.com

      IND : +91 955 279 0357

      Browse Related Reports