Multi-view 3D Reconstruction Technology Market Overview and Analysis
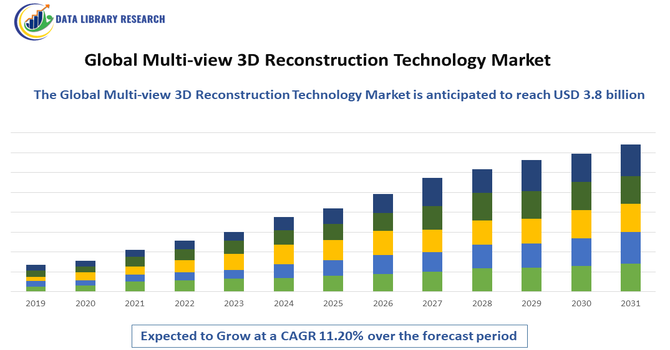
- The Global Multi-view 3D Reconstruction Technology Market size was estimated at USD 2.2 billion in 2025 and is projected to reach USD 3.8 billion by 2032, growing with a CAGR of 11.20% from 2025 to 2032.
Get Complete Analysis Of The Report - Download Updated Free Sample PDF
The Global Multi-view 3D Reconstruction Technology Market refers to the worldwide industry involved in developing and commercializing technologies that create accurate three-dimensional models from multiple 2D images or viewpoints. This market includes software, hardware, and services used across sectors like AR/VR, robotics, mapping, construction, and entertainment. Driven by advances in imaging, AI, and computational power, it supports simulations, digital twins, and real-world spatial understanding applications.
Multi-view 3D Reconstruction Technology Market Latest Trends
The market is witnessing rapid innovation driven by integration with artificial intelligence and machine learning, which improves reconstruction accuracy and processing speed. Growing adoption in autonomous vehicles, construction, cultural heritage preservation, and AR/VR applications is expanding use cases. Cloud-based solutions and edge computing are enabling real-time 3D model generation. Advances in multi-sensor fusion—combining LiDAR, photogrammetry, and depth cameras—enhance detail and reliability. Additionally, open-source frameworks and SDKs are lowering entry barriers for developers. Demand for high-resolution and scalable 3D content, especially in gaming and digital twin ecosystems, is expected to continue fueling market growth.
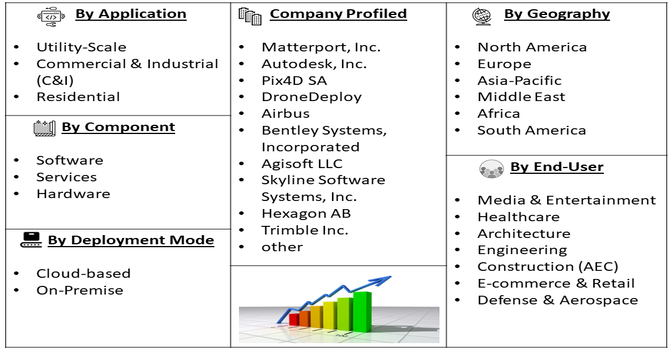
Segmentation: The Multi-view 3D Reconstruction market is segmented by Component (Software, Services and Hardware), Deployment Mode (Cloud-based and On-Premise), Method (Active Reconstruction and Passive Reconstruction), End-User Industry (Media & Entertainment, Healthcare, Architecture, Engineering, and Construction (AEC), E-commerce & Retail and Defense & Aerospace) and Geography (North America, Europe, Asia-Pacific, Middle East and Africa, and South America). The report provides the value (in USD million) for the above segments.
For Detailed Market Segmentation - Get a Free Sample PDF
Market Drivers:
- Rising Adoption of Digital Twins and Smart Infrastructure
The growing adoption of digital twins and smart infrastructure is a major driver of the global multi-view 3D reconstruction technology market. Governments and enterprises increasingly rely on accurate 3D models to plan, monitor, and manage assets such as buildings, transportation networks, and utilities. Multi-view 3D reconstruction enables precise spatial visualization, structural analysis, and lifecycle management. Integration with IoT, BIM, and GIS platforms further enhances its value for real-time monitoring and predictive maintenance. As urbanization accelerates and smart city initiatives expand worldwide, demand for scalable and high-fidelity 3D reconstruction solutions continues to rise steadily.
- Expansion of AR/VR, Metaverse, and Immersive Applications
The rapid expansion of AR/VR technologies and metaverse-related applications is significantly driving demand for multi-view 3D reconstruction solutions. High-quality 3D content is essential for immersive virtual environments in gaming, training, retail, healthcare, and entertainment. For instance, in September 2025, an article published in journal Sensor, reported that advancements in 3D reconstruction, driven by NeRF and 3D Gaussian Splatting, significantly enhance the realism, efficiency, and scalability of AR/VR and metaverse environments. Improved novel view synthesis enables high-quality immersive experiences from limited data, accelerating adoption of virtual worlds, digital twins, and interactive applications across industries.
Multi-view reconstruction allows realistic digitization of physical objects and spaces, enabling interactive and immersive experiences. Advancements in AI-driven rendering and real-time processing have lowered production costs and improved output quality. As enterprises invest in virtual collaboration, simulation-based training, and experiential marketing, the need for efficient and accurate 3D reconstruction technologies is expected to grow strongly.
Market Restraints:
- High Computational Requirements and Implementation Costs
High computational requirements and implementation costs remain a key restraint in the global multi-view 3D reconstruction technology market. Processing large volumes of multi-view image data demands advanced hardware, significant storage, and high-performance computing resources, which can be costly for small and medium-sized enterprises. Additionally, integrating reconstruction solutions with existing workflows and systems often requires specialized expertise and training. Despite progress in cloud computing and AI optimization, cost sensitivity and technical complexity still limit adoption in price-sensitive regions. These challenges may slow market penetration, particularly in developing economies with limited digital infrastructure.
Socioeconomic Impact on Multi-view 3D Reconstruction Technology Market
Multi-view 3D reconstruction technology enhances productivity and safety across industries, reducing manual survey costs and enabling precise planning in construction and infrastructure. It supports better decision-making in environmental monitoring, disaster response, and urban planning, potentially improving community resilience. In education and cultural preservation, realistic 3D models democratize access to heritage sites and scientific exploration. However, it may disrupt traditional labor roles in mapping and modeling, requiring workforce upskilling. Broader adoption can stimulate economic growth within tech sectors and spur innovation. Equitable access to these tools can bridge digital divides, yet disparities in infrastructure and skills might deepen socioeconomic gaps without targeted policy support.
Segmental Analysis:
- Software segment is expected to witness highest growth over the forecast period
The software segment is expected to witness the highest growth over the forecast period due to rapid advancements in AI-driven algorithms, machine learning, and computer vision. Software solutions enable efficient multi-view 3D reconstruction without heavy reliance on proprietary hardware, making them more scalable and cost-effective. Increasing demand for customizable, interoperable, and industry-specific software platforms across construction, healthcare, entertainment, and robotics is accelerating adoption. Continuous updates, subscription-based models, and integration with BIM, CAD, and GIS tools further support growth. As organizations prioritize flexibility, automation, and faster processing, software-based 3D reconstruction solutions are projected to dominate market expansion.
- Cloud-based segment is expected to witness highest growth over the forecast period
The cloud-based segment is expected to witness the highest growth over the forecast period due to its scalability, cost efficiency, and real-time processing capabilities. Cloud platforms enable organizations to handle large volumes of image data and complex reconstruction tasks without investing in expensive on-premise infrastructure. Improved internet connectivity and advancements in edge and hybrid cloud computing enhance performance and accessibility. Cloud-based solutions also support collaboration, remote access, and seamless updates, making them attractive for enterprises and SMEs alike. As demand grows for real-time visualization, digital twins, and distributed workflows, cloud deployment is becoming the preferred choice across industries.
- Active Reconstruction segment is expected to witness highest growth over the forecast period
The active reconstruction segment is expected to witness the highest growth over the forecast period, driven by increasing adoption of technologies such as LiDAR, structured light, and depth sensors. Active reconstruction techniques provide higher accuracy, better depth perception, and improved performance in low-texture or low-light environments compared to passive methods. These capabilities are critical for applications in autonomous vehicles, robotics, industrial inspection, and healthcare imaging. Ongoing advancements in sensor technology and cost reduction are further boosting adoption. As industries demand precise and real-time 3D data for automation and safety-critical applications, active reconstruction solutions are gaining strong market traction.
- Healthcare segment is expected to witness highest growth over the forecast period
The healthcare segment is expected to witness the highest growth over the forecast period due to rising demand for precision diagnostics, surgical planning, and personalized treatment. Multi-view 3D reconstruction enables accurate visualization of anatomical structures from medical imaging data, supporting minimally invasive surgeries and advanced medical training. Growth in telemedicine, digital health platforms, and AI-assisted diagnostics further fuels adoption. Additionally, 3D reconstruction is increasingly used in prosthetics design, orthopedics, and dental applications. As healthcare providers focus on improving clinical outcomes and operational efficiency, investments in advanced imaging and 3D reconstruction technologies are expected to accelerate significantly.
- North America region is expected to witness highest growth over the forecast period
North America is expected to witness the highest growth over the forecast period due to strong technological infrastructure, high R&D investments, and early adoption of advanced digital technologies.
The region benefits from the presence of leading technology companies, research institutions, and startups specializing in AI, AR/VR, and 3D imaging. For instance, February 2025, Siemens’ integration of RealityCapture into its Xcelerator portfolio streamlines scan-to-simulation workflows for manufacturing users. This move expands industrial adoption of multi-view 3D reconstruction, enabling seamless digital twin creation and simulation, and driving demand for integrated, end-to-end reconstruction platforms within advanced manufacturing ecosystems.
Similarly, in January 2025, Hesai Technology’s major LiDAR price reduction improves affordability of high-density scanning systems. Lower sensor costs expand access for drone and mobile-mapping providers, accelerating data acquisition for multi-view 3D reconstruction. This development supports broader market penetration, particularly among small operators and cost-sensitive applications globally.
Increasing adoption across healthcare, construction, autonomous vehicles, and entertainment sectors is driving demand. Supportive government initiatives, high cloud penetration, and robust digital transformation strategies further enhance growth prospects. Additionally, strong demand for digital twins and smart infrastructure positions North America as a key growth hub in the global market.
| Report Matrics |
Details |
| Market Size Value |
USD 3.8 billion |
| Growth Rate |
CAGR of 11.20 % |
| Forecast |
2026-2033 |
| Historical data |
2021-2024 |
| Base Year |
2025 |
| Report Coverage |
Forecasted revenue, company rating, competitive environment, growth drivers, and trends |
| Segment Coverage |
Type, Application, End-User, Geography |
| Regional Scope |
North America, Europe, Asia Pacific, Middle East |
| Customized scope |
Free customization of reports (With 3 months Analysis Support ) |
| To Learn More About This Report |
Request a Free Sample Copy |
Multi-view 3D Reconstruction Technology Market Competitive Landscape
The competitive landscape features established tech giants, specialized startups, and open-source contributors. Major players focus on R&D to enhance algorithmic precision, real-time processing, and integration with complementary technologies like LiDAR and AI. Competitive differentiation arises through proprietary software platforms, hardware ecosystems, and industry-specific solutions. Strategic partnerships and acquisitions are common as companies seek to broaden capabilities and market reach. Firms with strong developer communities and comprehensive SDK offerings gain traction among enterprise and academic users. Pricing models vary from subscription to usage-based frameworks, fostering competition on value delivery. Intellectual property in efficient reconstruction methods and scalable deployment remains a key competitive factor.
The major players for this market are:
- Matterport, Inc.
- Autodesk, Inc.
- Pix4D SA
- DroneDeploy
- Airbus
- Bentley Systems, Incorporated
- Agisoft LLC
- Skyline Software Systems, Inc.
- Hexagon AB
- Trimble Inc.
- SZ DJI Technology Co., Ltd.
- PhotoModeler Technologies
- Photometrix
- 4DAGE Technology
- Realsee
- Zhongqu Technology
- Yiwo Technology
- Feibai 3D Technology
- Dexhin
- EDDA Technology
Recent Development
- In November 2025, Hexagon AB’s launch of HxGN LiveView strengthens real-time, browser-based access to LiDAR data, significantly reducing data transfer burdens. This development accelerates collaborative multi-view 3D reconstruction workflows, improves productivity for distributed teams, and supports wider adoption of edge-to-cloud reconstruction solutions across infrastructure, surveying, and industrial applications.
- In August 2025, Autodesk’s ReCap Pro 2026 Beta enhances cloud-GPU orchestration, substantially reducing processing times for large-scale image datasets. This advancement boosts scalability and efficiency in multi-view 3D reconstruction, encouraging adoption for complex projects and reinforcing cloud-based software as a critical enabler for high-volume, high-resolution 3D modeling.
Frequently Asked Questions (FAQ) :
Q1. What are the main growth-driving factors for this market?
The primary driver is the surging demand for 3D content in entertainment, gaming, and e-commerce. As retailers adopt "virtual try-ons" and filmmakers use digital doubles, the need for fast, accurate 3D modeling grows. Additionally, advancements in AI and computer vision are making it easier to automate the reconstruction process from standard photos.
Q2. What are the main restraining factors for this market?
The high computational power required to process multiple high-resolution images into a single 3D model is a major hurdle. Furthermore, the technology often struggles with transparent or reflective surfaces, leading to "noise" or inaccuracies. High software licensing costs and the need for specialized technical expertise also limit adoption for smaller businesses.
Q3. Which segment is expected to witness high growth?
The Healthcare and Medical Imaging segment is expected to see the highest growth. Multi-view 3D reconstruction is becoming essential for surgical planning, prosthetic design, and 3D organ modeling. The ability to turn standard 2D scans into interactive 3D visualizations allows doctors to perform more precise procedures and improves patient outcomes.
Q4. Who are the top major players for this market?
Leading the market are global tech giants and specialized 3D software firms. Key players include Autodesk, Adobe (via Substance), Bentley Systems, and Matterport. These companies provide the professional-grade algorithms and cloud platforms necessary to turn massive sets of visual data into high-fidelity, scalable 3D environments and objects.
Q5. Which country is the largest player?
The United States is the largest player in this market. Its dominance is fueled by a massive tech sector, a world-leading media and entertainment industry (Hollywood and major gaming studios), and significant investments in AR/VR research. The presence of major software developers and high industrial demand for 3D digital twins keeps it at the forefront.
List of Figures
Figure 1: Global Multi-view 3D Reconstruction Technology Market Revenue Breakdown (USD Billion, %) by Region, 2022 & 2029
Figure 2: Global Multi-view 3D Reconstruction Technology Market Value Share (%), By Segment 1, 2022 & 2029
Figure 3: Global Multi-view 3D Reconstruction Technology Market Forecast (USD Billion), by Sub-Segment 1, 2018-2029
Figure 4: Global Multi-view 3D Reconstruction Technology Market Forecast (USD Billion), by Sub-Segment 2, 2018-2029
Figure 5: Global Multi-view 3D Reconstruction Technology Market Value Share (%), By Segment 2, 2022 & 2029
Figure 6: Global Multi-view 3D Reconstruction Technology Market Forecast (USD Billion), by Sub-Segment 1, 2018-2029
Figure 7: Global Multi-view 3D Reconstruction Technology Market Forecast (USD Billion), by Sub-Segment 2, 2018-2029
Figure 8: Global Multi-view 3D Reconstruction Technology Market Forecast (USD Billion), by Sub-Segment 3, 2018-2029
Figure 9: Global Multi-view 3D Reconstruction Technology Market Forecast (USD Billion), by Others, 2018-2029
Figure 10: Global Multi-view 3D Reconstruction Technology Market Value Share (%), By Segment 3, 2022 & 2029
Figure 11: Global Multi-view 3D Reconstruction Technology Market Forecast (USD Billion), by Sub-Segment 1, 2018-2029
Figure 12: Global Multi-view 3D Reconstruction Technology Market Forecast (USD Billion), by Sub-Segment 2, 2018-2029
Figure 13: Global Multi-view 3D Reconstruction Technology Market Forecast (USD Billion), by Sub-Segment 3, 2018-2029
Figure 14: Global Multi-view 3D Reconstruction Technology Market Forecast (USD Billion), by Others, 2018-2029
Figure 15: Global Multi-view 3D Reconstruction Technology Market Value (USD Billion), by Region, 2022 & 2029
Figure 16: North America Multi-view 3D Reconstruction Technology Market Value Share (%), By Segment 1, 2022 & 2029
Figure 17: North America Multi-view 3D Reconstruction Technology Market Forecast (USD Billion), by Sub-Segment 1, 2018-2029
Figure 18: North America Multi-view 3D Reconstruction Technology Market Forecast (USD Billion), by Sub-Segment 2, 2018-2029
Figure 19: North America Multi-view 3D Reconstruction Technology Market Value Share (%), By Segment 2, 2022 & 2029
Figure 20: North America Multi-view 3D Reconstruction Technology Market Forecast (USD Billion), by Sub-Segment 1, 2018-2029
Figure 21: North America Multi-view 3D Reconstruction Technology Market Forecast (USD Billion), by Sub-Segment 2, 2018-2029
Figure 22: North America Multi-view 3D Reconstruction Technology Market Forecast (USD Billion), by Sub-Segment 3, 2018-2029
Figure 23: North America Multi-view 3D Reconstruction Technology Market Forecast (USD Billion), by Others, 2018-2029
Figure 24: North America Multi-view 3D Reconstruction Technology Market Value Share (%), By Segment 3, 2022 & 2029
Figure 25: North America Multi-view 3D Reconstruction Technology Market Forecast (USD Billion), by Sub-Segment 1, 2018-2029
Figure 26: North America Multi-view 3D Reconstruction Technology Market Forecast (USD Billion), by Sub-Segment 2, 2018-2029
Figure 27: North America Multi-view 3D Reconstruction Technology Market Forecast (USD Billion), by Sub-Segment 3, 2018-2029
Figure 28: North America Multi-view 3D Reconstruction Technology Market Forecast (USD Billion), by Others, 2018-2029
Figure 29: North America Multi-view 3D Reconstruction Technology Market Forecast (USD Billion), by U.S., 2018-2029
Figure 30: North America Multi-view 3D Reconstruction Technology Market Forecast (USD Billion), by Canada, 2018-2029
Figure 31: Latin America Multi-view 3D Reconstruction Technology Market Value Share (%), By Segment 1, 2022 & 2029
Figure 32: Latin America Multi-view 3D Reconstruction Technology Market Forecast (USD Billion), by Sub-Segment 1, 2018-2029
Figure 33: Latin America Multi-view 3D Reconstruction Technology Market Forecast (USD Billion), by Sub-Segment 2, 2018-2029
Figure 34: Latin America Multi-view 3D Reconstruction Technology Market Value Share (%), By Segment 2, 2022 & 2029
Figure 35: Latin America Multi-view 3D Reconstruction Technology Market Forecast (USD Billion), by Sub-Segment 1, 2018-2029
Figure 36: Latin America Multi-view 3D Reconstruction Technology Market Forecast (USD Billion), by Sub-Segment 2, 2018-2029
Figure 37: Latin America Multi-view 3D Reconstruction Technology Market Forecast (USD Billion), by Sub-Segment 3, 2018-2029
Figure 38: Latin America Multi-view 3D Reconstruction Technology Market Forecast (USD Billion), by Others, 2018-2029
Figure 39: Latin America Multi-view 3D Reconstruction Technology Market Value Share (%), By Segment 3, 2022 & 2029
Figure 40: Latin America Multi-view 3D Reconstruction Technology Market Forecast (USD Billion), by Sub-Segment 1, 2018-2029
Figure 41: Latin America Multi-view 3D Reconstruction Technology Market Forecast (USD Billion), by Sub-Segment 2, 2018-2029
Figure 42: Latin America Multi-view 3D Reconstruction Technology Market Forecast (USD Billion), by Sub-Segment 3, 2018-2029
Figure 43: Latin America Multi-view 3D Reconstruction Technology Market Forecast (USD Billion), by Others, 2018-2029
Figure 44: Latin America Multi-view 3D Reconstruction Technology Market Forecast (USD Billion), by Brazil, 2018-2029
Figure 45: Latin America Multi-view 3D Reconstruction Technology Market Forecast (USD Billion), by Mexico, 2018-2029
Figure 46: Latin America Multi-view 3D Reconstruction Technology Market Forecast (USD Billion), by Rest of Latin America, 2018-2029
Figure 47: Europe Multi-view 3D Reconstruction Technology Market Value Share (%), By Segment 1, 2022 & 2029
Figure 48: Europe Multi-view 3D Reconstruction Technology Market Forecast (USD Billion), by Sub-Segment 1, 2018-2029
Figure 49: Europe Multi-view 3D Reconstruction Technology Market Forecast (USD Billion), by Sub-Segment 2, 2018-2029
Figure 50: Europe Multi-view 3D Reconstruction Technology Market Value Share (%), By Segment 2, 2022 & 2029
Figure 51: Europe Multi-view 3D Reconstruction Technology Market Forecast (USD Billion), by Sub-Segment 1, 2018-2029
Figure 52: Europe Multi-view 3D Reconstruction Technology Market Forecast (USD Billion), by Sub-Segment 2, 2018-2029
Figure 53: Europe Multi-view 3D Reconstruction Technology Market Forecast (USD Billion), by Sub-Segment 3, 2018-2029
Figure 54: Europe Multi-view 3D Reconstruction Technology Market Forecast (USD Billion), by Others, 2018-2029
Figure 55: Europe Multi-view 3D Reconstruction Technology Market Value Share (%), By Segment 3, 2022 & 2029
Figure 56: Europe Multi-view 3D Reconstruction Technology Market Forecast (USD Billion), by Sub-Segment 1, 2018-2029
Figure 57: Europe Multi-view 3D Reconstruction Technology Market Forecast (USD Billion), by Sub-Segment 2, 2018-2029
Figure 58: Europe Multi-view 3D Reconstruction Technology Market Forecast (USD Billion), by Sub-Segment 3, 2018-2029
Figure 59: Europe Multi-view 3D Reconstruction Technology Market Forecast (USD Billion), by Others, 2018-2029
Figure 60: Europe Multi-view 3D Reconstruction Technology Market Forecast (USD Billion), by U.K., 2018-2029
Figure 61: Europe Multi-view 3D Reconstruction Technology Market Forecast (USD Billion), by Germany, 2018-2029
Figure 62: Europe Multi-view 3D Reconstruction Technology Market Forecast (USD Billion), by France, 2018-2029
Figure 63: Europe Multi-view 3D Reconstruction Technology Market Forecast (USD Billion), by Italy, 2018-2029
Figure 64: Europe Multi-view 3D Reconstruction Technology Market Forecast (USD Billion), by Spain, 2018-2029
Figure 65: Europe Multi-view 3D Reconstruction Technology Market Forecast (USD Billion), by Russia, 2018-2029
Figure 66: Europe Multi-view 3D Reconstruction Technology Market Forecast (USD Billion), by Rest of Europe, 2018-2029
Figure 67: Asia Pacific Multi-view 3D Reconstruction Technology Market Value Share (%), By Segment 1, 2022 & 2029
Figure 68: Asia Pacific Multi-view 3D Reconstruction Technology Market Forecast (USD Billion), by Sub-Segment 1, 2018-2029
Figure 69: Asia Pacific Multi-view 3D Reconstruction Technology Market Forecast (USD Billion), by Sub-Segment 2, 2018-2029
Figure 70: Asia Pacific Multi-view 3D Reconstruction Technology Market Value Share (%), By Segment 2, 2022 & 2029
Figure 71: Asia Pacific Multi-view 3D Reconstruction Technology Market Forecast (USD Billion), by Sub-Segment 1, 2018-2029
Figure 72: Asia Pacific Multi-view 3D Reconstruction Technology Market Forecast (USD Billion), by Sub-Segment 2, 2018-2029
Figure 73: Asia Pacific Multi-view 3D Reconstruction Technology Market Forecast (USD Billion), by Sub-Segment 3, 2018-2029
Figure 74: Asia Pacific Multi-view 3D Reconstruction Technology Market Forecast (USD Billion), by Others, 2018-2029
Figure 75: Asia Pacific Multi-view 3D Reconstruction Technology Market Value Share (%), By Segment 3, 2022 & 2029
Figure 76: Asia Pacific Multi-view 3D Reconstruction Technology Market Forecast (USD Billion), by Sub-Segment 1, 2018-2029
Figure 77: Asia Pacific Multi-view 3D Reconstruction Technology Market Forecast (USD Billion), by Sub-Segment 2, 2018-2029
Figure 78: Asia Pacific Multi-view 3D Reconstruction Technology Market Forecast (USD Billion), by Sub-Segment 3, 2018-2029
Figure 79: Asia Pacific Multi-view 3D Reconstruction Technology Market Forecast (USD Billion), by Others, 2018-2029
Figure 80: Asia Pacific Multi-view 3D Reconstruction Technology Market Forecast (USD Billion), by China, 2018-2029
Figure 81: Asia Pacific Multi-view 3D Reconstruction Technology Market Forecast (USD Billion), by India, 2018-2029
Figure 82: Asia Pacific Multi-view 3D Reconstruction Technology Market Forecast (USD Billion), by Japan, 2018-2029
Figure 83: Asia Pacific Multi-view 3D Reconstruction Technology Market Forecast (USD Billion), by Australia, 2018-2029
Figure 84: Asia Pacific Multi-view 3D Reconstruction Technology Market Forecast (USD Billion), by Southeast Asia, 2018-2029
Figure 85: Asia Pacific Multi-view 3D Reconstruction Technology Market Forecast (USD Billion), by Rest of Asia Pacific, 2018-2029
Figure 86: Middle East & Africa Multi-view 3D Reconstruction Technology Market Value Share (%), By Segment 1, 2022 & 2029
Figure 87: Middle East & Africa Multi-view 3D Reconstruction Technology Market Forecast (USD Billion), by Sub-Segment 1, 2018-2029
Figure 88: Middle East & Africa Multi-view 3D Reconstruction Technology Market Forecast (USD Billion), by Sub-Segment 2, 2018-2029
Figure 89: Middle East & Africa Multi-view 3D Reconstruction Technology Market Value Share (%), By Segment 2, 2022 & 2029
Figure 90: Middle East & Africa Multi-view 3D Reconstruction Technology Market Forecast (USD Billion), by Sub-Segment 1, 2018-2029
Figure 91: Middle East & Africa Multi-view 3D Reconstruction Technology Market Forecast (USD Billion), by Sub-Segment 2, 2018-2029
Figure 92: Middle East & Africa Multi-view 3D Reconstruction Technology Market Forecast (USD Billion), by Sub-Segment 3, 2018-2029
Figure 93: Middle East & Africa Multi-view 3D Reconstruction Technology Market Forecast (USD Billion), by Others, 2018-2029
Figure 94: Middle East & Africa Multi-view 3D Reconstruction Technology Market Value Share (%), By Segment 3, 2022 & 2029
Figure 95: Middle East & Africa Multi-view 3D Reconstruction Technology Market Forecast (USD Billion), by Sub-Segment 1, 2018-2029
Figure 96: Middle East & Africa Multi-view 3D Reconstruction Technology Market Forecast (USD Billion), by Sub-Segment 2, 2018-2029
Figure 97: Middle East & Africa Multi-view 3D Reconstruction Technology Market Forecast (USD Billion), by Sub-Segment 3, 2018-2029
Figure 98: Middle East & Africa Multi-view 3D Reconstruction Technology Market Forecast (USD Billion), by Others, 2018-2029
Figure 99: Middle East & Africa Multi-view 3D Reconstruction Technology Market Forecast (USD Billion), by GCC, 2018-2029
Figure 100: Middle East & Africa Multi-view 3D Reconstruction Technology Market Forecast (USD Billion), by South Africa, 2018-2029
Figure 101: Middle East & Africa Multi-view 3D Reconstruction Technology Market Forecast (USD Billion), by Rest of Middle East & Africa, 2018-2029
List of Tables
Table 1: Global Multi-view 3D Reconstruction Technology Market Revenue (USD Billion) Forecast, by Segment 1, 2018-2029
Table 2: Global Multi-view 3D Reconstruction Technology Market Revenue (USD Billion) Forecast, by Segment 2, 2018-2029
Table 3: Global Multi-view 3D Reconstruction Technology Market Revenue (USD Billion) Forecast, by Segment 3, 2018-2029
Table 4: Global Multi-view 3D Reconstruction Technology Market Revenue (USD Billion) Forecast, by Region, 2018-2029
Table 5: North America Multi-view 3D Reconstruction Technology Market Revenue (USD Billion) Forecast, by Segment 1, 2018-2029
Table 6: North America Multi-view 3D Reconstruction Technology Market Revenue (USD Billion) Forecast, by Segment 2, 2018-2029
Table 7: North America Multi-view 3D Reconstruction Technology Market Revenue (USD Billion) Forecast, by Segment 3, 2018-2029
Table 8: North America Multi-view 3D Reconstruction Technology Market Revenue (USD Billion) Forecast, by Country, 2018-2029
Table 9: Europe Multi-view 3D Reconstruction Technology Market Revenue (USD Billion) Forecast, by Segment 1, 2018-2029
Table 10: Europe Multi-view 3D Reconstruction Technology Market Revenue (USD Billion) Forecast, by Segment 2, 2018-2029
Table 11: Europe Multi-view 3D Reconstruction Technology Market Revenue (USD Billion) Forecast, by Segment 3, 2018-2029
Table 12: Europe Multi-view 3D Reconstruction Technology Market Revenue (USD Billion) Forecast, by Country, 2018-2029
Table 13: Latin America Multi-view 3D Reconstruction Technology Market Revenue (USD Billion) Forecast, by Segment 1, 2018-2029
Table 14: Latin America Multi-view 3D Reconstruction Technology Market Revenue (USD Billion) Forecast, by Segment 2, 2018-2029
Table 15: Latin America Multi-view 3D Reconstruction Technology Market Revenue (USD Billion) Forecast, by Segment 3, 2018-2029
Table 16: Latin America Multi-view 3D Reconstruction Technology Market Revenue (USD Billion) Forecast, by Country, 2018-2029
Table 17: Asia Pacific Multi-view 3D Reconstruction Technology Market Revenue (USD Billion) Forecast, by Segment 1, 2018-2029
Table 18: Asia Pacific Multi-view 3D Reconstruction Technology Market Revenue (USD Billion) Forecast, by Segment 2, 2018-2029
Table 19: Asia Pacific Multi-view 3D Reconstruction Technology Market Revenue (USD Billion) Forecast, by Segment 3, 2018-2029
Table 20: Asia Pacific Multi-view 3D Reconstruction Technology Market Revenue (USD Billion) Forecast, by Country, 2018-2029
Table 21: Middle East & Africa Multi-view 3D Reconstruction Technology Market Revenue (USD Billion) Forecast, by Segment 1, 2018-2029
Table 22: Middle East & Africa Multi-view 3D Reconstruction Technology Market Revenue (USD Billion) Forecast, by Segment 2, 2018-2029
Table 23: Middle East & Africa Multi-view 3D Reconstruction Technology Market Revenue (USD Billion) Forecast, by Segment 3, 2018-2029
Table 24: Middle East & Africa Multi-view 3D Reconstruction Technology Market Revenue (USD Billion) Forecast, by Country, 2018-2029
Research Process
Data Library Research are conducted by industry experts who offer insight on
industry structure, market segmentations technology assessment and competitive landscape (CL), and penetration, as well as on emerging trends. Their analysis is based on primary interviews (~ 80%) and secondary research (~ 20%) as well as years of professional expertise in their respective industries. Adding to this, by analysing historical trends and current market positions, our analysts predict where the market will be headed for the next five years. Furthermore, the varying trends of segment & categories geographically presented are also studied and the estimated based on the primary & secondary research.
In this particular report from the supply side Data Library Research has conducted primary surveys (interviews) with the key level executives (VP, CEO’s, Marketing Director, Business Development Manager
and SOFT) of the companies that active & prominent as well as the midsized organization
FIGURE 1: DLR RESEARH PROCESS
![research-methodology1]()
Primary Research
Extensive primary research was conducted to gain a deeper insight of the market and industry performance. The analysis is based on both primary and secondary research as well as years of professional expertise in the respective industries.
In addition to analysing current and historical trends, our analysts predict where the market is headed over the next five years.
It varies by segment for these categories geographically presented in the list of market tables. Speaking about this particular report we have conducted primary surveys (interviews) with the key level executives (VP, CEO’s, Marketing Director, Business Development Manager and many more) of the major players active in the market.
Secondary Research
Secondary research was mainly used to collect and identify information useful for the extensive, technical, market-oriented, and Friend’s study of the Global Extra Neutral Alcohol. It was also used to obtain key information about major players, market classification and segmentation according to the industry trends, geographical markets, and developments related to the market and technology perspectives. For this study, analysts have gathered information from various credible sources, such as annual reports, sec filings, journals, white papers, SOFT presentations, and company web sites.
Market Size Estimation
Both, top-down and bottom-up approaches were used to estimate and validate the size of the Global market and to estimate the size of various other dependent submarkets in the overall Extra Neutral Alcohol. The key players in the market were identified through secondary research and their market contributions in the respective geographies were determined through primary and secondary research.
Forecast Model
![research-methodology2]()