Neurology Digital Therapeutics Market Overview and Analysis
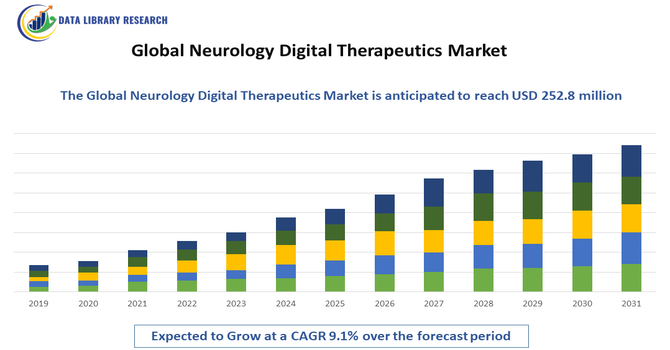
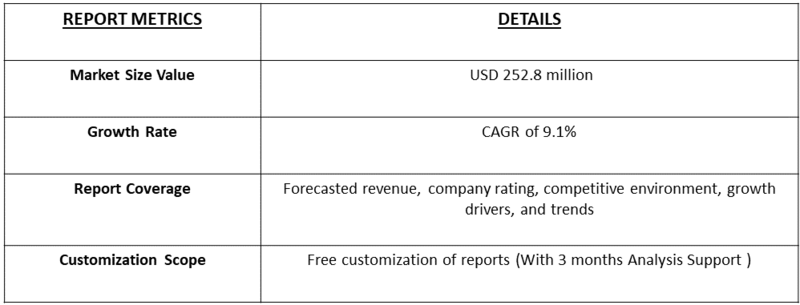
- Neurology Digital Therapeutics Market Size is expected to reach USD 565.6 million by 2035 from USD 252.8 million in 2025, at a CAGR of 9.1% from 2025-2032.
Get Complete Analysis Of The Report - Download Updated Free Sample PDF
The Global Neurology Digital Therapeutics Market refers to the worldwide industry of evidence-based software-driven interventions designed to prevent, manage or treat neurological disorders (such as Alzheimer’s disease, Parkinson’s disease, epilepsy, migraine and multiple sclerosis) via digital platforms (mobile apps, web based programs, wearables). It covers both device and software solutions, delivered in clinical and home settings.
The Global Neurology Digital Therapeutics Market has been driven by several key factors. The rising prevalence of neurological disorders, including Alzheimer’s, Parkinson’s, epilepsy, and multiple sclerosis, has increased the demand for innovative treatment solutions. Growing adoption of digital health technologies, including mobile apps, wearables, and telemedicine, has enabled remote monitoring and personalized therapy.
Neurology Digital Therapeutics Market Latest Trends
The global neurology digital therapeutics market has been shaped by trends such as the integration of artificial intelligence (AI) and machine learning to personalize interventions and monitor neurological conditions in real time. Remote monitoring and telehealth solutions have expanded access to therapy, enabling patients with neurological disorders to engage from home and improving adherence. Wearables, mobile applications, and software-as-a-medical-device (SaMD) models are increasingly applied to conditions like Alzheimer’s, Parkinson’s disease, epilepsy, and migraines. Additionally, the shift toward value-based care and patient-centric approaches is driving the adoption of digital therapeutics as a complement to traditional treatments.
Segmentation: The Global Neurology Digital Therapeutics (DTx) Market can be systematically segmented by Component (Software, Hardware and Services), Application (Cognitive & Neuro-Developmental Disorders, Neurodegenerative Disorders, Mental & Behavioral Health, Pain Management & Rehabilitation, and Other Neurological Conditions), End-User (Patients/Consumers, Healthcare Providers, Payers (Insurance/Government)), and Geography (North America, Europe, Asia-Pacific, Middle East and Africa, and South America). The report provides the value (in USD million) for the above segments.

For Detailed Market Segmentation - Get a Free Sample PDF
Market Drivers:
- Rising Prevalence of Neurological Disorders
The increasing prevalence of neurological disorders such as Alzheimer’s disease, Parkinson’s disease, epilepsy, migraines, and multiple sclerosis is a primary driver of the global neurology digital therapeutics market. Aging populations, lifestyle changes, and genetic factors have contributed to a growing number of patients requiring long-term management of neurological conditions. Digital therapeutics provide scalable, evidence-based interventions that complement pharmacological treatments, offering cognitive training, symptom tracking, and personalized therapy. As healthcare systems face increased pressure from chronic neurological diseases, adoption of digital interventions has accelerated, improving patient adherence, clinical outcomes, and accessibility.
- Technological Advancements and AI Integration
Technological innovation, particularly the integration of artificial intelligence (AI), machine learning, and cloud computing, has significantly propelled the neurology digital therapeutics market. AI-driven platforms enable personalized therapy plans, real-time monitoring, predictive analytics, and enhanced patient engagement. Wearables, mobile applications, and software-as-a-medical-device (SaMD) models facilitate remote therapy delivery and continuous tracking of neurological symptoms. These technologies not only improve clinical decision-making but also reduce healthcare costs and hospital visits. Growing acceptance of telehealth, mobile health, and value-based care models has further strengthened market demand.
Market Restraint:
- Regulatory and Reimbursement Challenges
Despite rapid market growth, regulatory complexities and inconsistent reimbursement policies pose significant challenges for neurology digital therapeutics. Different countries have varying approval processes, and digital therapeutics often require extensive clinical validation to gain regulatory clearance. In addition, payers and insurance providers are sometimes hesitant to reimburse novel digital interventions due to limited long-term outcome data and uncertainty about cost-effectiveness. These factors can slow market entry, increase development costs, and restrict adoption, particularly in emerging markets. Consequently, navigating regulatory pathways and achieving payer acceptance remain critical hurdles that could restrain the global expansion of neurology digital therapeutics despite rising demand and technological advancements.
Socio Economic Impact on Neurology Digital Therapeutics Market
Digital therapeutics for neurology have begun to alleviate the societal and economic burden of neurological disorders by reducing hospital visits, rehabilitation costs, and long-term disability. These solutions expand access to care in underserved areas and provide support for aging populations, reducing strain on healthcare systems. By improving treatment adherence, decreasing caregiver burden, and enabling remote interventions, digital therapeutics enhance productivity and quality of life. Their adoption also shifts healthcare spending toward preventative and home-based care models, creating broader socioeconomic benefits and helping healthcare systems manage the increasing prevalence of chronic neurological conditions.
Segmental Analysis:
- Software Segment is Expected to Witness Significant Growth Over the Forecast Period
The software segment in the global neurology digital therapeutics market is poised for strong growth, driven by its flexibility, scalability and ability to deliver real time and personalized care. Software solutions—such as mobile apps, cloud based platforms and AI driven analytics—enable continuous monitoring of neurological conditions like Alzheimer’s, epilepsy, Parkinson’s, and migraines. Analysts note that the software component is among the fastest growing parts of the market, as providers, payers and consumers increasingly favour digital rather than hardware heavy interventions. This trend is further accelerated by rising smartphone and wearable adoption, increasing remote care models, and the need for cost-effective, scalable therapeutic tools in neurology.
- Cognitive & Neuro-Developmental Disorders Segment is Expected to Witness Significant Growth Over the Forecast Period
Within the global neurology digital therapeutics market, the cognitive and neurodevelopmental disorders segment is expected to register significant growth. Disorders such as attention deficit/hyperactivity disorder (ADHD), autism spectrum disorder (ASD), and early stage cognitive decline are increasing in prevalence, prompting demand for digital solutions. These conditions benefit from digital interventions—such as cognitive training, neurofeedback, gamified therapy and remote monitoring—that enhance access, engagement and adherence. Moreover, the shift toward earlier diagnosis and intervention, together with the rising focus on personalised neuro therapies, supports uptake in this segment. As awareness and regulatory acceptance of digital therapeutics grow, cognitive/neurodevelopmental digital treatments become a focal area for innovation and commercial expansion.
- Patients/Consumers Segment is Expected to Witness Significant Growth Over the Forecast Period
The patients/consumers end-user segment of the neurology digital therapeutics market is projected to grow substantially over the forecast period. Increased patient awareness, greater demand for self managed care, and the shift toward home based digital interventions are all driving this growth. Digital therapeutics delivered directly to consumers—via smartphones, tablets or web platforms—allow individuals with neurological conditions or cognitive impairments to access therapy, monitor symptoms, and engage in rehabilitation outside traditional clinical settings. The trend toward patient centric care models and remote health delivery supports this segment’s expansion. With payers and providers recognising the value of direct to consumer digital therapies, this end user group is becoming a major growth engine for neurology DTx.
- North America Region is Expected to Witness Significant Growth Over the Forecast Period
The North America region is expected to maintain a strong growth trajectory in the neurology digital therapeutics market.
The region benefits from advanced healthcare infrastructure, high adoption of digital health technologies, favourable regulatory frameworks (including approvals for digital therapeutics), and strong investment in neurology and digital health innovation. It already holds a large share of the global market and is projected to grow further as US and Canadian healthcare systems increasingly integrate digital therapeutics into neurology care pathways. For instance, in April 2025, Unlearn collaborated with Trace Neuroscience to support the company’s planned Phase 1/2 clinical trial for amyotrophic lateral sclerosis (ALS), utilizing Unlearn’s Digital Twin Generator and platform. This partnership enabled more efficient trial design, patient simulation, and outcome prediction. In North America, it strengthened the neurology digital therapeutics market by demonstrating the value of AI-driven clinical trial solutions, accelerating adoption of advanced digital technologies for neurodegenerative disease research and therapy development.
The combination of rising prevalence of neurological disorders, high smartphone/tech penetration, and reimbursement momentum all contribute to North America remaining the dominant region in this market.
To Learn More About This Report - Request a Free Sample Copy
Neurology Digital Therapeutics Market Competitive Analysis
The competitive landscape of the neurology digital therapeutics market includes specialized digital health firms, pharmaceutical companies, and major technology players. Companies focus on evidence-based software solutions, often partnering or collaborating to expand capabilities. Success in this market depends on obtaining regulatory approvals, demonstrating clinical efficacy, ensuring data privacy compliance, and maintaining strong user engagement. Differentiation arises from proprietary technology, validated therapeutic outcomes, and integrated patient monitoring systems. Mergers, acquisitions, and strategic alliances are common, reflecting the high demand for innovation in neurology care and the competitive pressure to capture market share in the rapidly growing digital therapeutics segment.
The major players for above market:
- Pear Therapeutics
- Akili Interactive Labs
- Omada Health
- Livongo Health
- WellDoc
- Proteus Digital Health
- Propeller Health
- Noom
- Mango Health
- Kaia Health
- Click Therapeutics
- BrainCo
- HealthRhythms
- Cognito Therapeutics
- MindMaze
- Better Therapeutics
- Happify Health
- Biofourmis
- Apple (via its health/neurology apps ecosystem)
- Google (via its digital health/neurology initiatives)
Recent Development
- In September 2025, Cumulus Neuroscience, a global digital health company advancing neuroscience clinical trials and patient care, appointed Robert Ballantine to its board of directors. This leadership addition strengthened the company’s strategic direction and governance. Globally, it underscored growing investor and industry confidence in neurology digital therapeutics, signaling continued innovation, enhanced clinical trial efficiency, and accelerating adoption of digital solutions for neurological disorders, thereby positively influencing the global neurology digital therapeutics market.
- In April 2025, The FDA approved Click Therapeutics’ CT-132 as the first prescription digital therapeutic for preventing episodic migraines in adults, using the De Novo pathway. Indicated for patients aged 18 and older, it was intended for adjunctive use alongside acute or other preventive treatments. This milestone validated the clinical efficacy of neurology digital therapeutics, boosted market credibility, and accelerated adoption globally, signaling strong growth potential in the prescription digital therapeutics segment for neurological disorders.
Frequently Asked Questions (FAQ) :
Q1. What the main growth driving factors for this market?
The market is driven primarily by the rising worldwide prevalence of neurological disorders, such as Alzheimer's, Parkinson's, and epilepsy, which require long-term management. Crucially, the growth is fueled by rapid technological advancements, especially the integration of Artificial Intelligence (AI) and machine learning to personalize treatments. Furthermore, the increasing adoption of smartphones and wearable sensors makes these therapeutic solutions highly accessible and appealing for remote patient monitoring and cost-effective care delivery.
Q2. What are the main restraining factors for this market?
The key obstacles hindering growth include significant regulatory hurdles, particularly around the approval and standardized evaluation of new digital therapeutics, which slows down market entry. There are also widespread concerns regarding data privacy and the security of sensitive patient information. Finally, the lack of clear and consistent reimbursement policies from healthcare payers and the lower digital literacy among certain patient populations limit the widespread acceptance and adoption of these new digital tools.
Q3. Which segment is expected to witness high growth?
The software component segment, rather than hardware or services, is projected to experience the highest growth rate. This is because software solutions are highly scalable and can be efficiently deployed to a large number of patients using existing devices like smartphones and tablets, offering lower initial costs. Within the application area, therapies targeting cognitive and behavioral interventions, especially for conditions like Alzheimer's and cognitive impairment, are expected to see substantial expansion.
Q4. Who are the top major players for this market?
Several companies are recognized as top players, innovating across different therapeutic areas. Key names include Akili Interactive Labs, known for its prescription video game therapeutics; MindMaze, which focuses on neurorehabilitation through machine interfaces; and Pear Therapeutics, a pioneer in prescription digital therapeutics (though its status may be evolving). Other major contributors in the broader digital health space include Omada Health, Kaia Health, and Medtronic, often through strategic partnerships.
Q5. Which country is the largest player?
North America, particularly the United States, holds the largest market share in the Global Neurology Digital Therapeutics market. This dominance is due to several critical factors: advanced healthcare infrastructure, high consumer and provider adoption of digital health technology, and significant investment from venture capital firms. Furthermore, supportive regulatory frameworks from bodies like the FDA have helped accelerate the approval and subsequent commercialization of these innovative therapeutic solutions in the region.
List of Figures
Figure 1: Global Neurology Digital Therapeutics Market Revenue Breakdown (USD Billion, %) by Region, 2022 & 2029
Figure 2: Global Neurology Digital Therapeutics Market Value Share (%), By Segment 1, 2022 & 2029
Figure 3: Global Neurology Digital Therapeutics Market Forecast (USD Billion), by Sub-Segment 1, 2018-2029
Figure 4: Global Neurology Digital Therapeutics Market Forecast (USD Billion), by Sub-Segment 2, 2018-2029
Figure 5: Global Neurology Digital Therapeutics Market Value Share (%), By Segment 2, 2022 & 2029
Figure 6: Global Neurology Digital Therapeutics Market Forecast (USD Billion), by Sub-Segment 1, 2018-2029
Figure 7: Global Neurology Digital Therapeutics Market Forecast (USD Billion), by Sub-Segment 2, 2018-2029
Figure 8: Global Neurology Digital Therapeutics Market Forecast (USD Billion), by Sub-Segment 3, 2018-2029
Figure 9: Global Neurology Digital Therapeutics Market Forecast (USD Billion), by Others, 2018-2029
Figure 10: Global Neurology Digital Therapeutics Market Value Share (%), By Segment 3, 2022 & 2029
Figure 11: Global Neurology Digital Therapeutics Market Forecast (USD Billion), by Sub-Segment 1, 2018-2029
Figure 12: Global Neurology Digital Therapeutics Market Forecast (USD Billion), by Sub-Segment 2, 2018-2029
Figure 13: Global Neurology Digital Therapeutics Market Forecast (USD Billion), by Sub-Segment 3, 2018-2029
Figure 14: Global Neurology Digital Therapeutics Market Forecast (USD Billion), by Others, 2018-2029
Figure 15: Global Neurology Digital Therapeutics Market Value (USD Billion), by Region, 2022 & 2029
Figure 16: North America Neurology Digital Therapeutics Market Value Share (%), By Segment 1, 2022 & 2029
Figure 17: North America Neurology Digital Therapeutics Market Forecast (USD Billion), by Sub-Segment 1, 2018-2029
Figure 18: North America Neurology Digital Therapeutics Market Forecast (USD Billion), by Sub-Segment 2, 2018-2029
Figure 19: North America Neurology Digital Therapeutics Market Value Share (%), By Segment 2, 2022 & 2029
Figure 20: North America Neurology Digital Therapeutics Market Forecast (USD Billion), by Sub-Segment 1, 2018-2029
Figure 21: North America Neurology Digital Therapeutics Market Forecast (USD Billion), by Sub-Segment 2, 2018-2029
Figure 22: North America Neurology Digital Therapeutics Market Forecast (USD Billion), by Sub-Segment 3, 2018-2029
Figure 23: North America Neurology Digital Therapeutics Market Forecast (USD Billion), by Others, 2018-2029
Figure 24: North America Neurology Digital Therapeutics Market Value Share (%), By Segment 3, 2022 & 2029
Figure 25: North America Neurology Digital Therapeutics Market Forecast (USD Billion), by Sub-Segment 1, 2018-2029
Figure 26: North America Neurology Digital Therapeutics Market Forecast (USD Billion), by Sub-Segment 2, 2018-2029
Figure 27: North America Neurology Digital Therapeutics Market Forecast (USD Billion), by Sub-Segment 3, 2018-2029
Figure 28: North America Neurology Digital Therapeutics Market Forecast (USD Billion), by Others, 2018-2029
Figure 29: North America Neurology Digital Therapeutics Market Forecast (USD Billion), by U.S., 2018-2029
Figure 30: North America Neurology Digital Therapeutics Market Forecast (USD Billion), by Canada, 2018-2029
Figure 31: Latin America Neurology Digital Therapeutics Market Value Share (%), By Segment 1, 2022 & 2029
Figure 32: Latin America Neurology Digital Therapeutics Market Forecast (USD Billion), by Sub-Segment 1, 2018-2029
Figure 33: Latin America Neurology Digital Therapeutics Market Forecast (USD Billion), by Sub-Segment 2, 2018-2029
Figure 34: Latin America Neurology Digital Therapeutics Market Value Share (%), By Segment 2, 2022 & 2029
Figure 35: Latin America Neurology Digital Therapeutics Market Forecast (USD Billion), by Sub-Segment 1, 2018-2029
Figure 36: Latin America Neurology Digital Therapeutics Market Forecast (USD Billion), by Sub-Segment 2, 2018-2029
Figure 37: Latin America Neurology Digital Therapeutics Market Forecast (USD Billion), by Sub-Segment 3, 2018-2029
Figure 38: Latin America Neurology Digital Therapeutics Market Forecast (USD Billion), by Others, 2018-2029
Figure 39: Latin America Neurology Digital Therapeutics Market Value Share (%), By Segment 3, 2022 & 2029
Figure 40: Latin America Neurology Digital Therapeutics Market Forecast (USD Billion), by Sub-Segment 1, 2018-2029
Figure 41: Latin America Neurology Digital Therapeutics Market Forecast (USD Billion), by Sub-Segment 2, 2018-2029
Figure 42: Latin America Neurology Digital Therapeutics Market Forecast (USD Billion), by Sub-Segment 3, 2018-2029
Figure 43: Latin America Neurology Digital Therapeutics Market Forecast (USD Billion), by Others, 2018-2029
Figure 44: Latin America Neurology Digital Therapeutics Market Forecast (USD Billion), by Brazil, 2018-2029
Figure 45: Latin America Neurology Digital Therapeutics Market Forecast (USD Billion), by Mexico, 2018-2029
Figure 46: Latin America Neurology Digital Therapeutics Market Forecast (USD Billion), by Rest of Latin America, 2018-2029
Figure 47: Europe Neurology Digital Therapeutics Market Value Share (%), By Segment 1, 2022 & 2029
Figure 48: Europe Neurology Digital Therapeutics Market Forecast (USD Billion), by Sub-Segment 1, 2018-2029
Figure 49: Europe Neurology Digital Therapeutics Market Forecast (USD Billion), by Sub-Segment 2, 2018-2029
Figure 50: Europe Neurology Digital Therapeutics Market Value Share (%), By Segment 2, 2022 & 2029
Figure 51: Europe Neurology Digital Therapeutics Market Forecast (USD Billion), by Sub-Segment 1, 2018-2029
Figure 52: Europe Neurology Digital Therapeutics Market Forecast (USD Billion), by Sub-Segment 2, 2018-2029
Figure 53: Europe Neurology Digital Therapeutics Market Forecast (USD Billion), by Sub-Segment 3, 2018-2029
Figure 54: Europe Neurology Digital Therapeutics Market Forecast (USD Billion), by Others, 2018-2029
Figure 55: Europe Neurology Digital Therapeutics Market Value Share (%), By Segment 3, 2022 & 2029
Figure 56: Europe Neurology Digital Therapeutics Market Forecast (USD Billion), by Sub-Segment 1, 2018-2029
Figure 57: Europe Neurology Digital Therapeutics Market Forecast (USD Billion), by Sub-Segment 2, 2018-2029
Figure 58: Europe Neurology Digital Therapeutics Market Forecast (USD Billion), by Sub-Segment 3, 2018-2029
Figure 59: Europe Neurology Digital Therapeutics Market Forecast (USD Billion), by Others, 2018-2029
Figure 60: Europe Neurology Digital Therapeutics Market Forecast (USD Billion), by U.K., 2018-2029
Figure 61: Europe Neurology Digital Therapeutics Market Forecast (USD Billion), by Germany, 2018-2029
Figure 62: Europe Neurology Digital Therapeutics Market Forecast (USD Billion), by France, 2018-2029
Figure 63: Europe Neurology Digital Therapeutics Market Forecast (USD Billion), by Italy, 2018-2029
Figure 64: Europe Neurology Digital Therapeutics Market Forecast (USD Billion), by Spain, 2018-2029
Figure 65: Europe Neurology Digital Therapeutics Market Forecast (USD Billion), by Russia, 2018-2029
Figure 66: Europe Neurology Digital Therapeutics Market Forecast (USD Billion), by Rest of Europe, 2018-2029
Figure 67: Asia Pacific Neurology Digital Therapeutics Market Value Share (%), By Segment 1, 2022 & 2029
Figure 68: Asia Pacific Neurology Digital Therapeutics Market Forecast (USD Billion), by Sub-Segment 1, 2018-2029
Figure 69: Asia Pacific Neurology Digital Therapeutics Market Forecast (USD Billion), by Sub-Segment 2, 2018-2029
Figure 70: Asia Pacific Neurology Digital Therapeutics Market Value Share (%), By Segment 2, 2022 & 2029
Figure 71: Asia Pacific Neurology Digital Therapeutics Market Forecast (USD Billion), by Sub-Segment 1, 2018-2029
Figure 72: Asia Pacific Neurology Digital Therapeutics Market Forecast (USD Billion), by Sub-Segment 2, 2018-2029
Figure 73: Asia Pacific Neurology Digital Therapeutics Market Forecast (USD Billion), by Sub-Segment 3, 2018-2029
Figure 74: Asia Pacific Neurology Digital Therapeutics Market Forecast (USD Billion), by Others, 2018-2029
Figure 75: Asia Pacific Neurology Digital Therapeutics Market Value Share (%), By Segment 3, 2022 & 2029
Figure 76: Asia Pacific Neurology Digital Therapeutics Market Forecast (USD Billion), by Sub-Segment 1, 2018-2029
Figure 77: Asia Pacific Neurology Digital Therapeutics Market Forecast (USD Billion), by Sub-Segment 2, 2018-2029
Figure 78: Asia Pacific Neurology Digital Therapeutics Market Forecast (USD Billion), by Sub-Segment 3, 2018-2029
Figure 79: Asia Pacific Neurology Digital Therapeutics Market Forecast (USD Billion), by Others, 2018-2029
Figure 80: Asia Pacific Neurology Digital Therapeutics Market Forecast (USD Billion), by China, 2018-2029
Figure 81: Asia Pacific Neurology Digital Therapeutics Market Forecast (USD Billion), by India, 2018-2029
Figure 82: Asia Pacific Neurology Digital Therapeutics Market Forecast (USD Billion), by Japan, 2018-2029
Figure 83: Asia Pacific Neurology Digital Therapeutics Market Forecast (USD Billion), by Australia, 2018-2029
Figure 84: Asia Pacific Neurology Digital Therapeutics Market Forecast (USD Billion), by Southeast Asia, 2018-2029
Figure 85: Asia Pacific Neurology Digital Therapeutics Market Forecast (USD Billion), by Rest of Asia Pacific, 2018-2029
Figure 86: Middle East & Africa Neurology Digital Therapeutics Market Value Share (%), By Segment 1, 2022 & 2029
Figure 87: Middle East & Africa Neurology Digital Therapeutics Market Forecast (USD Billion), by Sub-Segment 1, 2018-2029
Figure 88: Middle East & Africa Neurology Digital Therapeutics Market Forecast (USD Billion), by Sub-Segment 2, 2018-2029
Figure 89: Middle East & Africa Neurology Digital Therapeutics Market Value Share (%), By Segment 2, 2022 & 2029
Figure 90: Middle East & Africa Neurology Digital Therapeutics Market Forecast (USD Billion), by Sub-Segment 1, 2018-2029
Figure 91: Middle East & Africa Neurology Digital Therapeutics Market Forecast (USD Billion), by Sub-Segment 2, 2018-2029
Figure 92: Middle East & Africa Neurology Digital Therapeutics Market Forecast (USD Billion), by Sub-Segment 3, 2018-2029
Figure 93: Middle East & Africa Neurology Digital Therapeutics Market Forecast (USD Billion), by Others, 2018-2029
Figure 94: Middle East & Africa Neurology Digital Therapeutics Market Value Share (%), By Segment 3, 2022 & 2029
Figure 95: Middle East & Africa Neurology Digital Therapeutics Market Forecast (USD Billion), by Sub-Segment 1, 2018-2029
Figure 96: Middle East & Africa Neurology Digital Therapeutics Market Forecast (USD Billion), by Sub-Segment 2, 2018-2029
Figure 97: Middle East & Africa Neurology Digital Therapeutics Market Forecast (USD Billion), by Sub-Segment 3, 2018-2029
Figure 98: Middle East & Africa Neurology Digital Therapeutics Market Forecast (USD Billion), by Others, 2018-2029
Figure 99: Middle East & Africa Neurology Digital Therapeutics Market Forecast (USD Billion), by GCC, 2018-2029
Figure 100: Middle East & Africa Neurology Digital Therapeutics Market Forecast (USD Billion), by South Africa, 2018-2029
Figure 101: Middle East & Africa Neurology Digital Therapeutics Market Forecast (USD Billion), by Rest of Middle East & Africa, 2018-2029
List of Tables
Table 1: Global Neurology Digital Therapeutics Market Revenue (USD Billion) Forecast, by Segment 1, 2018-2029
Table 2: Global Neurology Digital Therapeutics Market Revenue (USD Billion) Forecast, by Segment 2, 2018-2029
Table 3: Global Neurology Digital Therapeutics Market Revenue (USD Billion) Forecast, by Segment 3, 2018-2029
Table 4: Global Neurology Digital Therapeutics Market Revenue (USD Billion) Forecast, by Region, 2018-2029
Table 5: North America Neurology Digital Therapeutics Market Revenue (USD Billion) Forecast, by Segment 1, 2018-2029
Table 6: North America Neurology Digital Therapeutics Market Revenue (USD Billion) Forecast, by Segment 2, 2018-2029
Table 7: North America Neurology Digital Therapeutics Market Revenue (USD Billion) Forecast, by Segment 3, 2018-2029
Table 8: North America Neurology Digital Therapeutics Market Revenue (USD Billion) Forecast, by Country, 2018-2029
Table 9: Europe Neurology Digital Therapeutics Market Revenue (USD Billion) Forecast, by Segment 1, 2018-2029
Table 10: Europe Neurology Digital Therapeutics Market Revenue (USD Billion) Forecast, by Segment 2, 2018-2029
Table 11: Europe Neurology Digital Therapeutics Market Revenue (USD Billion) Forecast, by Segment 3, 2018-2029
Table 12: Europe Neurology Digital Therapeutics Market Revenue (USD Billion) Forecast, by Country, 2018-2029
Table 13: Latin America Neurology Digital Therapeutics Market Revenue (USD Billion) Forecast, by Segment 1, 2018-2029
Table 14: Latin America Neurology Digital Therapeutics Market Revenue (USD Billion) Forecast, by Segment 2, 2018-2029
Table 15: Latin America Neurology Digital Therapeutics Market Revenue (USD Billion) Forecast, by Segment 3, 2018-2029
Table 16: Latin America Neurology Digital Therapeutics Market Revenue (USD Billion) Forecast, by Country, 2018-2029
Table 17: Asia Pacific Neurology Digital Therapeutics Market Revenue (USD Billion) Forecast, by Segment 1, 2018-2029
Table 18: Asia Pacific Neurology Digital Therapeutics Market Revenue (USD Billion) Forecast, by Segment 2, 2018-2029
Table 19: Asia Pacific Neurology Digital Therapeutics Market Revenue (USD Billion) Forecast, by Segment 3, 2018-2029
Table 20: Asia Pacific Neurology Digital Therapeutics Market Revenue (USD Billion) Forecast, by Country, 2018-2029
Table 21: Middle East & Africa Neurology Digital Therapeutics Market Revenue (USD Billion) Forecast, by Segment 1, 2018-2029
Table 22: Middle East & Africa Neurology Digital Therapeutics Market Revenue (USD Billion) Forecast, by Segment 2, 2018-2029
Table 23: Middle East & Africa Neurology Digital Therapeutics Market Revenue (USD Billion) Forecast, by Segment 3, 2018-2029
Table 24: Middle East & Africa Neurology Digital Therapeutics Market Revenue (USD Billion) Forecast, by Country, 2018-2029
Research Process
Data Library Research are conducted by industry experts who offer insight on
industry structure, market segmentations technology assessment and competitive landscape (CL), and penetration, as well as on emerging trends. Their analysis is based on primary interviews (~ 80%) and secondary research (~ 20%) as well as years of professional expertise in their respective industries. Adding to this, by analysing historical trends and current market positions, our analysts predict where the market will be headed for the next five years. Furthermore, the varying trends of segment & categories geographically presented are also studied and the estimated based on the primary & secondary research.
In this particular report from the supply side Data Library Research has conducted primary surveys (interviews) with the key level executives (VP, CEO’s, Marketing Director, Business Development Manager
and SOFT) of the companies that active & prominent as well as the midsized organization
FIGURE 1: DLR RESEARH PROCESS
![research-methodology1]()
Primary Research
Extensive primary research was conducted to gain a deeper insight of the market and industry performance. The analysis is based on both primary and secondary research as well as years of professional expertise in the respective industries.
In addition to analysing current and historical trends, our analysts predict where the market is headed over the next five years.
It varies by segment for these categories geographically presented in the list of market tables. Speaking about this particular report we have conducted primary surveys (interviews) with the key level executives (VP, CEO’s, Marketing Director, Business Development Manager and many more) of the major players active in the market.
Secondary Research
Secondary research was mainly used to collect and identify information useful for the extensive, technical, market-oriented, and Friend’s study of the Global Extra Neutral Alcohol. It was also used to obtain key information about major players, market classification and segmentation according to the industry trends, geographical markets, and developments related to the market and technology perspectives. For this study, analysts have gathered information from various credible sources, such as annual reports, sec filings, journals, white papers, SOFT presentations, and company web sites.
Market Size Estimation
Both, top-down and bottom-up approaches were used to estimate and validate the size of the Global market and to estimate the size of various other dependent submarkets in the overall Extra Neutral Alcohol. The key players in the market were identified through secondary research and their market contributions in the respective geographies were determined through primary and secondary research.
Forecast Model
![research-methodology2]()