New Energy Power Station Solution Market Overview and Analysis
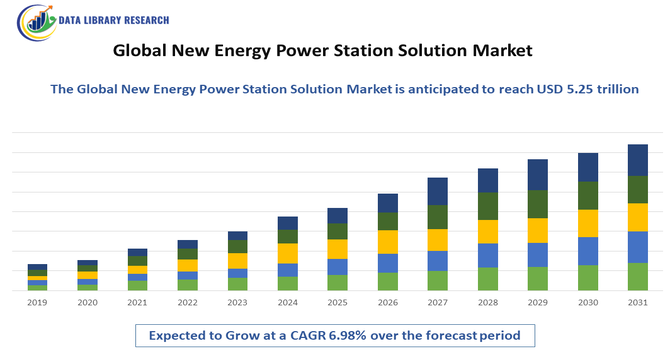
- The New Energy Power Station Solution Market size is estimated at USD 2.87 trillion in 2025 and is expected to hit around USD 5.25 trillion by 2032, growing with a CAGR of 6.98% from 2025-2032.
Get Complete Analysis Of The Report - Download Updated Free Sample PDF
The Global New Energy Power Station Solution Market refers to the worldwide industry that provides technologies, systems, and services for designing, constructing, and operating power stations powered by renewable or alternative energy sources, such as solar, wind, hydro, and biomass. It encompasses equipment, smart grid integration, and energy storage solutions, driven by the shift toward sustainable, low-carbon energy generation and growing global electricity demand.
New Energy Power Station Solution Market Latest Trends
The Global New Energy Power Station Solution Market is characterized by the rapid adoption of renewable technologies such as solar, wind, and energy storage systems, driven by declining costs of solar panels and batteries that expand renewables’ role in power generation. Integration of smart grid technologies, digital monitoring, and AI-based energy optimization enhances operational efficiency and reliability. Urbanization and rising electricity demand further propel investments in decentralized and hybrid power solutions, while global focus on low carbon energy aligns infrastructure modernization with sustainability goals.
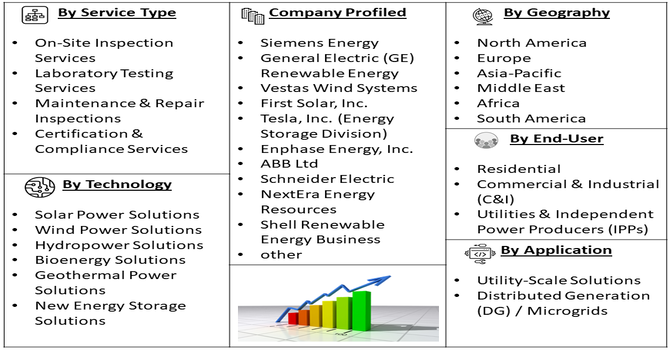
Segmentation: The Global New Energy Power Station Solution Market is segmented by Technology (Solar Power Solutions, Wind Power Solutions, Hydropower Solutions, Bioenergy Solutions, Geothermal Power Solutions and New Energy Storage Solutions), Application (Utility-Scale Solutions and Distributed Generation (DG) / Microgrids), End-User (Residential, Commercial & Industrial (C&I) and Utilities & Independent Power Producers (IPPs)), Component (Power Generation Equipment, Power Electronics, Balance of System (BOS) and Software and Services), and Geography (North America, Europe, Asia-Pacific, Middle East and Africa, and South America). The report provides the value (in USD million) for the above segments.
For Detailed Market Segmentation - Get a Free Sample PDF
Market Drivers:
- Growing Demand for Renewable Energy
The global push for renewable energy sources is a key driver for the new energy power station solutions market. Governments and companies are investing heavily in solar, wind, hydro, and other clean energy projects to reduce carbon emissions and meet sustainability goals. For instance, in December 2025, Union Minister Piyush Goyal highlighted India’s energy achievements over 11 years, including record coal production of 1,048 million tonnes, an 8% decline in imports, 46-fold solar capacity growth, and wind capacity rising to 53 GW. Expansion of refining, natural gas pipelines, and nuclear energy initiatives reinforced energy self-reliance, driving adoption of new energy power station solutions and fueling the growing demand for renewable energy in India and the Asia-Pacific region.
- Technological Advancements in Energy Storage and Smart Grids
Advances in energy storage and smart grid technologies drive the market by improving the efficiency, reliability, and flexibility of renewable power stations. Batteries, AI-driven monitoring systems, and predictive maintenance software allow better integration of intermittent energy sources like solar and wind.
In June 2024, Wärtsilä launched the world’s first large-scale 100% hydrogen-ready engine power plant, advancing net-zero power systems. With renewable deployment doubling and hydrogen consumption projected to reach 17 Mt by 2030, the plant demonstrated the use of excess clean electricity for hydrogen production. This innovation strengthened the Global New Energy Power Station Solution market and showcased technological advancements in energy storage and smart grids for reliable, carbon-neutral power generation. The continual innovation in storage capacity, grid automation, and digital energy management strengthens the market’s growth prospects globally.
Market Restraints:
- High Initial Capital Investment
High upfront costs for designing, constructing, and integrating new energy power stations remain a major restraint. Renewable projects require significant investment in land, equipment, storage systems, and grid infrastructure. Smaller companies or emerging markets may struggle to finance these projects without government subsidies or private financing. Long payback periods and uncertain regulatory frameworks in some regions can discourage investment. Additionally, integrating advanced storage and smart grid technologies adds to the initial expenditure. These financial barriers slow market adoption, particularly in developing economies, despite long-term operational savings and environmental benefits.
Socioeconomic Impact On New Energy Power Station Solution Market
New energy power station solutions significantly influence economies by creating jobs in renewable construction, operations, and maintenance, while reducing dependency on fossil fuels and stabilizing energy costs. Expanding renewable infrastructure supports energy security and enhances grid resilience, especially in emerging markets. Affordable renewable power helps lower electricity costs for households and industries, spurs local manufacturing, and attracts private investment. Social benefits include improved public health due to reduced pollution and expanded access to electricity in underserved regions, contributing to inclusive growth and meeting global sustainability and climate goals.
Segmental Analysis:
- The Bioenergy Solutions segment is expected to witness the highest growth over the forecast period
The Bioenergy Solutions segment is projected to witness the highest growth due to increasing focus on sustainable and carbon-neutral energy sources. Bioenergy technologies convert organic materials, waste, and biomass into electricity, heat, and fuels, providing a reliable and renewable energy alternative. Rising government incentives, carbon reduction targets, and growing awareness of waste-to-energy initiatives drive adoption globally. Industries and utilities seek bioenergy solutions for energy security and environmental compliance. Technological advancements in anaerobic digestion, gasification, and biomass boilers improve efficiency and scalability, positioning bioenergy as a high-growth segment in new energy power station solutions.
- Utility-Scale Solutions segment is expected to witness the highest growth over the forecast period
The Utility-Scale Solutions segment is expected to experience strong growth as large-scale solar, wind, and hybrid power plants expand worldwide. Utility-scale projects offer economies of scale, grid stability, and the ability to meet rising electricity demand efficiently. Governments and private developers are investing in renewable megaprojects to achieve carbon reduction targets and provide reliable, cost-effective power. Advanced energy management, storage integration, and smart grid technologies enhance performance and reduce operational costs. With increasing public and corporate demand for clean energy, utility-scale solutions are becoming the preferred approach for large-scale renewable power generation, driving rapid market expansion.
- Commercial & Industrial (C&I) segment is expected to witness the highest growth over the forecast period
The Commercial & Industrial (C&I) segment is anticipated to grow rapidly due to businesses seeking to reduce energy costs and achieve sustainability goals. C&I solutions include rooftop solar, combined heat and power systems, and on-site storage, enabling companies to generate clean energy and manage consumption efficiently. Rising corporate ESG commitments, government incentives, and decreasing technology costs encourage adoption. Energy independence, reliability, and lower operational expenses are key benefits for industries and commercial establishments. Integration with smart monitoring and control systems allows efficient load management and peak shaving, making the C&I segment a high-growth area within the new energy power station solutions market.
- Power Generation Equipment segment is expected to witness the highest growth over the forecast period
The Power Generation Equipment segment is projected to grow significantly as demand rises for advanced turbines, inverters, generators, and energy storage systems. Efficient and reliable equipment is critical for renewable power stations, including solar, wind, hydro, and bioenergy plants. Technological advancements improve energy conversion efficiency, reduce maintenance costs, and extend equipment lifespan. Governments and utilities prioritize high-performance equipment to maximize return on investment and meet sustainability goals. As renewable installations expand globally, the need for innovative, robust, and scalable power generation equipment continues to drive market growth, making this segment a cornerstone of new energy power station solutions.
- Asia-Pacific region is expected to witness the highest growth over the forecast period
The Asia-Pacific region is expected to witness the highest growth due to rapid industrialization, urbanization, and increasing energy demand. Countries such as China, India, Japan, and Australia are investing heavily in renewable energy infrastructure, including solar, wind, hydro, and bioenergy projects. Government policies, subsidies, and renewable energy targets accelerate the adoption of new energy power station solutions. For instance, the Indian Government reported that by October 2025, India had achieved 50% of its electricity capacity from non-fossil fuels, five years ahead of its Paris Agreement target, reaching 259 GW, with 31.2 GW added that year. Renewable Energy Implementing Agencies issued 67,554 MW in Letters of Award without cancellations, boosting demand for new energy power station solutions and accelerating growth in Asia-Pacific’s renewable infrastructure market.
Rising awareness of climate change, decreasing costs of renewable technologies, and growing private sector participation further support market expansion. The region’s abundant natural resources, combined with technological advancements and infrastructure development, position Asia-Pacific as the fastest-growing market for new energy power station solutions globally.
| Report Matrics |
Details |
| Market Size Value |
USD 5.25 trillion |
| Growth Rate |
CAGR of 6.98 % |
| Forecast |
2026-2033 |
| Historical data |
2021-2024 |
| Base Year |
2025 |
| Report Coverage |
Forecasted revenue, company rating, competitive environment, growth drivers, and trends |
| Segment Coverage |
Type, Application, End-User, Geography |
| Regional Scope |
North America, Europe, Asia Pacific, Middle East |
| Customized scope |
Free customization of reports (With 3 months Analysis Support ) |
| To Learn More About This Report |
Request a Free Sample Copy |
New Energy Power Station Solution Market Competitive Landscape
The competitive landscape of the Global New Energy Power Station Solution Market comprises established energy firms, technology innovators, and emerging entrants specializing in renewable generation, storage, and digital solutions. Companies are investing heavily in R&D to improve efficiency, lower system costs, and offer tailored solutions for diverse regional energy needs. Strategic partnerships, mergers, and technology collaborations are common to expand geographic reach and technical expertise. Market players also focus on advanced solar, wind, and battery storage technologies and software for real time monitoring, predictive maintenance, and grid integration to maintain competitive advantage in a rapidly evolving renewable energy sector.
The major players for the above market are:
- Siemens Energy
- General Electric (GE) Renewable Energy
- Vestas Wind Systems
- First Solar, Inc.
- Tesla, Inc. (Energy Storage Division)
- Enphase Energy, Inc.
- ABB Ltd
- Schneider Electric
- LG Energy Solution
- NextEra Energy Resources
- Shell Renewable Energy Business
- Hitachi Energy
- ReNew Power
- Tata Power
- Statkraft
- ACWA Power
- Black & Veatch
- Mitsubishi Corporation
- Ørsted A/S
- Trina Solar Co., Ltd.
Recent Development
- In October 2025, Tata Power Renewables signed a Power Purchase Agreement (PPA) with Tata Power Mumbai Distribution to develop an 80 MW Firm and Dispatchable Renewable Energy (FDRE) project. The project integrated solar, wind, and battery storage systems, enabling reliable energy dispatch during peak demand and enhancing grid stability. This initiative supported the adoption of advanced renewable technologies, boosting growth and innovation in the Global New Energy Power Station Solution market
- In February 2024, Nokia launched its Virtual Power Plant (VPP) Controller Software, enabling mobile operators to monetize backup batteries at base stations. By switching between grid and battery power, operators reduced energy costs, generated revenue from grid balancing, and cut carbon emissions. Successful trials demonstrated its effectiveness, enhancing adoption of innovative energy management solutions and supporting growth in the Global New Energy Power Station Solution market.
Frequently Asked Questions (FAQ) :
Q1. What are the main growth-driving factors for this market?
The main growth drivers are aggressive global climate change targets and supportive government policies, including subsidies and renewable energy mandates. Rapid technological advancements, particularly in energy storage (batteries) and solar panel efficiency, are also making new energy solutions increasingly cost-competitive compared to fossil fuels.
Q2. What are the main restraining factors for this market?
High initial capital expenditure for constructing new energy infrastructure remains a major challenge. Additionally, the intermittent nature of solar and wind power creates grid stability issues, requiring costly upgrades and complex management systems, which can slow down large-scale adoption.
Q3. Which segment is expected to witness high growth?
The Commercial & Industrial (C&I) segment is projected to witness the highest growth due to increasing adoption of on-site renewable energy solutions, including solar and energy storage. Rising corporate sustainability goals, cost reduction initiatives, and government incentives drive businesses to implement efficient, clean energy systems, boosting demand for C&I power station solutions.
Q4. Who are the top major players for this market?
Leading the market are integrated energy companies and major technology providers like Siemens Energy and General Electric (GE). Key specialized players include major solar inverter and storage providers such as Sungrow and CATL (for battery energy storage systems or BESS).
Q5. Which country is the largest player?
China is currently the largest and most dominant player in the global new energy power station solution market. It leads significantly in manufacturing capacity for solar panels and batteries, and holds the world's highest installed capacity for both wind and solar power generation.
List of Figures
Figure 1: Global New Energy Power Station Solution Market Revenue Breakdown (USD Billion, %) by Region, 2022 & 2029
Figure 2: Global New Energy Power Station Solution Market Value Share (%), By Segment 1, 2022 & 2029
Figure 3: Global New Energy Power Station Solution Market Forecast (USD Billion), by Sub-Segment 1, 2018-2029
Figure 4: Global New Energy Power Station Solution Market Forecast (USD Billion), by Sub-Segment 2, 2018-2029
Figure 5: Global New Energy Power Station Solution Market Value Share (%), By Segment 2, 2022 & 2029
Figure 6: Global New Energy Power Station Solution Market Forecast (USD Billion), by Sub-Segment 1, 2018-2029
Figure 7: Global New Energy Power Station Solution Market Forecast (USD Billion), by Sub-Segment 2, 2018-2029
Figure 8: Global New Energy Power Station Solution Market Forecast (USD Billion), by Sub-Segment 3, 2018-2029
Figure 9: Global New Energy Power Station Solution Market Forecast (USD Billion), by Others, 2018-2029
Figure 10: Global New Energy Power Station Solution Market Value Share (%), By Segment 3, 2022 & 2029
Figure 11: Global New Energy Power Station Solution Market Forecast (USD Billion), by Sub-Segment 1, 2018-2029
Figure 12: Global New Energy Power Station Solution Market Forecast (USD Billion), by Sub-Segment 2, 2018-2029
Figure 13: Global New Energy Power Station Solution Market Forecast (USD Billion), by Sub-Segment 3, 2018-2029
Figure 14: Global New Energy Power Station Solution Market Forecast (USD Billion), by Others, 2018-2029
Figure 15: Global New Energy Power Station Solution Market Value (USD Billion), by Region, 2022 & 2029
Figure 16: North America New Energy Power Station Solution Market Value Share (%), By Segment 1, 2022 & 2029
Figure 17: North America New Energy Power Station Solution Market Forecast (USD Billion), by Sub-Segment 1, 2018-2029
Figure 18: North America New Energy Power Station Solution Market Forecast (USD Billion), by Sub-Segment 2, 2018-2029
Figure 19: North America New Energy Power Station Solution Market Value Share (%), By Segment 2, 2022 & 2029
Figure 20: North America New Energy Power Station Solution Market Forecast (USD Billion), by Sub-Segment 1, 2018-2029
Figure 21: North America New Energy Power Station Solution Market Forecast (USD Billion), by Sub-Segment 2, 2018-2029
Figure 22: North America New Energy Power Station Solution Market Forecast (USD Billion), by Sub-Segment 3, 2018-2029
Figure 23: North America New Energy Power Station Solution Market Forecast (USD Billion), by Others, 2018-2029
Figure 24: North America New Energy Power Station Solution Market Value Share (%), By Segment 3, 2022 & 2029
Figure 25: North America New Energy Power Station Solution Market Forecast (USD Billion), by Sub-Segment 1, 2018-2029
Figure 26: North America New Energy Power Station Solution Market Forecast (USD Billion), by Sub-Segment 2, 2018-2029
Figure 27: North America New Energy Power Station Solution Market Forecast (USD Billion), by Sub-Segment 3, 2018-2029
Figure 28: North America New Energy Power Station Solution Market Forecast (USD Billion), by Others, 2018-2029
Figure 29: North America New Energy Power Station Solution Market Forecast (USD Billion), by U.S., 2018-2029
Figure 30: North America New Energy Power Station Solution Market Forecast (USD Billion), by Canada, 2018-2029
Figure 31: Latin America New Energy Power Station Solution Market Value Share (%), By Segment 1, 2022 & 2029
Figure 32: Latin America New Energy Power Station Solution Market Forecast (USD Billion), by Sub-Segment 1, 2018-2029
Figure 33: Latin America New Energy Power Station Solution Market Forecast (USD Billion), by Sub-Segment 2, 2018-2029
Figure 34: Latin America New Energy Power Station Solution Market Value Share (%), By Segment 2, 2022 & 2029
Figure 35: Latin America New Energy Power Station Solution Market Forecast (USD Billion), by Sub-Segment 1, 2018-2029
Figure 36: Latin America New Energy Power Station Solution Market Forecast (USD Billion), by Sub-Segment 2, 2018-2029
Figure 37: Latin America New Energy Power Station Solution Market Forecast (USD Billion), by Sub-Segment 3, 2018-2029
Figure 38: Latin America New Energy Power Station Solution Market Forecast (USD Billion), by Others, 2018-2029
Figure 39: Latin America New Energy Power Station Solution Market Value Share (%), By Segment 3, 2022 & 2029
Figure 40: Latin America New Energy Power Station Solution Market Forecast (USD Billion), by Sub-Segment 1, 2018-2029
Figure 41: Latin America New Energy Power Station Solution Market Forecast (USD Billion), by Sub-Segment 2, 2018-2029
Figure 42: Latin America New Energy Power Station Solution Market Forecast (USD Billion), by Sub-Segment 3, 2018-2029
Figure 43: Latin America New Energy Power Station Solution Market Forecast (USD Billion), by Others, 2018-2029
Figure 44: Latin America New Energy Power Station Solution Market Forecast (USD Billion), by Brazil, 2018-2029
Figure 45: Latin America New Energy Power Station Solution Market Forecast (USD Billion), by Mexico, 2018-2029
Figure 46: Latin America New Energy Power Station Solution Market Forecast (USD Billion), by Rest of Latin America, 2018-2029
Figure 47: Europe New Energy Power Station Solution Market Value Share (%), By Segment 1, 2022 & 2029
Figure 48: Europe New Energy Power Station Solution Market Forecast (USD Billion), by Sub-Segment 1, 2018-2029
Figure 49: Europe New Energy Power Station Solution Market Forecast (USD Billion), by Sub-Segment 2, 2018-2029
Figure 50: Europe New Energy Power Station Solution Market Value Share (%), By Segment 2, 2022 & 2029
Figure 51: Europe New Energy Power Station Solution Market Forecast (USD Billion), by Sub-Segment 1, 2018-2029
Figure 52: Europe New Energy Power Station Solution Market Forecast (USD Billion), by Sub-Segment 2, 2018-2029
Figure 53: Europe New Energy Power Station Solution Market Forecast (USD Billion), by Sub-Segment 3, 2018-2029
Figure 54: Europe New Energy Power Station Solution Market Forecast (USD Billion), by Others, 2018-2029
Figure 55: Europe New Energy Power Station Solution Market Value Share (%), By Segment 3, 2022 & 2029
Figure 56: Europe New Energy Power Station Solution Market Forecast (USD Billion), by Sub-Segment 1, 2018-2029
Figure 57: Europe New Energy Power Station Solution Market Forecast (USD Billion), by Sub-Segment 2, 2018-2029
Figure 58: Europe New Energy Power Station Solution Market Forecast (USD Billion), by Sub-Segment 3, 2018-2029
Figure 59: Europe New Energy Power Station Solution Market Forecast (USD Billion), by Others, 2018-2029
Figure 60: Europe New Energy Power Station Solution Market Forecast (USD Billion), by U.K., 2018-2029
Figure 61: Europe New Energy Power Station Solution Market Forecast (USD Billion), by Germany, 2018-2029
Figure 62: Europe New Energy Power Station Solution Market Forecast (USD Billion), by France, 2018-2029
Figure 63: Europe New Energy Power Station Solution Market Forecast (USD Billion), by Italy, 2018-2029
Figure 64: Europe New Energy Power Station Solution Market Forecast (USD Billion), by Spain, 2018-2029
Figure 65: Europe New Energy Power Station Solution Market Forecast (USD Billion), by Russia, 2018-2029
Figure 66: Europe New Energy Power Station Solution Market Forecast (USD Billion), by Rest of Europe, 2018-2029
Figure 67: Asia Pacific New Energy Power Station Solution Market Value Share (%), By Segment 1, 2022 & 2029
Figure 68: Asia Pacific New Energy Power Station Solution Market Forecast (USD Billion), by Sub-Segment 1, 2018-2029
Figure 69: Asia Pacific New Energy Power Station Solution Market Forecast (USD Billion), by Sub-Segment 2, 2018-2029
Figure 70: Asia Pacific New Energy Power Station Solution Market Value Share (%), By Segment 2, 2022 & 2029
Figure 71: Asia Pacific New Energy Power Station Solution Market Forecast (USD Billion), by Sub-Segment 1, 2018-2029
Figure 72: Asia Pacific New Energy Power Station Solution Market Forecast (USD Billion), by Sub-Segment 2, 2018-2029
Figure 73: Asia Pacific New Energy Power Station Solution Market Forecast (USD Billion), by Sub-Segment 3, 2018-2029
Figure 74: Asia Pacific New Energy Power Station Solution Market Forecast (USD Billion), by Others, 2018-2029
Figure 75: Asia Pacific New Energy Power Station Solution Market Value Share (%), By Segment 3, 2022 & 2029
Figure 76: Asia Pacific New Energy Power Station Solution Market Forecast (USD Billion), by Sub-Segment 1, 2018-2029
Figure 77: Asia Pacific New Energy Power Station Solution Market Forecast (USD Billion), by Sub-Segment 2, 2018-2029
Figure 78: Asia Pacific New Energy Power Station Solution Market Forecast (USD Billion), by Sub-Segment 3, 2018-2029
Figure 79: Asia Pacific New Energy Power Station Solution Market Forecast (USD Billion), by Others, 2018-2029
Figure 80: Asia Pacific New Energy Power Station Solution Market Forecast (USD Billion), by China, 2018-2029
Figure 81: Asia Pacific New Energy Power Station Solution Market Forecast (USD Billion), by India, 2018-2029
Figure 82: Asia Pacific New Energy Power Station Solution Market Forecast (USD Billion), by Japan, 2018-2029
Figure 83: Asia Pacific New Energy Power Station Solution Market Forecast (USD Billion), by Australia, 2018-2029
Figure 84: Asia Pacific New Energy Power Station Solution Market Forecast (USD Billion), by Southeast Asia, 2018-2029
Figure 85: Asia Pacific New Energy Power Station Solution Market Forecast (USD Billion), by Rest of Asia Pacific, 2018-2029
Figure 86: Middle East & Africa New Energy Power Station Solution Market Value Share (%), By Segment 1, 2022 & 2029
Figure 87: Middle East & Africa New Energy Power Station Solution Market Forecast (USD Billion), by Sub-Segment 1, 2018-2029
Figure 88: Middle East & Africa New Energy Power Station Solution Market Forecast (USD Billion), by Sub-Segment 2, 2018-2029
Figure 89: Middle East & Africa New Energy Power Station Solution Market Value Share (%), By Segment 2, 2022 & 2029
Figure 90: Middle East & Africa New Energy Power Station Solution Market Forecast (USD Billion), by Sub-Segment 1, 2018-2029
Figure 91: Middle East & Africa New Energy Power Station Solution Market Forecast (USD Billion), by Sub-Segment 2, 2018-2029
Figure 92: Middle East & Africa New Energy Power Station Solution Market Forecast (USD Billion), by Sub-Segment 3, 2018-2029
Figure 93: Middle East & Africa New Energy Power Station Solution Market Forecast (USD Billion), by Others, 2018-2029
Figure 94: Middle East & Africa New Energy Power Station Solution Market Value Share (%), By Segment 3, 2022 & 2029
Figure 95: Middle East & Africa New Energy Power Station Solution Market Forecast (USD Billion), by Sub-Segment 1, 2018-2029
Figure 96: Middle East & Africa New Energy Power Station Solution Market Forecast (USD Billion), by Sub-Segment 2, 2018-2029
Figure 97: Middle East & Africa New Energy Power Station Solution Market Forecast (USD Billion), by Sub-Segment 3, 2018-2029
Figure 98: Middle East & Africa New Energy Power Station Solution Market Forecast (USD Billion), by Others, 2018-2029
Figure 99: Middle East & Africa New Energy Power Station Solution Market Forecast (USD Billion), by GCC, 2018-2029
Figure 100: Middle East & Africa New Energy Power Station Solution Market Forecast (USD Billion), by South Africa, 2018-2029
Figure 101: Middle East & Africa New Energy Power Station Solution Market Forecast (USD Billion), by Rest of Middle East & Africa, 2018-2029
List of Tables
Table 1: Global New Energy Power Station Solution Market Revenue (USD Billion) Forecast, by Segment 1, 2018-2029
Table 2: Global New Energy Power Station Solution Market Revenue (USD Billion) Forecast, by Segment 2, 2018-2029
Table 3: Global New Energy Power Station Solution Market Revenue (USD Billion) Forecast, by Segment 3, 2018-2029
Table 4: Global New Energy Power Station Solution Market Revenue (USD Billion) Forecast, by Region, 2018-2029
Table 5: North America New Energy Power Station Solution Market Revenue (USD Billion) Forecast, by Segment 1, 2018-2029
Table 6: North America New Energy Power Station Solution Market Revenue (USD Billion) Forecast, by Segment 2, 2018-2029
Table 7: North America New Energy Power Station Solution Market Revenue (USD Billion) Forecast, by Segment 3, 2018-2029
Table 8: North America New Energy Power Station Solution Market Revenue (USD Billion) Forecast, by Country, 2018-2029
Table 9: Europe New Energy Power Station Solution Market Revenue (USD Billion) Forecast, by Segment 1, 2018-2029
Table 10: Europe New Energy Power Station Solution Market Revenue (USD Billion) Forecast, by Segment 2, 2018-2029
Table 11: Europe New Energy Power Station Solution Market Revenue (USD Billion) Forecast, by Segment 3, 2018-2029
Table 12: Europe New Energy Power Station Solution Market Revenue (USD Billion) Forecast, by Country, 2018-2029
Table 13: Latin America New Energy Power Station Solution Market Revenue (USD Billion) Forecast, by Segment 1, 2018-2029
Table 14: Latin America New Energy Power Station Solution Market Revenue (USD Billion) Forecast, by Segment 2, 2018-2029
Table 15: Latin America New Energy Power Station Solution Market Revenue (USD Billion) Forecast, by Segment 3, 2018-2029
Table 16: Latin America New Energy Power Station Solution Market Revenue (USD Billion) Forecast, by Country, 2018-2029
Table 17: Asia Pacific New Energy Power Station Solution Market Revenue (USD Billion) Forecast, by Segment 1, 2018-2029
Table 18: Asia Pacific New Energy Power Station Solution Market Revenue (USD Billion) Forecast, by Segment 2, 2018-2029
Table 19: Asia Pacific New Energy Power Station Solution Market Revenue (USD Billion) Forecast, by Segment 3, 2018-2029
Table 20: Asia Pacific New Energy Power Station Solution Market Revenue (USD Billion) Forecast, by Country, 2018-2029
Table 21: Middle East & Africa New Energy Power Station Solution Market Revenue (USD Billion) Forecast, by Segment 1, 2018-2029
Table 22: Middle East & Africa New Energy Power Station Solution Market Revenue (USD Billion) Forecast, by Segment 2, 2018-2029
Table 23: Middle East & Africa New Energy Power Station Solution Market Revenue (USD Billion) Forecast, by Segment 3, 2018-2029
Table 24: Middle East & Africa New Energy Power Station Solution Market Revenue (USD Billion) Forecast, by Country, 2018-2029
Research Process
Data Library Research are conducted by industry experts who offer insight on
industry structure, market segmentations technology assessment and competitive landscape (CL), and penetration, as well as on emerging trends. Their analysis is based on primary interviews (~ 80%) and secondary research (~ 20%) as well as years of professional expertise in their respective industries. Adding to this, by analysing historical trends and current market positions, our analysts predict where the market will be headed for the next five years. Furthermore, the varying trends of segment & categories geographically presented are also studied and the estimated based on the primary & secondary research.
In this particular report from the supply side Data Library Research has conducted primary surveys (interviews) with the key level executives (VP, CEO’s, Marketing Director, Business Development Manager
and SOFT) of the companies that active & prominent as well as the midsized organization
FIGURE 1: DLR RESEARH PROCESS
![research-methodology1]()
Primary Research
Extensive primary research was conducted to gain a deeper insight of the market and industry performance. The analysis is based on both primary and secondary research as well as years of professional expertise in the respective industries.
In addition to analysing current and historical trends, our analysts predict where the market is headed over the next five years.
It varies by segment for these categories geographically presented in the list of market tables. Speaking about this particular report we have conducted primary surveys (interviews) with the key level executives (VP, CEO’s, Marketing Director, Business Development Manager and many more) of the major players active in the market.
Secondary Research
Secondary research was mainly used to collect and identify information useful for the extensive, technical, market-oriented, and Friend’s study of the Global Extra Neutral Alcohol. It was also used to obtain key information about major players, market classification and segmentation according to the industry trends, geographical markets, and developments related to the market and technology perspectives. For this study, analysts have gathered information from various credible sources, such as annual reports, sec filings, journals, white papers, SOFT presentations, and company web sites.
Market Size Estimation
Both, top-down and bottom-up approaches were used to estimate and validate the size of the Global market and to estimate the size of various other dependent submarkets in the overall Extra Neutral Alcohol. The key players in the market were identified through secondary research and their market contributions in the respective geographies were determined through primary and secondary research.
Forecast Model
![research-methodology2]()