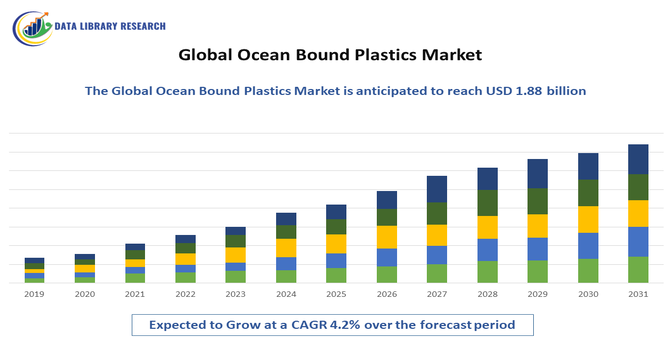
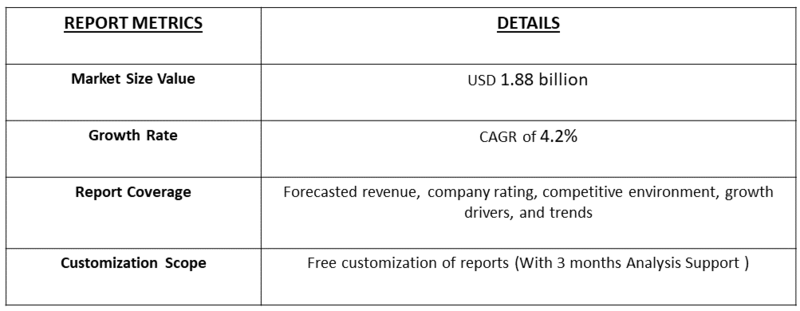
The Global Ocean-Bound Plastics Market is expected to be USD 1.50 billion in 2025, and is projected to grow to USD 1.88 billion by 2032, with a CAGR of 4.2%.
Get Complete Analysis Of The Report - Download Free Sample PDF
Ocean-bound plastics are discarded plastic waste that is at high risk of entering oceans and waterways, usually found within 50 kilometers of coastlines or in areas with poor waste management systems. If not collected and recycled, these plastics often get washed into rivers and seas, contributing to marine pollution and harming ecosystems. Common examples include plastic bottles, bags, and packaging materials left in coastal communities or dumped in unmanaged landfills. Recycling and repurposing ocean-bound plastics not only reduce environmental damage but also create opportunities for sustainable materials in industries like fashion, packaging, and consumer goods.
The global ocean-bound plastics market is witnessing steady growth as sustainability and circular economy initiatives gain momentum worldwide. With rising awareness of marine pollution and stricter regulations on single-use plastics, industries are increasingly adopting recycled materials to reduce environmental impact. Companies in packaging, fashion, consumer goods, and automotive sectors are integrating ocean-bound plastics into their products, creating strong demand. Technological advancements in waste collection, sorting, and recycling are improving efficiency and quality, further boosting adoption. Partnerships between governments, NGOs, and private players are also expanding collection networks, ensuring steady raw material supply and reinforcing the market’s long-term growth trajectory.
Segmentation:
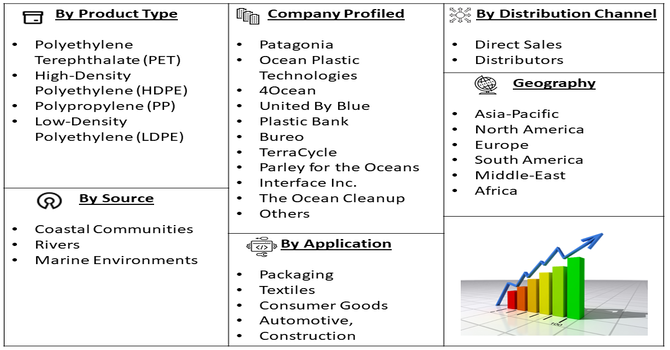
The Ocean-Bound Plastics Market is segmented by Material Type (Polyethylene Terephthalate (PET), High-Density Polyethylene (HDPE), Polypropylene (PP), Low-Density Polyethylene (LDPE)), Source (Coastal Communities, Rivers, and Marine Environments), Application (Packaging, Textiles, Consumer Goods, Automotive, and Construction), Distribution Channel (Direct Sales, and Distributors) and Geography (North America, Europe, Asia-Pacific, Middle East and Africa, and South America). The report provides the value (in USD million) for the above segments.
For Detailed Market Segmentation - Get a Free Sample PDF
Market Drivers:
The increasing environmental awareness and stricter government regulations are key drivers of the ocean-bound plastics market. With growing concerns about the impact of plastic pollution on marine ecosystems, many countries are enforcing bans on single-use plastics and strengthening waste management policies. Supportive measures like tax incentives and recycled content mandates further accelerate market growth.
For instance, in July 2025, Kia and The Ocean Cleanup, in partnership with Guatemala’s Ministry of Environment, launched an initiative to prevent 20,000 tons of plastic waste from the Motagua and Las Vacas Rivers from reaching the ocean annually. This project underscores Kia’s sustainability commitment and its increased use of recycled plastics in vehicles, reflecting how industry leaders are aligning with global environmental goals. Such initiatives, combined with rising consumer demand and supportive regulations, are not only reducing the flow of plastics into oceans but also creating a reliable supply of recycled materials. As a result, the market is being driven forward by a powerful blend of environmental responsibility, regulatory push, and corporate sustainability commitments, ensuring steady growth and positioning ocean-bound plastics as a key enabler of the global circular economy.
The technological advancements in recycling and processing ocean-bound plastics are playing a crucial role in driving market growth by improving both the efficiency and quality of recycled materials. Innovative methods now enable the effective recovery and repurposing of a wider range of plastics, including PET, HDPE, and PP, while reducing contamination and making them suitable for high-value applications.
Leading companies are investing in advanced sorting, cleaning, and processing technologies, lowering production costs and expanding the scope of industries that can adopt recycled ocean plastics. For instance, in January 2025, Samsung Electronics Co., Ltd. expanded its sustainability efforts by transforming discarded fishing nets into high-quality recycled material for Galaxy devices and supporting coral reef restoration projects with mobile technology. Such initiatives not only showcase how recycled plastics can be integrated into premium products but also highlight their role in restoring ecosystems and building sustainable value chains. These advancements strengthen the competitiveness of recycled plastics against virgin alternatives, ensuring long-term growth and wider adoption of ocean-bound plastics in global markets.
Market Restraints
The biggest restraint for the ocean-bound plastics market lies in the high economic and logistical challenges of collection and processing. Gathering OBP is highly labor-intensive, often dependent on informal waste networks in remote coastal regions. The collected material is usually heavily contaminated with salt, sand, and organic matter, which makes sorting, cleaning, and recycling more complex and costly compared to post-industrial or post-consumer plastics from formal systems. As a result, the recycled OBP resin frequently ends up being more expensive than virgin plastic, creating a strong economic barrier for cost-sensitive manufacturers unless driven by regulatory pressure or brand sustainability goals.
The Ocean Bound Plastics (OBP) market generates significant positive socio-economic impact by formalizing waste collection, creating stable employment in often impoverished coastal communities, and improving local health by cleaning up environments.
Pre-COVID, the market was nascent, with pilot projects slowly demonstrating this dual benefit of environmental and economic uplift. The post-COVID period, however, accelerated its growth; heightened public awareness of environmental issues and a corporate focus on resilient, ethical supply chains led to greater investment, scaling these community-based models and solidifying the link between waste management and socio-economic development. This market transforms a critical environmental threat into a valuable economic resource, fostering a circular economy that directly benefits the most vulnerable populations living at the forefront of the plastic pollution crisis.
Segmental Analysis
The HDPE segment is projected to record the fastest growth over the forecast period, supported by its superior strength, durability, and chemical resistance, which make it highly suitable for diverse packaging applications. Its compatibility with existing recycling processes ensures a consistent supply of high-quality recycled material, while its lightweight properties improve transportation efficiency and reduce costs.
Growing consumer preference for sustainable yet robust packaging further strengthens demand, with HDPE. For instance, in recent industry development reinforcing this trend is Arburg’s announcement in September 2025 to spotlight sustainability at K 2025 through its arburgGREENworld pavilion. With a focus on resource conservation, CO₂ reduction, and the circular economy, Arburg will showcase innovative recycling processes and alternative materials in a water-themed environment. This initiative not only highlights the role of HDPE and other recyclable plastics in advancing sustainability but also accelerates industry adoption by positioning recycled materials as central to the future of plastics, thereby directly fueling the growth of the HDPE segment.
Coastal communities are set to experience the highest growth in the ocean-bound plastics market because they play a critical role in collecting and processing ocean plastics. These communities benefit socioeconomically by generating income through plastic collection, recycling, and upcycling activities, supporting livelihoods, and encouraging social inclusion. Government and NGO initiatives focus on empowering these areas with tools, training, and infrastructure, fostering sustainable economic development. The increasing global emphasis on marine pollution management reinforces demand for community-level involvement, making coastal populations central players in the growth and success of the recycled ocean plastics market
The automotive segment is set to see the fastest growth in the recycled ocean plastics market as automakers seek lightweight, sustainable materials like ocean-bound HDPE and PP to boost fuel efficiency and meet strict emission norms. Rising consumer and regulatory demand for eco-friendly products is driving adoption in interiors, bumpers, and other components, while advances in recycling improve performance and reliability. For instance, Solgaard announced in April 2025 that it has removed over three million pounds of ocean-bound plastic through global cleanup initiatives, expanding raw material supply and reinforcing the role of recycled plastics in automotive innovation.
Distributors within the ocean-bound plastics market are expected to see the highest growth as they bridge raw material suppliers and end-use industries. Growing demand for recycled ocean plastics across sectors like packaging, automotive, and consumer goods is driving distributors to expand their networks and inventory. Their role in ensuring supply chain reliability, quality control, and timely delivery is critical to supporting manufacturers’ sustainability commitments. Additionally, distributors facilitate market expansion by connecting smaller producers to global markets and enabling scalable adoption of recycled materials, thus accelerating industry growth driven by eco-conscious buyers.
North America is expected to record the highest growth in the recycled ocean plastics market during the forecast period, driven by strong corporate sustainability commitments and stringent regulations on single-use plastics. The region benefits from advanced recycling infrastructure, high consumer awareness, and the rapid integration of eco-friendly materials across industries such as packaging, apparel, and automotive.
Government incentives and collaborative initiatives between public and private stakeholders further accelerate innovation and scaling. For instance, HP Inc., a member of NextWave Plastics, launched the HP Elite Dragonfly—the world’s first notebook designed with ocean-bound plastics. The device features a speaker enclosure made with 50% post-consumer recycled plastic, including 5% ocean-bound plastics. HP has also upcycled over one million pounds of plastic bottles through its recycling program in Haiti, showcasing how corporate action is translating sustainability goals into commercially viable products. This combination of regulatory push, consumer demand, and industry leadership firmly positions North America as a key growth hub for recycled ocean plastics.
To Learn More About This Report - Request a Free Sample Copy
The competitive landscape of the recycled ocean plastics market is characterized by early-stage growth moving toward consolidation. Initially, the market saw pilot programs and limited deployment focused on validating material quality and supply chain feasibility. As broader adoption occurs, leading companies are scaling up collection, recycling capacities, and distribution networks to meet rising demand from food, beverage, packaging, automotive, and apparel sectors. Growth is fueled by increasing consumer sustainability commitments, technological innovations in recycling, and regulatory pressures. Over time, established suppliers are expected to dominate through partnerships, acquisitions, and standardization of processes, aiming for cost efficiency, reliability, and predictable demand in a mature market.
Key companies active in this market include:
Recent Developments:
Q1. What the main growth driving factors for this market?
The primary driver is stringent corporate sustainability commitments and consumer demand for eco-friendly products, pushing brands to adopt OBP. Supportive government policies and extended producer responsibility (EPR) schemes, alongside innovations in collection and recycling infrastructure, are also crucial growth factors for this market.
Q2. What are the main restraining factors for this market?
High costs associated with collecting, sorting, and processing contaminated OBP compared to virgin plastics is a major restraint. The lack of standardized certification and traceability systems creates greenwashing concerns. Furthermore, complex supply chains in developing nations, where OBP is most prevalent, hinder efficient large-scale operations.
Q3. Which segment is expected to witness high growth?
The packaging segment is expected to witness the highest growth. Beverage, food, and personal care brands are aggressively adopting recycled OBP to meet sustainability goals and consumer expectations for circular economy packaging, making this the most significant and rapidly expanding application area.
Q4. Who are the top major players for this market?
Key players include materials giants like SABIC, Indorama Ventures, and LyondellBasell. Packaging specialists like ALPLA and Veolia, and certification bodies such as Zero Plastic Oceans, are also major influencers in developing and commercializing OBP supply chains and products.
Q5. Which country is the largest player?
The United States currently leads due to strong regulatory signals, corporate demand, and robust recycling infrastructure. Europe is a close second, driven by stringent Single-Use Plastic and Circular Economy initiatives. Rapid expansion in Asia-Pacific, especially China and India, signals a shifting global dominance in ocean-bound plastics.
Data Library Research are conducted by industry experts who offer insight on industry structure, market segmentations technology assessment and competitive landscape (CL), and penetration, as well as on emerging trends. Their analysis is based on primary interviews (~ 80%) and secondary research (~ 20%) as well as years of professional expertise in their respective industries. Adding to this, by analysing historical trends and current market positions, our analysts predict where the market will be headed for the next five years. Furthermore, the varying trends of segment & categories geographically presented are also studied and the estimated based on the primary & secondary research.
In this particular report from the supply side Data Library Research has conducted primary surveys (interviews) with the key level executives (VP, CEO’s, Marketing Director, Business Development Manager and SOFT) of the companies that active & prominent as well as the midsized organization
FIGURE 1: DLR RESEARH PROCESS
Extensive primary research was conducted to gain a deeper insight of the market and industry performance. The analysis is based on both primary and secondary research as well as years of professional expertise in the respective industries.
In addition to analysing current and historical trends, our analysts predict where the market is headed over the next five years.
It varies by segment for these categories geographically presented in the list of market tables. Speaking about this particular report we have conducted primary surveys (interviews) with the key level executives (VP, CEO’s, Marketing Director, Business Development Manager and many more) of the major players active in the market.
Secondary ResearchSecondary research was mainly used to collect and identify information useful for the extensive, technical, market-oriented, and Friend’s study of the Global Extra Neutral Alcohol. It was also used to obtain key information about major players, market classification and segmentation according to the industry trends, geographical markets, and developments related to the market and technology perspectives. For this study, analysts have gathered information from various credible sources, such as annual reports, sec filings, journals, white papers, SOFT presentations, and company web sites.
Market Size EstimationBoth, top-down and bottom-up approaches were used to estimate and validate the size of the Global market and to estimate the size of various other dependent submarkets in the overall Extra Neutral Alcohol. The key players in the market were identified through secondary research and their market contributions in the respective geographies were determined through primary and secondary research.
Forecast Model