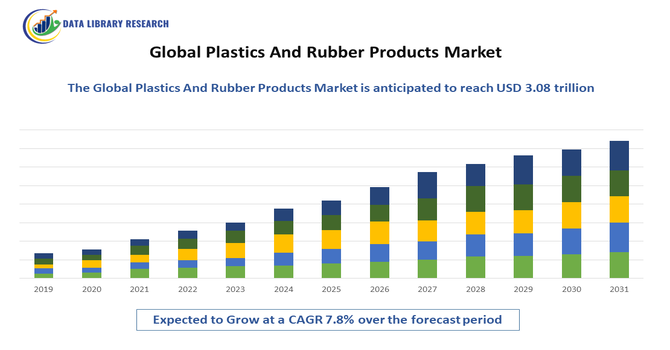
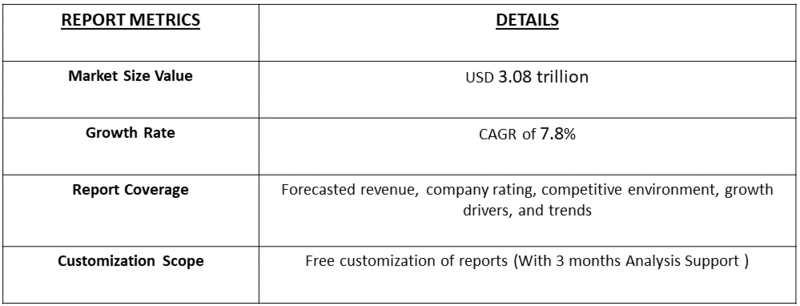
The global plastics and rubber products market was valued at nearly USD 1.78 trillion in 2025 and is projected to reach USD 3.08 trillion by 2032, growing with a CAGR of 7.8%.
Get Complete Analysis Of The Report - Download Free Sample PDF
Plastics and rubber products are manufactured by processing raw materials such as plastics resins and natural or synthetic rubber to create a wide variety of goods. Plastics products are typically produced through methods like injection molding, extrusion, compression molding, and blow molding, turning plastic resins into items such as bottles, packaging, pipes, and films. Rubber products are made by processing raw rubber through vulcanizing, molding, and extruding to produce tires, footwear, gaskets, seals, and mechanical goods. While plastics and rubber materials have distinct properties, their production is grouped together because of related polymer technologies. These products serve multiple industries including automotive, construction, healthcare, and packaging, highlighting their vast industrial and consumer applications.
The global plastic and rubber product market is undergoing significant transformation, driven by sustainability imperatives and evolving consumer demands. A major trend is the shift towards circular economy models, emphasizing recycling, bio-based plastics, and biodegradable rubber alternatives to reduce environmental impact. Regulatory pressures and consumer awareness are accelerating the adoption of eco-friendly materials and lightweight designs, particularly in packaging and automotive sectors to enhance fuel efficiency. Technological advancements in polymer science are enabling high-performance, smart materials with self-healing or conductive properties. However, the market faces challenges from volatile raw material prices and stringent regulations on single-use plastics, pushing innovation towards sustainable and compliant solutions.
Segmentation:
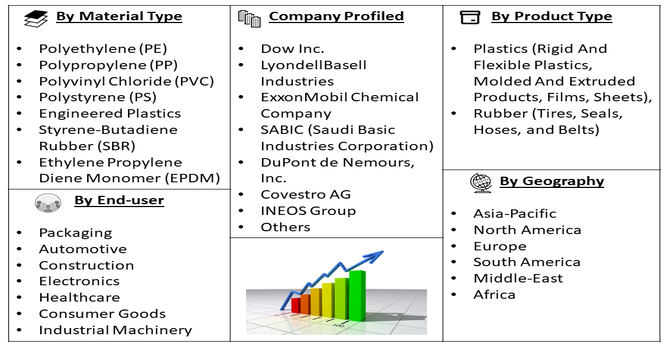
The global plastic and rubber product market is segmented by Material Type (Polyethylene (PE), Polypropylene (PP), Polyvinyl Chloride (PVC), Polystyrene (PS), and Engineered Plastics, Styrene-Butadiene Rubber (SBR) and Ethylene Propylene Diene Monomer (EPDM)), Product Type (Plastics (Rigid And Flexible Plastics, Molded And Extruded Products, Films, Sheets), and Rubber (Tires, Seals, Hoses, and Belts), End-use Industry (Packaging, Automotive, Construction, Electronics, Healthcare, Consumer Goods, and Industrial Machinery) and Geography (North America, Europe, Asia-Pacific, Middle East and Africa, and South America). The report provides the value (in USD million) for the above segments.
For Detailed Market Segmentation - Get a Free Sample PDF
Market Drivers:
The automotive industry remains one of the largest consumers of rubber and plastic products, with rising global vehicle production and sales—particularly in emerging economies—driving strong demand for tires, hoses, seals, lightweight components, and interior and exterior parts. The shift toward electric vehicles (EVs) is further amplifying this need, as EVs rely heavily on specialized rubber for battery management and thermal insulation, as well as advanced plastics for structural integrity and battery housing.
Automakers are increasingly adopting lightweight plastics to reduce vehicle weight, improving fuel efficiency and extending EV range. For instance, in August 2025, American Rheinmetall expanded its rubber product portfolio in the U.S. following its acquisition of Loc Performance. The expansion brings enhanced custom rubber compounding, proprietary formulations, and a broader range of high-performance components designed to serve agriculture, construction, defense, and industrial sectors, reinforcing the company’s position as a key player in the evolving rubber and plastic market.
The packaging sector represents one of the largest and most consistent drivers for the plastic product market, and increasingly, specialized rubber products are also finding their niche. The burgeoning e-commerce industry, coupled with a growing global population and urbanization, has led to an unprecedented surge in demand for protective, durable, and efficient packaging solutions.
Plastics, with their inherent properties of being lightweight, cost-effective, versatile, and offering excellent barrier properties, are the material of choice for food packaging, consumer goods, and industrial products. While concerns about plastic waste are prompting innovation towards recyclable and biodegradable options, the sheer volume and essentiality of packaging in global trade and consumption ensure its continued growth as a key market driver.
Market Restraints
Growing global awareness and concern regarding plastic pollution and its environmental impact pose a significant restraint on the rubber and plastic product market. Governments worldwide are implementing increasingly stringent regulations, including bans on single-use plastics, imposition of taxes on plastic products, and mandates for increased recycled content. These regulations can lead to higher production costs, restrict the use of certain materials, and necessitate substantial investment in R&D for sustainable alternatives. The negative public perception surrounding plastic waste can also affect consumer purchasing decisions, pushing them towards eco-friendlier options, thereby limiting the growth trajectory of conventional plastic products and compelling manufacturers to adapt to a more sustainable production
The plastics and rubber products market has significant socio-economic impact as it underpins essential industries like packaging, automotive, construction, and healthcare, generating millions of jobs worldwide and driving trade flows. Pre-COVID-19, the market grew steadily on industrialization and consumer demand, while the pandemic disrupted supply chains, reduced automotive demand, and shifted focus toward healthcare plastics, PPE, and e-commerce packaging. Post-COVID, the market rebounded strongly, with accelerated adoption of sustainable materials, automation in manufacturing, and renewed demand across construction and mobility, reinforcing its role as a backbone of global industrial and consumer economies.
Segmental Analysis:
The Ethylene Propylene Diene Monomer (EPDM) segment is poised for substantial growth due to its exceptional durability, resistance to weathering, ozone, and heat, making it ideal for demanding applications. Its use in the automotive industry for weather stripping, hoses, and seals, as well as in construction for roofing membranes and window seals, is expanding.
Furthermore, EPDM's increasing adoption in electrical insulation, appliance components, and as a modifier for plastics and rubber compounds, owing to its enhanced flexibility and resilience, is significantly boosting its market presence. Innovations leading to improved processing and performance characteristics will continue to fuel this upward trend in demand. Also, the launch of new product is also driving this segments’s growth. For instance, in July 2024, Dow launched of NORDEL REN Ethylene Propylene Diene Terpolymers (EPDM), a bio-based version of its widely used EPDM rubber material applied across automotive, infrastructure, and consumer industries. This development not only enhanced Dow’s sustainable product portfolio but also drove the growth of the EPDM segment by aligning with the rising emphasis on decarbonization and regulatory push for greener solutions.
The tires segment is a cornerstone of the rubber product market and is projected for robust growth. The ever-increasing global vehicle parc, coupled with a consistent replacement cycle, forms the bedrock of demand. The burgeoning automotive sector, particularly in emerging economies, and the rising production of electric vehicles (EVs) are key growth catalysts. EVs necessitate specialized tires designed for lower rolling resistance, enhanced durability, and quieter performance, driving innovation.
Technological advancements in tire materials, such as the incorporation of silica and other advanced compounds to improve fuel efficiency, grip, and longevity, are further stimulating growth and pushing the boundaries of tire performance. For instance, in August 2025, CEAT launched SecuraDrive CIRCL, India’s first passenger car tyre designed with up to 90% sustainable materials, engineered for eco-smart mobility, SecuraDrive CIRCL delivers sustainability marking a significant milestone in the future of green mobility solutions and driving the usage of Tyre segment, thereby contributing to overall market’s growth.
The packaging industry segment is a powerhouse for plastic products and is expected to continue its significant growth trajectory. The relentless expansion of e-commerce, coupled with rising consumerism and a growing global population, fuels an insatiable demand for various packaging solutions. While environmental concerns are driving a shift towards sustainable options like recycled plastics and bioplastics, conventional plastics like polyethylene and polypropylene remain dominant due to their cost-effectiveness, versatility, and excellent barrier properties for food preservation and product protection. Innovations in flexible packaging, smart packaging, and lightweighting are further contributing to the segment's sustained expansion, adapting to evolving consumer and industrial needs.
The Asia Pacific region is set to witness the most significant growth in the rubber and plastic product market. This expansion is propelled by rapid industrialization, robust economic growth, and a burgeoning middle class in countries like China, India, and Southeast Asian nations.
Furthermore, substantial investments in manufacturing infrastructure and favorable government policies promoting domestic production are contributing to the region's dominance. For instance in May 2025, The Yokohama Rubber Co., Ltd. acquired the fixed assets—including land, buildings, and OTR tire production machinery—of a closed plant in Romania through its off-highway tire (OHT) subsidiary, Yokohama TWS Romania S.R.L. This Yokohama’s strategic investments was aimed at increasing the Group’s production capacity for mining and construction machinery tires. It also marked a significant step in expanding Yokohama Rubber’s OHT product lineup and strengthening its production and supply capabilities across all OHT categories, ultimately enhancing its competitiveness in the global OHT market and boosting corporate value. Thus, such developments are driving the growth of the studied market in APAC region.
To Learn More About This Report - Request a Free Sample Copy
The competitive landscape of the plastics and rubber products market is highly fragmented yet marked by a number of very large, diversified players that dominate by investing heavily in R&D, sustainability, and scale. Firms such as BASF, Dow, ExxonMobil, SABIC, LG Chem, Bridgestone, Michelin, Good Year, Freudenberg, and Toray are major players, offering broad product portfolios — from high-performance elastomers to bio-based plastics — and leveraging strategic partnerships, acquisitions and innovations to stay ahead.
These major players compete not only on price and volume, but increasingly on sustainability credentials (recycled content, biodegradables), regulatory compliance, material performance (durability, weight, thermal resistance), and the ability to serve fast-growing end-use segments such as automotive, packaging, and electronics. Smaller regional players and niche firms also occupy important roles, particularly in specialty rubber products, additives, or market-adjacent materials, often differentiating themselves by custom formulations or local supply chain strength.
Here are 10 major players in the Global Plastic and Rubber Products market:
Recent Developments:
Q1. What are the main growth driving factors for this market?
The global plastic and rubber product market is driven by rising demand in packaging, automotive, construction, healthcare, and electronics. Growing urbanization, lightweight materials in vehicles, and increasing consumption of packaged goods fuel growth. Technological advancements in sustainable plastics and recycling innovations further strengthen market expansion across both developed and emerging economies.
Q2. What are the main restraining factors for this market?
Key restraints include strict environmental regulations against single-use plastics, volatility in raw material prices, and growing consumer preference for eco-friendly alternatives. Rising concerns over plastic waste management, bans on non-biodegradable materials, and pressure to adopt costly sustainable solutions also challenge market growth, especially in regions with stringent environmental policies and compliance norms.
Q3. Which segment is expected to witness high growth?
The packaging segment is expected to witness the highest growth, driven by the booming e-commerce sector, increasing demand for food and beverage packaging, and rising consumer preference for convenience products. Flexible packaging and sustainable, recyclable materials are particularly in demand, making packaging the most dynamic and rapidly expanding segment within the market.
Q4. Who are the top major players for this market?
Major players in the global plastic and rubber product market include BASF SE, Dow Inc., ExxonMobil Chemical, SABIC, Arkema, Bridgestone Corporation, Goodyear Tire & Rubber Company, LG Chem, Covestro AG, and Michelin. These companies dominate through wide product portfolios, strong global presence, innovation in sustainable solutions, and continuous strategic mergers and acquisitions.
Q5. Which country is the largest player?
China is the largest player in the global plastic and rubber product market, supported by its massive manufacturing base, cost-effective production capabilities, and extensive supply chain networks. Strong domestic demand, government initiatives promoting industrial expansion, and a dominant role in global exports further cement China’s leadership position in this market.
Data Library Research are conducted by industry experts who offer insight on industry structure, market segmentations technology assessment and competitive landscape (CL), and penetration, as well as on emerging trends. Their analysis is based on primary interviews (~ 80%) and secondary research (~ 20%) as well as years of professional expertise in their respective industries. Adding to this, by analysing historical trends and current market positions, our analysts predict where the market will be headed for the next five years. Furthermore, the varying trends of segment & categories geographically presented are also studied and the estimated based on the primary & secondary research.
In this particular report from the supply side Data Library Research has conducted primary surveys (interviews) with the key level executives (VP, CEO’s, Marketing Director, Business Development Manager and SOFT) of the companies that active & prominent as well as the midsized organization
FIGURE 1: DLR RESEARH PROCESS
Extensive primary research was conducted to gain a deeper insight of the market and industry performance. The analysis is based on both primary and secondary research as well as years of professional expertise in the respective industries.
In addition to analysing current and historical trends, our analysts predict where the market is headed over the next five years.
It varies by segment for these categories geographically presented in the list of market tables. Speaking about this particular report we have conducted primary surveys (interviews) with the key level executives (VP, CEO’s, Marketing Director, Business Development Manager and many more) of the major players active in the market.
Secondary ResearchSecondary research was mainly used to collect and identify information useful for the extensive, technical, market-oriented, and Friend’s study of the Global Extra Neutral Alcohol. It was also used to obtain key information about major players, market classification and segmentation according to the industry trends, geographical markets, and developments related to the market and technology perspectives. For this study, analysts have gathered information from various credible sources, such as annual reports, sec filings, journals, white papers, SOFT presentations, and company web sites.
Market Size EstimationBoth, top-down and bottom-up approaches were used to estimate and validate the size of the Global market and to estimate the size of various other dependent submarkets in the overall Extra Neutral Alcohol. The key players in the market were identified through secondary research and their market contributions in the respective geographies were determined through primary and secondary research.
Forecast Model