Oil and Crude Oil Marine Transportation Service Market Overview and Analysis
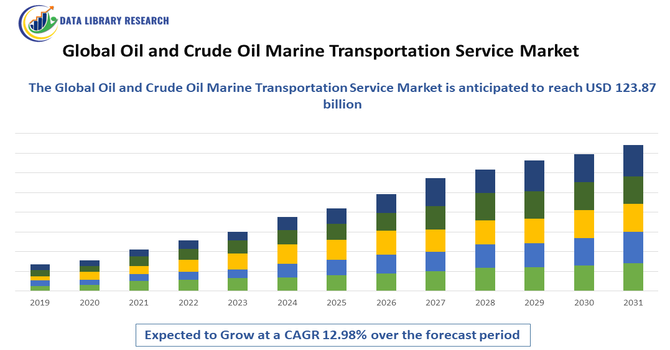
- The Global Oil and Crude Oil Marine Transportation Service Market is valued at USD 72.9 billion in 2025 and expected to reach 123.87 billion in 2032, growing with a CAGR of 12.98% from 2025 to 2032.
Get Complete Analysis Of The Report - Download Updated Free Sample PDF
The growth of the Global Oil and Crude Oil Marine Transportation Service Market is primarily driven by the continued reliance on seaborne trade for the movement of crude oil and refined petroleum products across international markets. Rising global energy demand, particularly from emerging economies, is increasing the volume of crude oil transported via tankers. Additionally, the strategic importance of oil supply security, growth in long-distance trade routes, and investments in modern tanker fleets with enhanced capacity and fuel efficiency are strengthening market growth.
Oil and Crude Oil Marine Transportation Service Market Latest Trends
The Global Oil and Crude Oil Marine Transportation Service Market is witnessing notable trends driven by fleet modernization, digitalization, and sustainability initiatives. Shipping companies are increasingly investing in eco-friendly and fuel-efficient tankers, including LNG-powered and dual-fuel vessels, to comply with stricter IMO emission regulations. The adoption of digital fleet management systems, real-time vessel tracking, and predictive maintenance technologies is improving operational efficiency and safety. Additionally, there is a growing focus on very large crude carriers (VLCCs) to optimize long-haul transportation costs. Enhanced safety standards, automation in cargo handling, and strategic route diversification to manage geopolitical risks are also shaping current market trends.
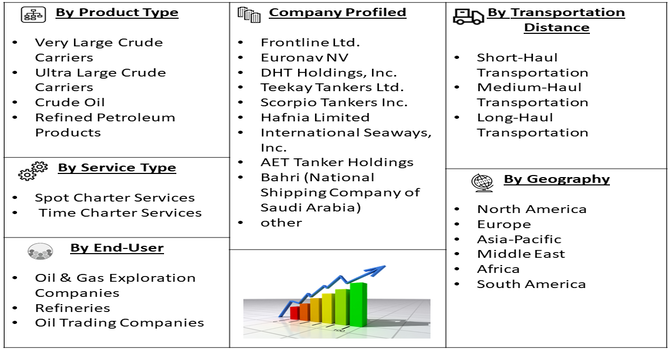
Segmentation: Global Oil and Crude Oil Marine Transportation Service Market is segmented By Vessel Type (Very Large Crude Carriers, Ultra Large Crude Carriers, Suezmax Tankers, Aframax Tankers), Cargo Type (Crude Oil, Refined Petroleum Products), Transportation Distance (Short-Haul Transportation, Medium-Haul Transportation, Long-Haul Transportation), Service Type (Spot Charter Services, Time Charter Services), End-User (Oil & Gas Exploration Companies, Refineries, Oil Trading Companies), and Geography (North America, Europe, Asia-Pacific, Middle East and Africa, and South America). The report provides the value (in USD million) for the above segments.
For Detailed Market Segmentation - Get a Free Sample PDF
Market Drivers:
- Rising Global Demand for Crude Oil and Petroleum Products
The continuous growth in global energy consumption remains a major driver for oil and crude oil marine transportation services. Rapid industrialization, urbanization, and population growth—particularly in emerging economies across Asia-Pacific, the Middle East, and Africa—are increasing demand for crude oil and refined petroleum products. For instance, in October 2025, the Indian Ministry of Petroleum and Natural Gas highlighted that India’s GDP had reached USD 4.3 trillion, with ~50% from external trade, crude consumption rising from 5.0 to 5.6 mbpd and nearing 6 mbpd, imports of ~300 MMT, exports of ~65 MMT, and 88% crude import dependence. These trends have significantly driven rising global crude demand and strengthened the global oil and crude oil marine transportation service market through higher seaborne trade volumes.
As many consuming regions lack sufficient domestic production capacity, crude oil must be transported over long distances from oil-rich regions to refineries and consumption hubs. Marine transportation remains the most cost-effective and scalable mode for bulk oil movement, thereby driving sustained demand for tanker services globally.
- Expansion of Offshore Oil Exploration and Production Activities
The growing focus on offshore oil and gas exploration, including deepwater and ultra-deepwater projects, is significantly driving the demand for marine transportation services. Offshore production facilities rely heavily on tankers and shuttle vessels to transport crude oil to onshore terminals and refineries.
Increasing investments by oil-producing nations and energy companies to develop offshore reserves, particularly in regions such as the North Sea, Gulf of Mexico, West Africa, and Brazil, are boosting seaborne crude oil volumes. For instance, in October 2025, bp had drilled the 1-BP-13-SPS exploration well in the Bumerangue block in the Santos Basin, 404 kilometers offshore Rio de Janeiro, reaching a depth of 5,855 meters. The discovery supported expansion of offshore exploration and production activities and strengthened the global oil and crude oil marine transportation service market by increasing future offshore output and seaborne logistics demand. This expansion strengthens the need for reliable, large-capacity marine transportation services.
Market Restraints:
- Stringent Environmental Regulations and Compliance Costs
The oil and crude oil marine transportation market faces significant restraints due to increasingly strict environmental regulations imposed by international maritime authorities such as the International Maritime Organization (IMO). Regulations related to sulfur emissions (IMO 2020), greenhouse gas reduction targets, ballast water management, and oil spill prevention require shipping companies to invest heavily in cleaner fuels, exhaust gas cleaning systems (scrubbers), and upgraded vessel designs. These compliance measures substantially increase capital and operating costs for tanker operators, particularly smaller players, which can limit fleet expansion and reduce profitability.
Socioeconomic Impact on Oil and Crude Oil Marine Transportation Service Market
The global Oil and Crude Oil Marine Transportation Service Market significantly shapes socioeconomic dynamics by enabling the large-scale movement of crude oil that fuels industry, transportation, and energy production worldwide, supporting economic growth, job creation in shipping and port sectors, and international trade, particularly in rapidly developing regions such as the Asia Pacific, where energy demand is rising. However, its volatility—driven by fluctuating oil prices, geopolitical tensions, sanctions, and route disruptions—can raise freight and fuel costs, stoke inflation, and strain supply chains, which in turn impacts consumer prices and economic stability. The industry also faces regulatory and environmental challenges that require investment in cleaner technologies and compliance, influencing operational costs and labor markets. Furthermore, reliance on marine oil transport intersects with broader global economic conditions, where downturns can reduce demand and threaten financial stability for operators and workers alike, while growth supports ancillary sectors from shipbuilding to logistics.
Segmental Analysis:
- Very Large Crude Carriers segment is expected to witness the highest growth over the forecast period
Very Large Crude Carriers play a crucial role in global oil transportation due to their high cargo capacity and cost efficiency for long-distance routes. VLCCs are widely used to transport crude oil from major production regions such as the Middle East to large refining hubs in Asia, Europe, and North America. Their ability to move massive oil volumes in a single voyage significantly reduces per-barrel transportation costs, making them a preferred choice for international crude oil trade and contributing substantially to overall market value.
- Crude Oil segment is expected to witness the highest growth over the forecast period
Crude oil represents the dominant cargo type in marine transportation, as it constitutes the largest share of global seaborne oil trade. The continuous demand for crude oil by refineries worldwide, especially in energy-importing nations, drives sustained shipping volumes. Marine transportation remains the most efficient method for moving crude oil in bulk over long distances, supporting consistent demand for tanker services and reinforcing the importance of this segment within the market.
- Long-Haul Transportation segment is expected to witness the highest growth over the forecast period
Long-haul transportation is a key segment due to the geographical separation between crude oil production centers and major consumption regions. Oil transported from the Middle East, West Africa, and South America to Asia-Pacific, Europe, and North America typically requires long-distance shipping. This segment benefits from higher freight rates and greater reliance on large-capacity vessels, making it a significant contributor to market revenues and growth.
- Time Charter Services segment is expected to witness the highest growth over the forecast period
Time charter services are widely adopted by oil companies and traders seeking stable and predictable transportation arrangements. Under this model, vessels are leased for a fixed period, allowing charterers to manage logistics efficiently while minimizing exposure to freight rate volatility. The growing preference for long-term supply contracts and operational reliability is driving the demand for time charter services in the oil and crude oil marine transportation market.
- Refineries segment is expected to witness the highest growth over the forecast period
Refineries are major end-users of marine transportation services, relying heavily on tankers to secure a steady supply of crude oil from global production regions. As refining capacity continues to expand, particularly in Asia-Pacific and the Middle East, refineries increasingly depend on efficient and timely marine logistics. This sustained demand makes refineries a critical driver of market growth and service utilization.
- North America region is expected to witness the highest growth over the forecast period
North America region is expected to witness the highest growth over the forecast period, driven by increasing crude oil production, expansion of offshore exploration activities, and rising export volumes from the United States and Canada. For instance, in 2024, Kosmos Energy Ltd. announced the successful start-up of oil production at the Winterfell development in the Green Canyon area of the U.S. Gulf of Mexico. The phased project brought two wells online, with a third under drilling, targeting gross output of about 20,000 boepd. This development had strengthened North America’s oil and crude oil marine transportation service market by increasing offshore production, boosting tanker demand, and supporting regional export and logistics activities.
Similarly, in October 2024, Rigs drilling in the deep waters of the Gulf of Mexico had driven U.S. oil industry growth as onshore output slowed due to lower prices and maturing shale fields. Improved technology and supportive regulations had attracted offshore investment. This shift had positively impacted North America’s oil and crude oil marine transportation service market by increasing offshore output, vessel utilization, and demand for tanker and offshore logistics services.
The region’s growing focus on energy independence, supported by investments in port infrastructure and marine logistics, is strengthening demand for oil and crude oil marine transportation services. Additionally, the presence of advanced tanker fleets, favorable trade dynamics, and rising cross-border crude oil movements are further contributing to the region’s strong growth outlook during the forecast period.
| Report Matrics |
Details |
| Market Size Value |
USD 123.87 billion |
| Growth Rate |
CAGR of 12.98 % |
| Forecast |
2026-2033 |
| Historical data |
2021-2024 |
| Base Year |
2025 |
| Report Coverage |
Forecasted revenue, company rating, competitive environment, growth drivers, and trends |
| Segment Coverage |
Type, Application, End-User, Geography |
| Regional Scope |
North America, Europe, Asia Pacific, Middle East |
| Customized scope |
Free customization of reports (With 3 months Analysis Support ) |
| To Learn More About This Report |
Request a Free Sample Copy |
Oil and Crude Oil Marine Transportation Service Market Competitive Landscape
The competitive landscape of the Global Oil and Crude Oil Marine Transportation Service Market is characterized by the presence of large international tanker operators and specialized maritime logistics providers competing on fleet size, vessel efficiency, safety standards, and global route coverage. Market players focus on fleet modernization, compliance with environmental regulations, operational efficiency, and long-term charter agreements to strengthen their market position. Strategic alliances with oil producers, refiners, and trading companies, along with investments in fuel-efficient and technologically advanced vessels, are key competitive strategies. The market remains moderately consolidated, with leading players dominating long-haul and high-capacity crude transportation routes.
Key Players:
- Frontline Ltd.
- Euronav NV
- DHT Holdings, Inc.
- Teekay Tankers Ltd.
- Scorpio Tankers Inc.
- Hafnia Limited
- International Seaways, Inc.
- AET Tanker Holdings
- Bahri (National Shipping Company of Saudi Arabia)
- COSCO Shipping Energy Transportation
- MOL (Mitsui O.S.K. Lines)
- NYK Line
- Hyundai Merchant Marine (HMM)
- China Merchants Energy Shipping
- Navig8 Group
- Tsakos Energy Navigation
- Nordic American Tankers
- Anglo-Eastern Ship Management
- Petrobras Transporte S.A. (Transpetro)
- Maersk Tankers
Recent Development
- In 2025, Maritime Partners, LLC announced that its flagship fund had acquired Centerline Logistics Corporation, integrating the company into its diversified marine asset portfolio while retaining Centerline’s experienced management under CEO Matt Godden. This acquisition strengthened capacity, operational efficiency, and service reliability, positively impacting the global oil and crude oil marine transportation service market by enhancing fleet scale and regional connectivity.
- In November 2025, Enterprise Products Partners L.P. announced that it had executed an agreement with ExxonMobil for the acquisition of a 40% undivided joint interest in its Bahia NGL pipeline, subject to regulatory approvals. This development supported global oil and crude oil marine transportation by strengthening midstream connectivity, improving export efficiency, and increasing seaborne hydrocarbon trade volumes.
Frequently Asked Questions (FAQ) :
Q1. What are the main growth-driving factors for this market?
The primary drivers are the consistent increase in global energy demand, especially from developing economies in the Asia-Pacific region, and the geographical mismatch between major oil production centers (like the Middle East and North America) and large consumption markets. This necessitates extensive long-distance seaborne transport via tankers.
Q2. What are the main restraining factors for this market?
Major restraining factors include high volatility in global crude oil prices and global economic slowdowns, which directly reduce demand for oil. Additionally, stringent environmental regulations, particularly regarding vessel emissions (e.g., IMO 2020), impose significant operational and high compliance costs on fleet operators.
Q3. Which segment is expected to witness high growth?
The time charter services segment is expected to witness the highest growth over the forecast period due to its cost efficiency, operational flexibility, and predictable budgeting for charterers, making it an attractive option for oil companies seeking stable transportation solutions amid volatile fuel prices and changing trade routes.
Q4. Who are the top major players for this market?
The market is led by large tanker shipping companies that operate extensive fleets of crude oil and product tankers. Top global players include NYK Line, "K" LINE, MOL (Mitsui O.S.K. Lines), COSCO SHIPPING Energy Transportation, and Frontline Ltd., which command a substantial portion of the global fleet capacity.
Q5. Which country is the largest player?
North America (primarily the U.S.) is considered the largest market in terms of revenue share for crude oil transportation services. This is due to its expansive domestic production (shale oil), robust export capabilities, and a highly developed maritime and pipeline infrastructure supporting global trade.
List of Figures
Figure 1: Global Oil and Crude Oil Marine Transportation Service Market Revenue Breakdown (USD Billion, %) by Region, 2022 & 2029
Figure 2: Global Oil and Crude Oil Marine Transportation Service Market Value Share (%), By Segment 1, 2022 & 2029
Figure 3: Global Oil and Crude Oil Marine Transportation Service Market Forecast (USD Billion), by Sub-Segment 1, 2018-2029
Figure 4: Global Oil and Crude Oil Marine Transportation Service Market Forecast (USD Billion), by Sub-Segment 2, 2018-2029
Figure 5: Global Oil and Crude Oil Marine Transportation Service Market Value Share (%), By Segment 2, 2022 & 2029
Figure 6: Global Oil and Crude Oil Marine Transportation Service Market Forecast (USD Billion), by Sub-Segment 1, 2018-2029
Figure 7: Global Oil and Crude Oil Marine Transportation Service Market Forecast (USD Billion), by Sub-Segment 2, 2018-2029
Figure 8: Global Oil and Crude Oil Marine Transportation Service Market Forecast (USD Billion), by Sub-Segment 3, 2018-2029
Figure 9: Global Oil and Crude Oil Marine Transportation Service Market Forecast (USD Billion), by Others, 2018-2029
Figure 10: Global Oil and Crude Oil Marine Transportation Service Market Value Share (%), By Segment 3, 2022 & 2029
Figure 11: Global Oil and Crude Oil Marine Transportation Service Market Forecast (USD Billion), by Sub-Segment 1, 2018-2029
Figure 12: Global Oil and Crude Oil Marine Transportation Service Market Forecast (USD Billion), by Sub-Segment 2, 2018-2029
Figure 13: Global Oil and Crude Oil Marine Transportation Service Market Forecast (USD Billion), by Sub-Segment 3, 2018-2029
Figure 14: Global Oil and Crude Oil Marine Transportation Service Market Forecast (USD Billion), by Others, 2018-2029
Figure 15: Global Oil and Crude Oil Marine Transportation Service Market Value (USD Billion), by Region, 2022 & 2029
Figure 16: North America Oil and Crude Oil Marine Transportation Service Market Value Share (%), By Segment 1, 2022 & 2029
Figure 17: North America Oil and Crude Oil Marine Transportation Service Market Forecast (USD Billion), by Sub-Segment 1, 2018-2029
Figure 18: North America Oil and Crude Oil Marine Transportation Service Market Forecast (USD Billion), by Sub-Segment 2, 2018-2029
Figure 19: North America Oil and Crude Oil Marine Transportation Service Market Value Share (%), By Segment 2, 2022 & 2029
Figure 20: North America Oil and Crude Oil Marine Transportation Service Market Forecast (USD Billion), by Sub-Segment 1, 2018-2029
Figure 21: North America Oil and Crude Oil Marine Transportation Service Market Forecast (USD Billion), by Sub-Segment 2, 2018-2029
Figure 22: North America Oil and Crude Oil Marine Transportation Service Market Forecast (USD Billion), by Sub-Segment 3, 2018-2029
Figure 23: North America Oil and Crude Oil Marine Transportation Service Market Forecast (USD Billion), by Others, 2018-2029
Figure 24: North America Oil and Crude Oil Marine Transportation Service Market Value Share (%), By Segment 3, 2022 & 2029
Figure 25: North America Oil and Crude Oil Marine Transportation Service Market Forecast (USD Billion), by Sub-Segment 1, 2018-2029
Figure 26: North America Oil and Crude Oil Marine Transportation Service Market Forecast (USD Billion), by Sub-Segment 2, 2018-2029
Figure 27: North America Oil and Crude Oil Marine Transportation Service Market Forecast (USD Billion), by Sub-Segment 3, 2018-2029
Figure 28: North America Oil and Crude Oil Marine Transportation Service Market Forecast (USD Billion), by Others, 2018-2029
Figure 29: North America Oil and Crude Oil Marine Transportation Service Market Forecast (USD Billion), by U.S., 2018-2029
Figure 30: North America Oil and Crude Oil Marine Transportation Service Market Forecast (USD Billion), by Canada, 2018-2029
Figure 31: Latin America Oil and Crude Oil Marine Transportation Service Market Value Share (%), By Segment 1, 2022 & 2029
Figure 32: Latin America Oil and Crude Oil Marine Transportation Service Market Forecast (USD Billion), by Sub-Segment 1, 2018-2029
Figure 33: Latin America Oil and Crude Oil Marine Transportation Service Market Forecast (USD Billion), by Sub-Segment 2, 2018-2029
Figure 34: Latin America Oil and Crude Oil Marine Transportation Service Market Value Share (%), By Segment 2, 2022 & 2029
Figure 35: Latin America Oil and Crude Oil Marine Transportation Service Market Forecast (USD Billion), by Sub-Segment 1, 2018-2029
Figure 36: Latin America Oil and Crude Oil Marine Transportation Service Market Forecast (USD Billion), by Sub-Segment 2, 2018-2029
Figure 37: Latin America Oil and Crude Oil Marine Transportation Service Market Forecast (USD Billion), by Sub-Segment 3, 2018-2029
Figure 38: Latin America Oil and Crude Oil Marine Transportation Service Market Forecast (USD Billion), by Others, 2018-2029
Figure 39: Latin America Oil and Crude Oil Marine Transportation Service Market Value Share (%), By Segment 3, 2022 & 2029
Figure 40: Latin America Oil and Crude Oil Marine Transportation Service Market Forecast (USD Billion), by Sub-Segment 1, 2018-2029
Figure 41: Latin America Oil and Crude Oil Marine Transportation Service Market Forecast (USD Billion), by Sub-Segment 2, 2018-2029
Figure 42: Latin America Oil and Crude Oil Marine Transportation Service Market Forecast (USD Billion), by Sub-Segment 3, 2018-2029
Figure 43: Latin America Oil and Crude Oil Marine Transportation Service Market Forecast (USD Billion), by Others, 2018-2029
Figure 44: Latin America Oil and Crude Oil Marine Transportation Service Market Forecast (USD Billion), by Brazil, 2018-2029
Figure 45: Latin America Oil and Crude Oil Marine Transportation Service Market Forecast (USD Billion), by Mexico, 2018-2029
Figure 46: Latin America Oil and Crude Oil Marine Transportation Service Market Forecast (USD Billion), by Rest of Latin America, 2018-2029
Figure 47: Europe Oil and Crude Oil Marine Transportation Service Market Value Share (%), By Segment 1, 2022 & 2029
Figure 48: Europe Oil and Crude Oil Marine Transportation Service Market Forecast (USD Billion), by Sub-Segment 1, 2018-2029
Figure 49: Europe Oil and Crude Oil Marine Transportation Service Market Forecast (USD Billion), by Sub-Segment 2, 2018-2029
Figure 50: Europe Oil and Crude Oil Marine Transportation Service Market Value Share (%), By Segment 2, 2022 & 2029
Figure 51: Europe Oil and Crude Oil Marine Transportation Service Market Forecast (USD Billion), by Sub-Segment 1, 2018-2029
Figure 52: Europe Oil and Crude Oil Marine Transportation Service Market Forecast (USD Billion), by Sub-Segment 2, 2018-2029
Figure 53: Europe Oil and Crude Oil Marine Transportation Service Market Forecast (USD Billion), by Sub-Segment 3, 2018-2029
Figure 54: Europe Oil and Crude Oil Marine Transportation Service Market Forecast (USD Billion), by Others, 2018-2029
Figure 55: Europe Oil and Crude Oil Marine Transportation Service Market Value Share (%), By Segment 3, 2022 & 2029
Figure 56: Europe Oil and Crude Oil Marine Transportation Service Market Forecast (USD Billion), by Sub-Segment 1, 2018-2029
Figure 57: Europe Oil and Crude Oil Marine Transportation Service Market Forecast (USD Billion), by Sub-Segment 2, 2018-2029
Figure 58: Europe Oil and Crude Oil Marine Transportation Service Market Forecast (USD Billion), by Sub-Segment 3, 2018-2029
Figure 59: Europe Oil and Crude Oil Marine Transportation Service Market Forecast (USD Billion), by Others, 2018-2029
Figure 60: Europe Oil and Crude Oil Marine Transportation Service Market Forecast (USD Billion), by U.K., 2018-2029
Figure 61: Europe Oil and Crude Oil Marine Transportation Service Market Forecast (USD Billion), by Germany, 2018-2029
Figure 62: Europe Oil and Crude Oil Marine Transportation Service Market Forecast (USD Billion), by France, 2018-2029
Figure 63: Europe Oil and Crude Oil Marine Transportation Service Market Forecast (USD Billion), by Italy, 2018-2029
Figure 64: Europe Oil and Crude Oil Marine Transportation Service Market Forecast (USD Billion), by Spain, 2018-2029
Figure 65: Europe Oil and Crude Oil Marine Transportation Service Market Forecast (USD Billion), by Russia, 2018-2029
Figure 66: Europe Oil and Crude Oil Marine Transportation Service Market Forecast (USD Billion), by Rest of Europe, 2018-2029
Figure 67: Asia Pacific Oil and Crude Oil Marine Transportation Service Market Value Share (%), By Segment 1, 2022 & 2029
Figure 68: Asia Pacific Oil and Crude Oil Marine Transportation Service Market Forecast (USD Billion), by Sub-Segment 1, 2018-2029
Figure 69: Asia Pacific Oil and Crude Oil Marine Transportation Service Market Forecast (USD Billion), by Sub-Segment 2, 2018-2029
Figure 70: Asia Pacific Oil and Crude Oil Marine Transportation Service Market Value Share (%), By Segment 2, 2022 & 2029
Figure 71: Asia Pacific Oil and Crude Oil Marine Transportation Service Market Forecast (USD Billion), by Sub-Segment 1, 2018-2029
Figure 72: Asia Pacific Oil and Crude Oil Marine Transportation Service Market Forecast (USD Billion), by Sub-Segment 2, 2018-2029
Figure 73: Asia Pacific Oil and Crude Oil Marine Transportation Service Market Forecast (USD Billion), by Sub-Segment 3, 2018-2029
Figure 74: Asia Pacific Oil and Crude Oil Marine Transportation Service Market Forecast (USD Billion), by Others, 2018-2029
Figure 75: Asia Pacific Oil and Crude Oil Marine Transportation Service Market Value Share (%), By Segment 3, 2022 & 2029
Figure 76: Asia Pacific Oil and Crude Oil Marine Transportation Service Market Forecast (USD Billion), by Sub-Segment 1, 2018-2029
Figure 77: Asia Pacific Oil and Crude Oil Marine Transportation Service Market Forecast (USD Billion), by Sub-Segment 2, 2018-2029
Figure 78: Asia Pacific Oil and Crude Oil Marine Transportation Service Market Forecast (USD Billion), by Sub-Segment 3, 2018-2029
Figure 79: Asia Pacific Oil and Crude Oil Marine Transportation Service Market Forecast (USD Billion), by Others, 2018-2029
Figure 80: Asia Pacific Oil and Crude Oil Marine Transportation Service Market Forecast (USD Billion), by China, 2018-2029
Figure 81: Asia Pacific Oil and Crude Oil Marine Transportation Service Market Forecast (USD Billion), by India, 2018-2029
Figure 82: Asia Pacific Oil and Crude Oil Marine Transportation Service Market Forecast (USD Billion), by Japan, 2018-2029
Figure 83: Asia Pacific Oil and Crude Oil Marine Transportation Service Market Forecast (USD Billion), by Australia, 2018-2029
Figure 84: Asia Pacific Oil and Crude Oil Marine Transportation Service Market Forecast (USD Billion), by Southeast Asia, 2018-2029
Figure 85: Asia Pacific Oil and Crude Oil Marine Transportation Service Market Forecast (USD Billion), by Rest of Asia Pacific, 2018-2029
Figure 86: Middle East & Africa Oil and Crude Oil Marine Transportation Service Market Value Share (%), By Segment 1, 2022 & 2029
Figure 87: Middle East & Africa Oil and Crude Oil Marine Transportation Service Market Forecast (USD Billion), by Sub-Segment 1, 2018-2029
Figure 88: Middle East & Africa Oil and Crude Oil Marine Transportation Service Market Forecast (USD Billion), by Sub-Segment 2, 2018-2029
Figure 89: Middle East & Africa Oil and Crude Oil Marine Transportation Service Market Value Share (%), By Segment 2, 2022 & 2029
Figure 90: Middle East & Africa Oil and Crude Oil Marine Transportation Service Market Forecast (USD Billion), by Sub-Segment 1, 2018-2029
Figure 91: Middle East & Africa Oil and Crude Oil Marine Transportation Service Market Forecast (USD Billion), by Sub-Segment 2, 2018-2029
Figure 92: Middle East & Africa Oil and Crude Oil Marine Transportation Service Market Forecast (USD Billion), by Sub-Segment 3, 2018-2029
Figure 93: Middle East & Africa Oil and Crude Oil Marine Transportation Service Market Forecast (USD Billion), by Others, 2018-2029
Figure 94: Middle East & Africa Oil and Crude Oil Marine Transportation Service Market Value Share (%), By Segment 3, 2022 & 2029
Figure 95: Middle East & Africa Oil and Crude Oil Marine Transportation Service Market Forecast (USD Billion), by Sub-Segment 1, 2018-2029
Figure 96: Middle East & Africa Oil and Crude Oil Marine Transportation Service Market Forecast (USD Billion), by Sub-Segment 2, 2018-2029
Figure 97: Middle East & Africa Oil and Crude Oil Marine Transportation Service Market Forecast (USD Billion), by Sub-Segment 3, 2018-2029
Figure 98: Middle East & Africa Oil and Crude Oil Marine Transportation Service Market Forecast (USD Billion), by Others, 2018-2029
Figure 99: Middle East & Africa Oil and Crude Oil Marine Transportation Service Market Forecast (USD Billion), by GCC, 2018-2029
Figure 100: Middle East & Africa Oil and Crude Oil Marine Transportation Service Market Forecast (USD Billion), by South Africa, 2018-2029
Figure 101: Middle East & Africa Oil and Crude Oil Marine Transportation Service Market Forecast (USD Billion), by Rest of Middle East & Africa, 2018-2029
List of Tables
Table 1: Global Oil and Crude Oil Marine Transportation Service Market Revenue (USD Billion) Forecast, by Segment 1, 2018-2029
Table 2: Global Oil and Crude Oil Marine Transportation Service Market Revenue (USD Billion) Forecast, by Segment 2, 2018-2029
Table 3: Global Oil and Crude Oil Marine Transportation Service Market Revenue (USD Billion) Forecast, by Segment 3, 2018-2029
Table 4: Global Oil and Crude Oil Marine Transportation Service Market Revenue (USD Billion) Forecast, by Region, 2018-2029
Table 5: North America Oil and Crude Oil Marine Transportation Service Market Revenue (USD Billion) Forecast, by Segment 1, 2018-2029
Table 6: North America Oil and Crude Oil Marine Transportation Service Market Revenue (USD Billion) Forecast, by Segment 2, 2018-2029
Table 7: North America Oil and Crude Oil Marine Transportation Service Market Revenue (USD Billion) Forecast, by Segment 3, 2018-2029
Table 8: North America Oil and Crude Oil Marine Transportation Service Market Revenue (USD Billion) Forecast, by Country, 2018-2029
Table 9: Europe Oil and Crude Oil Marine Transportation Service Market Revenue (USD Billion) Forecast, by Segment 1, 2018-2029
Table 10: Europe Oil and Crude Oil Marine Transportation Service Market Revenue (USD Billion) Forecast, by Segment 2, 2018-2029
Table 11: Europe Oil and Crude Oil Marine Transportation Service Market Revenue (USD Billion) Forecast, by Segment 3, 2018-2029
Table 12: Europe Oil and Crude Oil Marine Transportation Service Market Revenue (USD Billion) Forecast, by Country, 2018-2029
Table 13: Latin America Oil and Crude Oil Marine Transportation Service Market Revenue (USD Billion) Forecast, by Segment 1, 2018-2029
Table 14: Latin America Oil and Crude Oil Marine Transportation Service Market Revenue (USD Billion) Forecast, by Segment 2, 2018-2029
Table 15: Latin America Oil and Crude Oil Marine Transportation Service Market Revenue (USD Billion) Forecast, by Segment 3, 2018-2029
Table 16: Latin America Oil and Crude Oil Marine Transportation Service Market Revenue (USD Billion) Forecast, by Country, 2018-2029
Table 17: Asia Pacific Oil and Crude Oil Marine Transportation Service Market Revenue (USD Billion) Forecast, by Segment 1, 2018-2029
Table 18: Asia Pacific Oil and Crude Oil Marine Transportation Service Market Revenue (USD Billion) Forecast, by Segment 2, 2018-2029
Table 19: Asia Pacific Oil and Crude Oil Marine Transportation Service Market Revenue (USD Billion) Forecast, by Segment 3, 2018-2029
Table 20: Asia Pacific Oil and Crude Oil Marine Transportation Service Market Revenue (USD Billion) Forecast, by Country, 2018-2029
Table 21: Middle East & Africa Oil and Crude Oil Marine Transportation Service Market Revenue (USD Billion) Forecast, by Segment 1, 2018-2029
Table 22: Middle East & Africa Oil and Crude Oil Marine Transportation Service Market Revenue (USD Billion) Forecast, by Segment 2, 2018-2029
Table 23: Middle East & Africa Oil and Crude Oil Marine Transportation Service Market Revenue (USD Billion) Forecast, by Segment 3, 2018-2029
Table 24: Middle East & Africa Oil and Crude Oil Marine Transportation Service Market Revenue (USD Billion) Forecast, by Country, 2018-2029
Research Process
Data Library Research are conducted by industry experts who offer insight on
industry structure, market segmentations technology assessment and competitive landscape (CL), and penetration, as well as on emerging trends. Their analysis is based on primary interviews (~ 80%) and secondary research (~ 20%) as well as years of professional expertise in their respective industries. Adding to this, by analysing historical trends and current market positions, our analysts predict where the market will be headed for the next five years. Furthermore, the varying trends of segment & categories geographically presented are also studied and the estimated based on the primary & secondary research.
In this particular report from the supply side Data Library Research has conducted primary surveys (interviews) with the key level executives (VP, CEO’s, Marketing Director, Business Development Manager
and SOFT) of the companies that active & prominent as well as the midsized organization
FIGURE 1: DLR RESEARH PROCESS
![research-methodology1]()
Primary Research
Extensive primary research was conducted to gain a deeper insight of the market and industry performance. The analysis is based on both primary and secondary research as well as years of professional expertise in the respective industries.
In addition to analysing current and historical trends, our analysts predict where the market is headed over the next five years.
It varies by segment for these categories geographically presented in the list of market tables. Speaking about this particular report we have conducted primary surveys (interviews) with the key level executives (VP, CEO’s, Marketing Director, Business Development Manager and many more) of the major players active in the market.
Secondary Research
Secondary research was mainly used to collect and identify information useful for the extensive, technical, market-oriented, and Friend’s study of the Global Extra Neutral Alcohol. It was also used to obtain key information about major players, market classification and segmentation according to the industry trends, geographical markets, and developments related to the market and technology perspectives. For this study, analysts have gathered information from various credible sources, such as annual reports, sec filings, journals, white papers, SOFT presentations, and company web sites.
Market Size Estimation
Both, top-down and bottom-up approaches were used to estimate and validate the size of the Global market and to estimate the size of various other dependent submarkets in the overall Extra Neutral Alcohol. The key players in the market were identified through secondary research and their market contributions in the respective geographies were determined through primary and secondary research.
Forecast Model
![research-methodology2]()