Organic Peroxide Market Overview and Analysis:
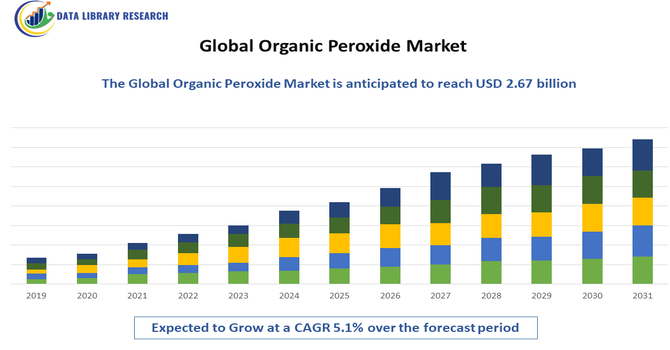
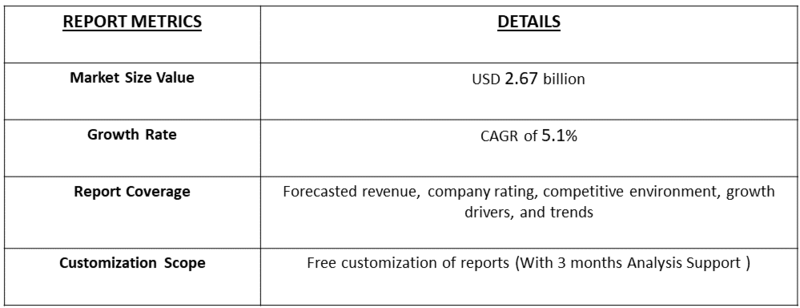
The Organic Peroxide Market is expected to reach a value of USD 2.3 billion in 2032 and is projected to grow to approximately USD 2.67 billion by 2035, growing at a CAGR of 5.1%.
Get Complete Analysis Of The Report - Download Free Sample PDF
The organic peroxide market is a specialized segment of the chemical industry focused on compounds that act as initiators, crosslinking agents, and curing catalysts in polymers, rubbers, and resins. Driven largely by demand from plastics, automotive, construction, packaging, and electronics industries, organic peroxides are essential for improving material strength, heat resistance, and durability. The market is also gaining momentum from sustainability trends, as these compounds enable performance enhancement of recycled plastics, particularly recycled polypropylene, thereby supporting circular economy initiatives and the shift toward eco-friendly materials.
Organic Peroxide Market Latest Trends:
The organic peroxide market is primarily driven by the escalating demand for polymers and plastics, particularly from the booming automotive, construction, and electronics industries. Organic peroxides are crucial as polymerization initiators, cross-linking agents, and curing agents, essential for producing high-performance materials like synthetic rubber and reinforced plastics. Key market trends include a growing emphasis on developing safer, more stable, and bio-based formulations to address the inherent handling and storage risks of these highly reactive compounds, which is crucial for future growth.
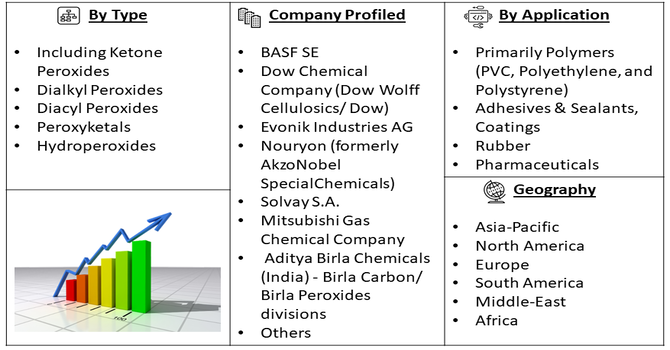
Segmentation: The global organic peroxide market is segmented by Type (Including Ketone Peroxides, Dialkyl Peroxides, Diacyl Peroxides, Peroxyketals, And Hydroperoxides), Application (Primarily Polymers (PVC, Polyethylene, and Polystyrene), Adhesives & Sealants, Coatings, Rubber, And Pharmaceuticals), and Geography (North America, Europe, Asia-Pacific, Middle East and Africa, and South America). The report provides the value (in USD million) for the above segments.
For Detailed Market Segmentation - Get a Free Sample PDF
Market Drivers:
- Surging Demand from the Plastics and Polymer Industry
The increasing demand for specialized, high-performance hoses for data center cooling is a significant new growth avenue for the organic peroxide market. To function reliably in this demanding environment, these hoses require exceptional durability, heat resistance, and long-term stability. Organic peroxides are essential as crosslinking agents, chemically bonding the polymer chains to create a robust, three-dimensional network. This process transforms standard plastics into the highly durable materials needed for data center infrastructure.
Consequently, as the global data center industry continues its rapid expansion, it will drive a corresponding surge in the consumption of organic peroxides to produce these critical components. For instance, in April 2025 DataGuard and FlexCool hoses serve as critical cooling components for data centers, providing reliable and cost-effective performance to optimize operational efficiency. These advanced hoses are vital for ensuring the dependable function of electronic components, as they prevent overheating, hardware damage, and potential data corruption.
- Advancements in Composites Manufacturing
The growth in composite material adoption is a direct result of their superior performance properties, namely their high strength-to-weight ratio, which is critical for enhancing efficiency and durability in demanding applications. In composite manufacturing, organic peroxides serve as critical polymerization initiators for thermoset resins, such as polyester and vinyl ester. This process transforms a liquid resin into a solid, robust, and cross-linked structure that gives the final product its required strength and rigidity. As industries continue to prioritize fuel efficiency in aerospace and automotive design, and seek larger, more resilient blades for wind turbines, the reliance on these specialized composites will continue to expand, ensuring a consistent and escalating demand for organic peroxides.
Market Restraints:
- Environmental and Safety Concerns
The potential environmental and safety risks associated with the handling and use of organic peroxides pose a significant restraint for the market. Organic peroxides are highly reactive and flammable, requiring stringent safety protocols and proper storage and transportation procedures. Increasing regulatory scrutiny and concerns over the impact of organic peroxides on human health and the environment may hinder the market's expansion in some regions.
Social Economic Impact On Organic Peroxide Market
The global organic peroxide market has notable socio-economic impacts, including job creation in chemical manufacturing, formulations, and downstream processing, as well as contributions to regional economic growth through export earnings and enhanced industrial productivity.
Pre-COVID-19, robust demand from polymers, coatings, and adhesives supported steady investments, technology upgrades, and supply-chain diversification, fostering higher employment in specialty chemical sectors and incremental regional capabilities. Post-COVID-19, the market has reinforced resilience through on-site generation, safer handling, and localized production, reducing dependency on long(logistics) and improving safety outcomes, while supply chain diversification and digital process monitoring have driven efficiencies and cost containment. Additionally, stricter safety norms have elevated training and occupational safety standards, benefiting workforce skill development and sustainable industrial growth in both developed and emerging economies.
Segmental Analysis
- Peroxyketals, And Hydroperoxides Segment Product Type Segment is Expected to Witness Significant Growth Over the Forecast Period
The peroxyketals and hydroperoxides segment of the organic peroxide market is projected for significant growth. These compounds are highly valued for their specific decomposition temperatures and reactivity profiles, making them ideal for controlled polymerization processes, particularly in the production of specialized polymers like acrylics and vinyl acetate. Their effectiveness as curing agents in unsaturated polyester resins (UPRs) and vinyl ester resins, used extensively in the automotive, marine, and construction industries, further drives demand. As manufacturers seek tailored solutions for specific polymerization kinetics and resin curing, the unique properties of peroxyketals and hydroperoxides position them as key growth drivers, benefiting from ongoing innovation in polymer formulations and processing technologies.
- Adhesives & Sealants Application Segment is Expected to Witness Significant Growth Over the Forecast Period
The adhesives and sealants application segment is poised for significant expansion within the organic peroxide market. Organic peroxides are critical as curing agents, enabling the rapid and efficient setting of various adhesives and sealants, particularly those based on unsaturated polyester and vinyl ester resins. These resins are increasingly favored for their versatility, strength, and durability in applications ranging from construction and automotive assembly to packaging and electronics. The growing demand for high-performance bonding solutions that offer faster curing times, improved structural integrity, and enhanced chemical resistance directly translates into a higher consumption of organic peroxides. As industries continue to innovate and push the boundaries of material science, the need for effective curing agents like organic peroxides in adhesives and sealants will only intensify.
- Asia Pacific Region is Expected to Witness Significant Growth Over the Forecast Period
The Asia Pacific region is a powerhouse of growth for the global organic peroxide market. This surge is underpinned by rapid industrialization, expanding manufacturing capabilities, and a burgeoning middle class across countries like China, India, and Southeast Asian nations. The escalating demand for plastics, rubber, coatings, and adhesives in sectors such as automotive, construction, electronics, and packaging directly fuels the consumption of organic peroxides as essential processing aids and curing agents.
Furthermore, significant investments in infrastructure development and a growing focus on technological advancements are creating new avenues for specialized organic peroxide applications. For instance, In July 2022, United Initiators inaugurated a new facility in Huaibei, China, with an annual capacity of 25 ktons for TBHP-TBA production. This project marks the company's debut in the downstream organic peroxides market, strategically bolstering its product portfolio and expanding its global footprint. The region's vast population, coupled with increasing disposable incomes, continues to drive consumer goods production, further solidifying Asia Pacific's position as a key growth engine for the market.
To Learn More About This Report - Request a Free Sample Copy
Organic Peroxide Market Competitive Landscape:
The global organic peroxide market is moderately consolidated, with key players such as Akzo Nobel N.V., Arkema, United Initiators, NOF Corporation, and Pergan GmbH holding significant market shares. These companies compete on the basis of product quality, innovation, and global reach, while regional manufacturers in Asia-Pacific are strengthening their presence through cost-competitive offerings and localized supply chains. The market is driven by strong demand from plastics, rubber, coatings, and polymer industries, where organic peroxides are used as catalysts, initiators, and curing agents. Rising environmental and safety regulations are shaping competition, encouraging companies to invest in safer formulations, advanced production technologies, and sustainable manufacturing practices to maintain their edge.
Here are 10 major players in the global organic peroxide market:
- BASF SE
- Dow Chemical Company (Dow Wolff Cellulosics/ Dow)
- Evonik Industries AG
- Nouryon (formerly AkzoNobel SpecialChemicals)
- Solvay S.A.
- Mitsubishi Gas Chemical Company
- Aditya Birla Chemicals (India) - Birla Carbon/ Birla Peroxides divisions
- Arkema S.A.
- LG Chem (Lotte Chemical/ LG야)
- Wacker Chemie AG
Recent Developments:
- In November 2024, Nouryon has completed a major capacity expansion at its Ningbo, China facility, doubling production to 6,000 tons each of its flagship organic peroxide products, Perkadox® 14 and Trigonox® 101. These peroxides, critical for polymer modification and rubber/thermoplastic crosslinking, are increasingly vital as the plastics industry shifts toward sustainability. By enhancing the performance of recycled polypropylene (R-PP) to levels comparable with virgin plastics, the expansion not only strengthens Nouryon’s position in the global organic peroxide market but also supports growing demand from packaging, automotive, and construction sectors seeking advanced solutions for circular economy applications.
- In September 2025, Arkema’s showcased at K2025 reinforces its leadership in sustainable specialty materials, which is expected to drive greater demand for organic peroxides as essential initiators and crosslinking agents in advanced polymers. This development strengthens the role of organic peroxides in renewable energy and electric mobility applications, expanding their relevance in high-growth, future-oriented industries. ****
Frequently Asked Questions (FAQ) :
Q1. What the main growth driving factors for this market?
The global organic peroxide market growth is driven by increasing demand from pulp and paper, textile, and wastewater treatment industries. Its strong oxidizing and eco-friendly properties make it ideal for bleaching and disinfection. Rising industrialization and environmental regulations further support market expansion
Q2. What are the main restraining factors for this market?
The regulatory complexity and safety concerns; volatility in feedstock prices; high capital expenditure; storage hazards; and competition from alternative oxidants with lower cost or simpler logistics.
Q3. Which segment is expected to witness high growth?
The hydrogen peroxide segment is expected to witness high growth, driven by its versatile applications across various industries and its relatively greener profile compared to some alternatives. Growth in specialty grades for advanced applications also contributes significantly.
Q4. Who are the top major players for this market?
Major players in the Global Peroxide market include Solvay S.A., Evonik Industries AG, Arkema S.A., Mitsubishi Gas Chemical Company, Inc., and Nouryon B.V. These companies dominate production and innovation.
Q5. Which country is the largest player?
China is the largest player in the Global Organic Peroxide market, both in terms of production volume and consumption. Its extensive manufacturing base and significant demand from various end-user industries contribute to its leading position.
List of Figures
Figure 1: Global Organic Peroxide Market Revenue Breakdown (USD Billion, %) by Region, 2023 & 2030
Figure 2: Global Organic Peroxide Market Value Share (%), By Segment 1, 2023 & 2030
Figure 3: Global Organic Peroxide Market Forecast (USD Billion), by Sub-Segment 1, 2018-2030
Figure 4: Global Organic Peroxide Market Forecast (USD Billion), by Sub-Segment 2, 2018-2030
Figure 5: Global Organic Peroxide Market Value Share (%), By Segment 2, 2023 & 2030
Figure 6: Global Organic Peroxide Market Forecast (USD Billion), by Sub-Segment 1, 2018-2030
Figure 7: Global Organic Peroxide Market Forecast (USD Billion), by Sub-Segment 2, 2018-2030
Figure 8: Global Organic Peroxide Market Forecast (USD Billion), by Sub-Segment 3, 2018-2030
Figure 9: Global Organic Peroxide Market Forecast (USD Billion), by Others, 2018-2030
Figure 10: Global Organic Peroxide Market Value Share (%), By Segment 3, 2023 & 2030
Figure 11: Global Organic Peroxide Market Forecast (USD Billion), by Sub-Segment 1, 2018-2030
Figure 12: Global Organic Peroxide Market Forecast (USD Billion), by Sub-Segment 2, 2018-2030
Figure 13: Global Organic Peroxide Market Forecast (USD Billion), by Sub-Segment 3, 2018-2030
Figure 14: Global Organic Peroxide Market Forecast (USD Billion), by Others, 2018-2030
Figure 15: Global Organic Peroxide Market Value (USD Billion), by Region, 2023 & 2030
Figure 16: North America Organic Peroxide Market Value Share (%), By Segment 1, 2023 & 2030
Figure 17: North America Organic Peroxide Market Forecast (USD Billion), by Sub-Segment 1, 2018-2030
Figure 18: North America Organic Peroxide Market Forecast (USD Billion), by Sub-Segment 2, 2018-2030
Figure 19: North America Organic Peroxide Market Value Share (%), By Segment 2, 2023 & 2030
Figure 20: North America Organic Peroxide Market Forecast (USD Billion), by Sub-Segment 1, 2018-2030
Figure 21: North America Organic Peroxide Market Forecast (USD Billion), by Sub-Segment 2, 2018-2030
Figure 22: North America Organic Peroxide Market Forecast (USD Billion), by Sub-Segment 3, 2018-2030
Figure 23: North America Organic Peroxide Market Forecast (USD Billion), by Others, 2018-2030
Figure 24: North America Organic Peroxide Market Value Share (%), By Segment 3, 2023 & 2030
Figure 25: North America Organic Peroxide Market Forecast (USD Billion), by Sub-Segment 1, 2018-2030
Figure 26: North America Organic Peroxide Market Forecast (USD Billion), by Sub-Segment 2, 2018-2030
Figure 27: North America Organic Peroxide Market Forecast (USD Billion), by Sub-Segment 3, 2018-2030
Figure 28: North America Organic Peroxide Market Forecast (USD Billion), by Others, 2018-2030
Figure 29: North America Organic Peroxide Market Forecast (USD Billion), by U.S., 2018-2030
Figure 30: North America Organic Peroxide Market Forecast (USD Billion), by Canada, 2018-2030
Figure 31: Latin America Organic Peroxide Market Value Share (%), By Segment 1, 2023 & 2030
Figure 32: Latin America Organic Peroxide Market Forecast (USD Billion), by Sub-Segment 1, 2018-2030
Figure 33: Latin America Organic Peroxide Market Forecast (USD Billion), by Sub-Segment 2, 2018-2030
Figure 34: Latin America Organic Peroxide Market Value Share (%), By Segment 2, 2023 & 2030
Figure 35: Latin America Organic Peroxide Market Forecast (USD Billion), by Sub-Segment 1, 2018-2030
Figure 36: Latin America Organic Peroxide Market Forecast (USD Billion), by Sub-Segment 2, 2018-2030
Figure 37: Latin America Organic Peroxide Market Forecast (USD Billion), by Sub-Segment 3, 2018-2030
Figure 38: Latin America Organic Peroxide Market Forecast (USD Billion), by Others, 2018-2030
Figure 39: Latin America Organic Peroxide Market Value Share (%), By Segment 3, 2023 & 2030
Figure 40: Latin America Organic Peroxide Market Forecast (USD Billion), by Sub-Segment 1, 2018-2030
Figure 41: Latin America Organic Peroxide Market Forecast (USD Billion), by Sub-Segment 2, 2018-2030
Figure 42: Latin America Organic Peroxide Market Forecast (USD Billion), by Sub-Segment 3, 2018-2030
Figure 43: Latin America Organic Peroxide Market Forecast (USD Billion), by Others, 2018-2030
Figure 44: Latin America Organic Peroxide Market Forecast (USD Billion), by Brazil, 2018-2030
Figure 45: Latin America Organic Peroxide Market Forecast (USD Billion), by Mexico, 2018-2030
Figure 46: Latin America Organic Peroxide Market Forecast (USD Billion), by Rest of Latin America, 2018-2030
Figure 47: Europe Organic Peroxide Market Value Share (%), By Segment 1, 2023 & 2030
Figure 48: Europe Organic Peroxide Market Forecast (USD Billion), by Sub-Segment 1, 2018-2030
Figure 49: Europe Organic Peroxide Market Forecast (USD Billion), by Sub-Segment 2, 2018-2030
Figure 50: Europe Organic Peroxide Market Value Share (%), By Segment 2, 2023 & 2030
Figure 51: Europe Organic Peroxide Market Forecast (USD Billion), by Sub-Segment 1, 2018-2030
Figure 52: Europe Organic Peroxide Market Forecast (USD Billion), by Sub-Segment 2, 2018-2030
Figure 53: Europe Organic Peroxide Market Forecast (USD Billion), by Sub-Segment 3, 2018-2030
Figure 54: Europe Organic Peroxide Market Forecast (USD Billion), by Others, 2018-2030
Figure 55: Europe Organic Peroxide Market Value Share (%), By Segment 3, 2023 & 2030
Figure 56: Europe Organic Peroxide Market Forecast (USD Billion), by Sub-Segment 1, 2018-2030
Figure 57: Europe Organic Peroxide Market Forecast (USD Billion), by Sub-Segment 2, 2018-2030
Figure 58: Europe Organic Peroxide Market Forecast (USD Billion), by Sub-Segment 3, 2018-2030
Figure 59: Europe Organic Peroxide Market Forecast (USD Billion), by Others, 2018-2030
Figure 60: Europe Organic Peroxide Market Forecast (USD Billion), by U.K., 2018-2030
Figure 61: Europe Organic Peroxide Market Forecast (USD Billion), by Germany, 2018-2030
Figure 62: Europe Organic Peroxide Market Forecast (USD Billion), by France, 2018-2030
Figure 63: Europe Organic Peroxide Market Forecast (USD Billion), by Italy, 2018-2030
Figure 64: Europe Organic Peroxide Market Forecast (USD Billion), by Spain, 2018-2030
Figure 65: Europe Organic Peroxide Market Forecast (USD Billion), by Russia, 2018-2030
Figure 66: Europe Organic Peroxide Market Forecast (USD Billion), by Rest of Europe, 2018-2030
Figure 67: Asia Pacific Organic Peroxide Market Value Share (%), By Segment 1, 2023 & 2030
Figure 68: Asia Pacific Organic Peroxide Market Forecast (USD Billion), by Sub-Segment 1, 2018-2030
Figure 69: Asia Pacific Organic Peroxide Market Forecast (USD Billion), by Sub-Segment 2, 2018-2030
Figure 70: Asia Pacific Organic Peroxide Market Value Share (%), By Segment 2, 2023 & 2030
Figure 71: Asia Pacific Organic Peroxide Market Forecast (USD Billion), by Sub-Segment 1, 2018-2030
Figure 72: Asia Pacific Organic Peroxide Market Forecast (USD Billion), by Sub-Segment 2, 2018-2030
Figure 73: Asia Pacific Organic Peroxide Market Forecast (USD Billion), by Sub-Segment 3, 2018-2030
Figure 74: Asia Pacific Organic Peroxide Market Forecast (USD Billion), by Others, 2018-2030
Figure 75: Asia Pacific Organic Peroxide Market Value Share (%), By Segment 3, 2023 & 2030
Figure 76: Asia Pacific Organic Peroxide Market Forecast (USD Billion), by Sub-Segment 1, 2018-2030
Figure 77: Asia Pacific Organic Peroxide Market Forecast (USD Billion), by Sub-Segment 2, 2018-2030
Figure 78: Asia Pacific Organic Peroxide Market Forecast (USD Billion), by Sub-Segment 3, 2018-2030
Figure 79: Asia Pacific Organic Peroxide Market Forecast (USD Billion), by Others, 2018-2030
Figure 80: Asia Pacific Organic Peroxide Market Forecast (USD Billion), by China, 2018-2030
Figure 81: Asia Pacific Organic Peroxide Market Forecast (USD Billion), by India, 2018-2030
Figure 82: Asia Pacific Organic Peroxide Market Forecast (USD Billion), by Japan, 2018-2030
Figure 83: Asia Pacific Organic Peroxide Market Forecast (USD Billion), by Australia, 2018-2030
Figure 84: Asia Pacific Organic Peroxide Market Forecast (USD Billion), by Southeast Asia, 2018-2030
Figure 85: Asia Pacific Organic Peroxide Market Forecast (USD Billion), by Rest of Asia Pacific, 2018-2030
Figure 86: Middle East & Africa Organic Peroxide Market Value Share (%), By Segment 1, 2023 & 2030
Figure 87: Middle East & Africa Organic Peroxide Market Forecast (USD Billion), by Sub-Segment 1, 2018-2030
Figure 88: Middle East & Africa Organic Peroxide Market Forecast (USD Billion), by Sub-Segment 2, 2018-2030
Figure 89: Middle East & Africa Organic Peroxide Market Value Share (%), By Segment 2, 2023 & 2030
Figure 90: Middle East & Africa Organic Peroxide Market Forecast (USD Billion), by Sub-Segment 1, 2018-2030
Figure 91: Middle East & Africa Organic Peroxide Market Forecast (USD Billion), by Sub-Segment 2, 2018-2030
Figure 92: Middle East & Africa Organic Peroxide Market Forecast (USD Billion), by Sub-Segment 3, 2018-2030
Figure 93: Middle East & Africa Organic Peroxide Market Forecast (USD Billion), by Others, 2018-2030
Figure 94: Middle East & Africa Organic Peroxide Market Value Share (%), By Segment 3, 2023 & 2030
Figure 95: Middle East & Africa Organic Peroxide Market Forecast (USD Billion), by Sub-Segment 1, 2018-2030
Figure 96: Middle East & Africa Organic Peroxide Market Forecast (USD Billion), by Sub-Segment 2, 2018-2030
Figure 97: Middle East & Africa Organic Peroxide Market Forecast (USD Billion), by Sub-Segment 3, 2018-2030
Figure 98: Middle East & Africa Organic Peroxide Market Forecast (USD Billion), by Others, 2018-2030
Figure 99: Middle East & Africa Organic Peroxide Market Forecast (USD Billion), by GCC, 2018-2030
Figure 100: Middle East & Africa Organic Peroxide Market Forecast (USD Billion), by South Africa, 2018-2030
Figure 101: Middle East & Africa Organic Peroxide Market Forecast (USD Billion), by Rest of Middle East & Africa, 2018-2030
List of Tables
Table 1: Global Organic Peroxide Market Revenue (USD Billion) Forecast, by Segment 1, 2018-2030
Table 2: Global Organic Peroxide Market Revenue (USD Billion) Forecast, by Segment 2, 2018-2030
Table 3: Global Organic Peroxide Market Revenue (USD Billion) Forecast, by Segment 3, 2018-2030
Table 4: Global Organic Peroxide Market Revenue (USD Billion) Forecast, by Region, 2018-2030
Table 5: North America Organic Peroxide Market Revenue (USD Billion) Forecast, by Segment 1, 2018-2030
Table 6: North America Organic Peroxide Market Revenue (USD Billion) Forecast, by Segment 2, 2018-2030
Table 7: North America Organic Peroxide Market Revenue (USD Billion) Forecast, by Segment 3, 2018-2030
Table 8: North America Organic Peroxide Market Revenue (USD Billion) Forecast, by Country, 2018-2030
Table 9: Europe Organic Peroxide Market Revenue (USD Billion) Forecast, by Segment 1, 2018-2030
Table 10: Europe Organic Peroxide Market Revenue (USD Billion) Forecast, by Segment 2, 2018-2030
Table 11: Europe Organic Peroxide Market Revenue (USD Billion) Forecast, by Segment 3, 2018-2030
Table 12: Europe Organic Peroxide Market Revenue (USD Billion) Forecast, by Country, 2018-2030
Table 13: Latin America Organic Peroxide Market Revenue (USD Billion) Forecast, by Segment 1, 2018-2030
Table 14: Latin America Organic Peroxide Market Revenue (USD Billion) Forecast, by Segment 2, 2018-2030
Table 15: Latin America Organic Peroxide Market Revenue (USD Billion) Forecast, by Segment 3, 2018-2030
Table 16: Latin America Organic Peroxide Market Revenue (USD Billion) Forecast, by Country, 2018-2030
Table 17: Asia Pacific Organic Peroxide Market Revenue (USD Billion) Forecast, by Segment 1, 2018-2030
Table 18: Asia Pacific Organic Peroxide Market Revenue (USD Billion) Forecast, by Segment 2, 2018-2030
Table 19: Asia Pacific Organic Peroxide Market Revenue (USD Billion) Forecast, by Segment 3, 2018-2030
Table 20: Asia Pacific Organic Peroxide Market Revenue (USD Billion) Forecast, by Country, 2018-2030
Table 21: Middle East & Africa Organic Peroxide Market Revenue (USD Billion) Forecast, by Segment 1, 2018-2030
Table 22: Middle East & Africa Organic Peroxide Market Revenue (USD Billion) Forecast, by Segment 2, 2018-2030
Table 23: Middle East & Africa Organic Peroxide Market Revenue (USD Billion) Forecast, by Segment 3, 2018-2030
Table 24: Middle East & Africa Organic Peroxide Market Revenue (USD Billion) Forecast, by Country, 2018-2030
Research Process
Data Library Research are conducted by industry experts who offer insight on
industry structure, market segmentations technology assessment and competitive landscape (CL), and penetration, as well as on emerging trends. Their analysis is based on primary interviews (~ 80%) and secondary research (~ 20%) as well as years of professional expertise in their respective industries. Adding to this, by analysing historical trends and current market positions, our analysts predict where the market will be headed for the next five years. Furthermore, the varying trends of segment & categories geographically presented are also studied and the estimated based on the primary & secondary research.
In this particular report from the supply side Data Library Research has conducted primary surveys (interviews) with the key level executives (VP, CEO’s, Marketing Director, Business Development Manager
and SOFT) of the companies that active & prominent as well as the midsized organization
FIGURE 1: DLR RESEARH PROCESS
![research-methodology1]()
Primary Research
Extensive primary research was conducted to gain a deeper insight of the market and industry performance. The analysis is based on both primary and secondary research as well as years of professional expertise in the respective industries.
In addition to analysing current and historical trends, our analysts predict where the market is headed over the next five years.
It varies by segment for these categories geographically presented in the list of market tables. Speaking about this particular report we have conducted primary surveys (interviews) with the key level executives (VP, CEO’s, Marketing Director, Business Development Manager and many more) of the major players active in the market.
Secondary Research
Secondary research was mainly used to collect and identify information useful for the extensive, technical, market-oriented, and Friend’s study of the Global Extra Neutral Alcohol. It was also used to obtain key information about major players, market classification and segmentation according to the industry trends, geographical markets, and developments related to the market and technology perspectives. For this study, analysts have gathered information from various credible sources, such as annual reports, sec filings, journals, white papers, SOFT presentations, and company web sites.
Market Size Estimation
Both, top-down and bottom-up approaches were used to estimate and validate the size of the Global market and to estimate the size of various other dependent submarkets in the overall Extra Neutral Alcohol. The key players in the market were identified through secondary research and their market contributions in the respective geographies were determined through primary and secondary research.
Forecast Model
![research-methodology2]()