Orthopedic Regenerative Surgical Market Overview and Analysis
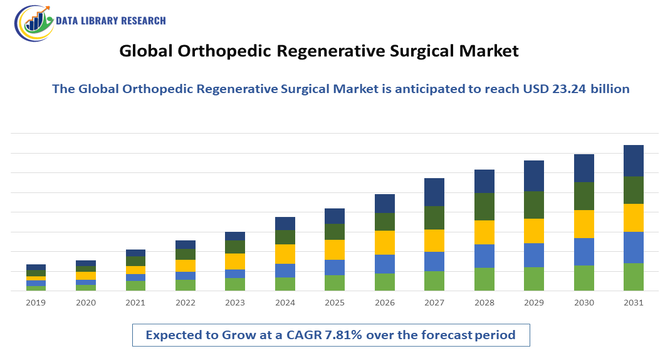
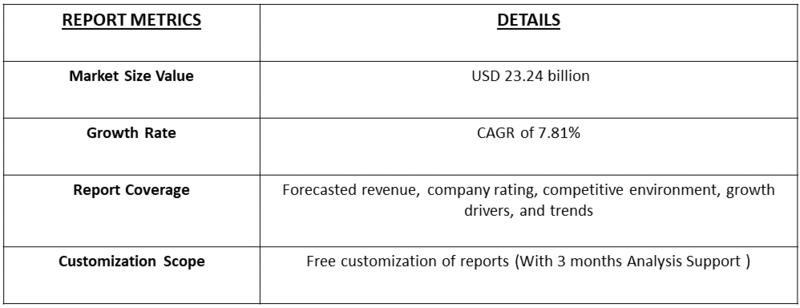
- The Orthopedic Regenerative Surgical Market, valued at 14.8 billion in 2025, is anticipated to advance at a CAGR of 7.81% during 2026–2033, reaching 23.24 billion by 2033 as adoption grows across industrial, commercial, and technological segments.
Get Complete Analysis Of The Report - Download Updated Free Sample PDF
The Global Orthopedic Regenerative Surgical Market refers to the industry focused on advanced surgical treatments that repair or regenerate damaged bones, cartilage, and joints. It includes technologies like stem cell therapy, tissue engineering, and biomaterials, aiming to restore mobility, reduce pain, and improve outcomes for patients with orthopedic conditions worldwide.
The growth in the Orthopedic Regenerative Surgical Market is driven by rising musculoskeletal disorders, aging populations, advancements in biomaterials, increasing demand for minimally invasive procedures, and expanding use of stem cell and tissue-engineering technologies.
Orthopedic Regenerative Surgical Market Latest Trends
The Global Orthopedic Regenerative Surgical Market is experiencing notable shifts driven by advancements in biologics, tissue engineering, and minimally invasive procedures. Demand for stem cell therapies, growth factors, and biomimetic scaffolds continues to rise as clinicians seek alternatives that promote natural healing. Integration of robotics, 3D printing, and AI-guided surgical planning is improving precision and patient outcomes. Single-use biologic implants and off-the-shelf regenerative products are gaining popularity due to reduced surgical time and lower infection risks.
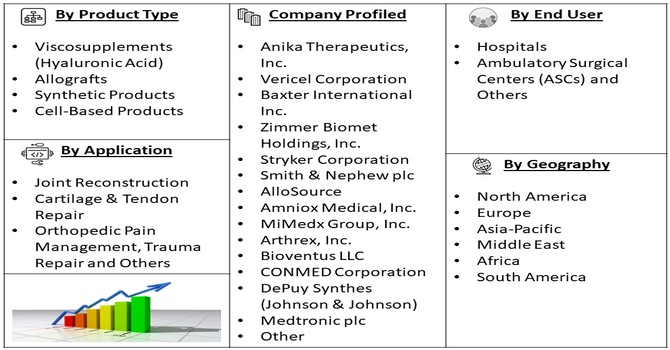
Segmentation: The Global Orthopedic Regenerative Surgical Products Market is segmented by Product (Viscosupplements (Hyaluronic Acid), Allografts, Synthetic Products, and Cell-Based Products), Application (Joint Reconstruction, Cartilage & Tendon Repair, Orthopedic Pain Management, Trauma Repair and Others), End-User (Hospitals, Ambulatory Surgical Centers (ASCs) and Others), and Geography (North America, Europe, Asia-Pacific, Middle East and Africa, and South America). The report provides the value (in USD million) for the above segments.
For Detailed Market Segmentation - Get a Free Sample PDF
Market Drivers:
- Rising Prevalence of Musculoskeletal Disorders
The growing prevalence of musculoskeletal disorders, including osteoarthritis, rheumatoid arthritis, and sports-related injuries, is a key driver of the Global Orthopedic Regenerative Surgical Market. Aging populations worldwide face higher incidences of joint degeneration, increasing demand for advanced surgical interventions. Patients increasingly prefer regenerative solutions that restore tissue function, reduce pain, and improve mobility over conventional treatments. The rising awareness of early intervention and preventive orthopedic care further stimulates demand for biologics, stem cell therapies, and tissue-engineered grafts.
- Advancements in Regenerative Technologies
Technological innovations in orthopedic regenerative surgery are fueling market expansion. Breakthroughs in stem cell therapies, platelet-rich plasma (PRP), 3D-printed scaffolds, and growth factor-enhanced implants have improved treatment efficacy and recovery times. Minimally invasive techniques combined with robotics and AI-guided surgical planning enhance procedural precision, reducing complications and hospitalization. Enhanced biomaterials and standardized regenerative protocols increase clinician confidence and patient adoption. Furthermore, ongoing research in hybrid biologic-synthetic implants broadens applications across joint reconstruction and tissue repair.
Market Restraints:
The high cost of orthopedic regenerative surgical procedures remains a significant restraint for market growth. Advanced biologics, stem cell therapies, and personalized implants require substantial investment in research, manufacturing, and clinical application. Many patients, particularly in developing regions, cannot afford these high-cost treatments, limiting accessibility. Additionally, reimbursement policies for regenerative procedures vary widely across countries, and limited insurance coverage further restricts adoption. Hospitals and clinics also face financial constraints in acquiring expensive surgical technologies, robotics, and biologic implants.
Socioeconomic Impact on Orthopedic Regenerative Surgical Market
The socioeconomic impact of the Global Orthopedic Regenerative Surgical Market is substantial, creating new opportunities in biotechnology, medical manufacturing, and specialized clinical services. Regenerative therapies help reduce long-term disability, enabling patients to return to work sooner and lowering the economic burden of chronic musculoskeletal conditions. Healthcare systems benefit from fewer revision surgeries and shorter hospital stays, improving cost efficiency. Expanding access to advanced regenerative treatments also enhances quality of life, particularly for aging populations. Additionally, rising investment in R&D stimulates job creation, global collaboration, and medical innovation, strengthening the broader healthcare economy while addressing growing orthopedic care demands.
Segmental Analysis:
- Viscosupplements (Hyaluronic Acid) segment is expected to witness the highest growth over the forecast period
The Viscosupplements (Hyaluronic Acid) segment is expected to witness the highest growth over the forecast period due to the rising prevalence of osteoarthritis and increasing preference for non-surgical treatment alternatives. Hyaluronic acid injections help restore joint lubrication, reduce pain, and improve mobility, making them an attractive option for patients seeking conservative care. Growing awareness of early intervention therapies and expanding adoption among younger, active individuals further support market expansion. Technological advancements enabling longer-lasting formulations and multi-injection to single-injection conversions also contribute to demand. Additionally, supportive reimbursement policies in several countries and widening use of viscosupplements in outpatient settings strengthen the segment’s growth trajectory across global orthopedic care markets.
- Joint Reconstruction segment is expected to witness the highest growth over the forecast period
The Joint Reconstruction segment is expected to witness the highest growth over the forecast period, driven by increasing rates of joint degeneration from aging populations, sports injuries, and lifestyle-related conditions. Rising demand for knee, hip, and shoulder reconstruction procedures significantly boosts adoption of advanced implants and regenerative solutions. Technological innovations—including 3D-printed implants, robotics-assisted surgery, and biologically enhanced reconstruction materials—enhance procedural outcomes and reduce recovery times, encouraging broader utilization. Growing acceptance of minimally invasive techniques further attracts both patients and surgeons. Moreover, expanding healthcare infrastructure, improved postoperative rehabilitation protocols, and rising insurance coverage for reconstructive surgeries contribute to strong segmental growth globally.
- Hospitals segment is expected to witness the highest growth over the forecast period
The Hospitals segment is expected to witness the highest growth over the forecast period as these facilities remain primary centers for complex orthopedic and regenerative procedures. Hospitals offer advanced surgical infrastructure, skilled orthopedic specialists, and access to cutting-edge technologies, making them preferred sites for joint reconstruction, biologic therapies, and postoperative rehabilitation. Increasing hospital investments in robotics, imaging, and regenerative medicine platforms enhance procedural accuracy and clinical outcomes, driving patient volume. Higher reimbursement rates for hospital-based surgeries and greater availability of multidisciplinary care teams also support segment growth. Additionally, the rising incidence of trauma, sports injuries, and age-related degenerative conditions fuels demand for hospital-based orthopedic interventions.
- North America region is expected to witness the highest growth over the forecast period
The North America region is expected to witness the highest growth over the forecast period due to its strong healthcare infrastructure, early adoption of advanced orthopedic regenerative technologies, and high prevalence of musculoskeletal disorders. Growing demand for minimally invasive treatments, biologics, and innovative graft materials further accelerates market expansion.
Favorable reimbursement systems and substantial investments by medical device companies in research and development strengthen the region’s leadership. For instance, in May 2025, the Keck School of Medicine of USC launched the Parris Longevity Accelerator with a USD 10 million gift, advancing research in stem cells, aging biomarkers, and early interventions, positively influencing the Global Orthopedic Regenerative Surgical Market by fostering innovation and regenerative therapy development.
Increasing awareness of preventive orthopedic care and the strong presence of leading manufacturers support faster commercialization of new regenerative solutions. Moreover, rising participation in sports and an aging population continue to drive the need for effective orthopedic treatment options across the United States and Canada.
To Learn More About This Report - Request a Free Sample Copy
Orthopedic Regenerative Surgical Market Competitive Landscape
The competitive landscape of the Global Orthopedic Regenerative Surgical Market is shaped by established medical device companies, emerging biotech startups, and research-driven innovators. Leading players compete through product differentiation in biologics, synthetic grafts, and advanced implant technologies. As regulatory pathways evolve and demand for regenerative solutions increases, competition intensifies around innovation, cost efficiency, and surgeon-focused product portfolios.
The major players for this market are:
- Anika Therapeutics, Inc.
- Vericel Corporation
- Baxter International Inc.
- Zimmer Biomet Holdings, Inc.
- Stryker Corporation
- Smith & Nephew plc
- AlloSource
- Amniox Medical, Inc.
- MiMedx Group, Inc.
- Arthrex, Inc.
- Bioventus LLC
- CONMED Corporation
- DePuy Synthes (Johnson & Johnson)
- Medtronic plc
- NuVasive, Inc.
- Orthofix Medical Inc.
- Osiris Therapeutics, Inc.
- RTI Surgical Inc.
- Terumo BCT Inc.
- Xtant Medical Holdings, Inc.
Recent Development
- In December 2025, Xtant Medical Holdings, Inc., announced the commercial launch of Strata, its next-generation synthetic bone graft in the nanOss product line. The company introduced the advanced graft to enhance surgical options for spinal and orthopedic procedures, expanding its portfolio and strengthening its position in the medical technology market.
- In November 2025, Advita Ortho, LLC announced its official launch as a global medical device company focused on improving patients’ lives through advanced orthopedic solutions. It aimed to support surgeons with high-quality implants and integrated surgical technologies enhanced by data, artificial intelligence, and machine learning, strengthening innovation and patient outcomes in the orthopedic field.
Frequently Asked Questions (FAQ) :
Q1. What are the main growth-driving factors for this market?
The market growth is primarily fueled by the rapidly aging global population, as older people frequently suffer from musculoskeletal disorders like severe arthritis. Combined with a rising number of sports-related injuries and continuous technological progress in regenerative therapies, such as advanced biomaterials and cell-based treatments, demand for these surgical solutions is high.
Q2. What are the main restraining factors for this market?
The main hurdles for this market are the high costs associated with regenerative treatments, making them inaccessible for many patients, especially in developing economies. Additionally, the regulatory pathway for approving new orthopedic regenerative products is often long, complex, and strict. This lengthy process delays the introduction of innovative solutions to the market.
Q3. Which segment is expected to witness high growth?
The Viscosupplements product segment, which includes hyaluronic acid injections for joint pain, is expected to maintain market dominance. However, in terms of application, the Cartilage and Tendon Repair segment shows high growth due to increased sports injuries. Geographically, the Asia Pacific region is anticipated to be the fastest-growing market due to improving healthcare infrastructure.
Q4. Who are the top major players for this market?
The market includes several prominent medical technology companies specializing in orthopedic solutions. Some of the top players are Zimmer Biomet, Stryker, Smith & Nephew, Anika Therapeutics Inc., and Baxter. These companies focus on developing, manufacturing, and distributing advanced surgical products like allografts and cell-based therapies globally.
Q5. Which country is the largest player?
North America holds the largest revenue share in the global market. This dominance is mainly driven by the advanced healthcare infrastructure, high consumer awareness, and significant investment in research and development, particularly in the United States and Canada. The high incidence of orthopedic diseases in the region further solidifies its leading position.
List of Figures
Figure 1: Global Orthopedic Regenerative Surgical Market Revenue Breakdown (USD Billion, %) by Region, 2022 & 2029
Figure 2: Global Orthopedic Regenerative Surgical Market Value Share (%), By Segment 1, 2022 & 2029
Figure 3: Global Orthopedic Regenerative Surgical Market Forecast (USD Billion), by Sub-Segment 1, 2018-2029
Figure 4: Global Orthopedic Regenerative Surgical Market Forecast (USD Billion), by Sub-Segment 2, 2018-2029
Figure 5: Global Orthopedic Regenerative Surgical Market Value Share (%), By Segment 2, 2022 & 2029
Figure 6: Global Orthopedic Regenerative Surgical Market Forecast (USD Billion), by Sub-Segment 1, 2018-2029
Figure 7: Global Orthopedic Regenerative Surgical Market Forecast (USD Billion), by Sub-Segment 2, 2018-2029
Figure 8: Global Orthopedic Regenerative Surgical Market Forecast (USD Billion), by Sub-Segment 3, 2018-2029
Figure 9: Global Orthopedic Regenerative Surgical Market Forecast (USD Billion), by Others, 2018-2029
Figure 10: Global Orthopedic Regenerative Surgical Market Value Share (%), By Segment 3, 2022 & 2029
Figure 11: Global Orthopedic Regenerative Surgical Market Forecast (USD Billion), by Sub-Segment 1, 2018-2029
Figure 12: Global Orthopedic Regenerative Surgical Market Forecast (USD Billion), by Sub-Segment 2, 2018-2029
Figure 13: Global Orthopedic Regenerative Surgical Market Forecast (USD Billion), by Sub-Segment 3, 2018-2029
Figure 14: Global Orthopedic Regenerative Surgical Market Forecast (USD Billion), by Others, 2018-2029
Figure 15: Global Orthopedic Regenerative Surgical Market Value (USD Billion), by Region, 2022 & 2029
Figure 16: North America Orthopedic Regenerative Surgical Market Value Share (%), By Segment 1, 2022 & 2029
Figure 17: North America Orthopedic Regenerative Surgical Market Forecast (USD Billion), by Sub-Segment 1, 2018-2029
Figure 18: North America Orthopedic Regenerative Surgical Market Forecast (USD Billion), by Sub-Segment 2, 2018-2029
Figure 19: North America Orthopedic Regenerative Surgical Market Value Share (%), By Segment 2, 2022 & 2029
Figure 20: North America Orthopedic Regenerative Surgical Market Forecast (USD Billion), by Sub-Segment 1, 2018-2029
Figure 21: North America Orthopedic Regenerative Surgical Market Forecast (USD Billion), by Sub-Segment 2, 2018-2029
Figure 22: North America Orthopedic Regenerative Surgical Market Forecast (USD Billion), by Sub-Segment 3, 2018-2029
Figure 23: North America Orthopedic Regenerative Surgical Market Forecast (USD Billion), by Others, 2018-2029
Figure 24: North America Orthopedic Regenerative Surgical Market Value Share (%), By Segment 3, 2022 & 2029
Figure 25: North America Orthopedic Regenerative Surgical Market Forecast (USD Billion), by Sub-Segment 1, 2018-2029
Figure 26: North America Orthopedic Regenerative Surgical Market Forecast (USD Billion), by Sub-Segment 2, 2018-2029
Figure 27: North America Orthopedic Regenerative Surgical Market Forecast (USD Billion), by Sub-Segment 3, 2018-2029
Figure 28: North America Orthopedic Regenerative Surgical Market Forecast (USD Billion), by Others, 2018-2029
Figure 29: North America Orthopedic Regenerative Surgical Market Forecast (USD Billion), by U.S., 2018-2029
Figure 30: North America Orthopedic Regenerative Surgical Market Forecast (USD Billion), by Canada, 2018-2029
Figure 31: Latin America Orthopedic Regenerative Surgical Market Value Share (%), By Segment 1, 2022 & 2029
Figure 32: Latin America Orthopedic Regenerative Surgical Market Forecast (USD Billion), by Sub-Segment 1, 2018-2029
Figure 33: Latin America Orthopedic Regenerative Surgical Market Forecast (USD Billion), by Sub-Segment 2, 2018-2029
Figure 34: Latin America Orthopedic Regenerative Surgical Market Value Share (%), By Segment 2, 2022 & 2029
Figure 35: Latin America Orthopedic Regenerative Surgical Market Forecast (USD Billion), by Sub-Segment 1, 2018-2029
Figure 36: Latin America Orthopedic Regenerative Surgical Market Forecast (USD Billion), by Sub-Segment 2, 2018-2029
Figure 37: Latin America Orthopedic Regenerative Surgical Market Forecast (USD Billion), by Sub-Segment 3, 2018-2029
Figure 38: Latin America Orthopedic Regenerative Surgical Market Forecast (USD Billion), by Others, 2018-2029
Figure 39: Latin America Orthopedic Regenerative Surgical Market Value Share (%), By Segment 3, 2022 & 2029
Figure 40: Latin America Orthopedic Regenerative Surgical Market Forecast (USD Billion), by Sub-Segment 1, 2018-2029
Figure 41: Latin America Orthopedic Regenerative Surgical Market Forecast (USD Billion), by Sub-Segment 2, 2018-2029
Figure 42: Latin America Orthopedic Regenerative Surgical Market Forecast (USD Billion), by Sub-Segment 3, 2018-2029
Figure 43: Latin America Orthopedic Regenerative Surgical Market Forecast (USD Billion), by Others, 2018-2029
Figure 44: Latin America Orthopedic Regenerative Surgical Market Forecast (USD Billion), by Brazil, 2018-2029
Figure 45: Latin America Orthopedic Regenerative Surgical Market Forecast (USD Billion), by Mexico, 2018-2029
Figure 46: Latin America Orthopedic Regenerative Surgical Market Forecast (USD Billion), by Rest of Latin America, 2018-2029
Figure 47: Europe Orthopedic Regenerative Surgical Market Value Share (%), By Segment 1, 2022 & 2029
Figure 48: Europe Orthopedic Regenerative Surgical Market Forecast (USD Billion), by Sub-Segment 1, 2018-2029
Figure 49: Europe Orthopedic Regenerative Surgical Market Forecast (USD Billion), by Sub-Segment 2, 2018-2029
Figure 50: Europe Orthopedic Regenerative Surgical Market Value Share (%), By Segment 2, 2022 & 2029
Figure 51: Europe Orthopedic Regenerative Surgical Market Forecast (USD Billion), by Sub-Segment 1, 2018-2029
Figure 52: Europe Orthopedic Regenerative Surgical Market Forecast (USD Billion), by Sub-Segment 2, 2018-2029
Figure 53: Europe Orthopedic Regenerative Surgical Market Forecast (USD Billion), by Sub-Segment 3, 2018-2029
Figure 54: Europe Orthopedic Regenerative Surgical Market Forecast (USD Billion), by Others, 2018-2029
Figure 55: Europe Orthopedic Regenerative Surgical Market Value Share (%), By Segment 3, 2022 & 2029
Figure 56: Europe Orthopedic Regenerative Surgical Market Forecast (USD Billion), by Sub-Segment 1, 2018-2029
Figure 57: Europe Orthopedic Regenerative Surgical Market Forecast (USD Billion), by Sub-Segment 2, 2018-2029
Figure 58: Europe Orthopedic Regenerative Surgical Market Forecast (USD Billion), by Sub-Segment 3, 2018-2029
Figure 59: Europe Orthopedic Regenerative Surgical Market Forecast (USD Billion), by Others, 2018-2029
Figure 60: Europe Orthopedic Regenerative Surgical Market Forecast (USD Billion), by U.K., 2018-2029
Figure 61: Europe Orthopedic Regenerative Surgical Market Forecast (USD Billion), by Germany, 2018-2029
Figure 62: Europe Orthopedic Regenerative Surgical Market Forecast (USD Billion), by France, 2018-2029
Figure 63: Europe Orthopedic Regenerative Surgical Market Forecast (USD Billion), by Italy, 2018-2029
Figure 64: Europe Orthopedic Regenerative Surgical Market Forecast (USD Billion), by Spain, 2018-2029
Figure 65: Europe Orthopedic Regenerative Surgical Market Forecast (USD Billion), by Russia, 2018-2029
Figure 66: Europe Orthopedic Regenerative Surgical Market Forecast (USD Billion), by Rest of Europe, 2018-2029
Figure 67: Asia Pacific Orthopedic Regenerative Surgical Market Value Share (%), By Segment 1, 2022 & 2029
Figure 68: Asia Pacific Orthopedic Regenerative Surgical Market Forecast (USD Billion), by Sub-Segment 1, 2018-2029
Figure 69: Asia Pacific Orthopedic Regenerative Surgical Market Forecast (USD Billion), by Sub-Segment 2, 2018-2029
Figure 70: Asia Pacific Orthopedic Regenerative Surgical Market Value Share (%), By Segment 2, 2022 & 2029
Figure 71: Asia Pacific Orthopedic Regenerative Surgical Market Forecast (USD Billion), by Sub-Segment 1, 2018-2029
Figure 72: Asia Pacific Orthopedic Regenerative Surgical Market Forecast (USD Billion), by Sub-Segment 2, 2018-2029
Figure 73: Asia Pacific Orthopedic Regenerative Surgical Market Forecast (USD Billion), by Sub-Segment 3, 2018-2029
Figure 74: Asia Pacific Orthopedic Regenerative Surgical Market Forecast (USD Billion), by Others, 2018-2029
Figure 75: Asia Pacific Orthopedic Regenerative Surgical Market Value Share (%), By Segment 3, 2022 & 2029
Figure 76: Asia Pacific Orthopedic Regenerative Surgical Market Forecast (USD Billion), by Sub-Segment 1, 2018-2029
Figure 77: Asia Pacific Orthopedic Regenerative Surgical Market Forecast (USD Billion), by Sub-Segment 2, 2018-2029
Figure 78: Asia Pacific Orthopedic Regenerative Surgical Market Forecast (USD Billion), by Sub-Segment 3, 2018-2029
Figure 79: Asia Pacific Orthopedic Regenerative Surgical Market Forecast (USD Billion), by Others, 2018-2029
Figure 80: Asia Pacific Orthopedic Regenerative Surgical Market Forecast (USD Billion), by China, 2018-2029
Figure 81: Asia Pacific Orthopedic Regenerative Surgical Market Forecast (USD Billion), by India, 2018-2029
Figure 82: Asia Pacific Orthopedic Regenerative Surgical Market Forecast (USD Billion), by Japan, 2018-2029
Figure 83: Asia Pacific Orthopedic Regenerative Surgical Market Forecast (USD Billion), by Australia, 2018-2029
Figure 84: Asia Pacific Orthopedic Regenerative Surgical Market Forecast (USD Billion), by Southeast Asia, 2018-2029
Figure 85: Asia Pacific Orthopedic Regenerative Surgical Market Forecast (USD Billion), by Rest of Asia Pacific, 2018-2029
Figure 86: Middle East & Africa Orthopedic Regenerative Surgical Market Value Share (%), By Segment 1, 2022 & 2029
Figure 87: Middle East & Africa Orthopedic Regenerative Surgical Market Forecast (USD Billion), by Sub-Segment 1, 2018-2029
Figure 88: Middle East & Africa Orthopedic Regenerative Surgical Market Forecast (USD Billion), by Sub-Segment 2, 2018-2029
Figure 89: Middle East & Africa Orthopedic Regenerative Surgical Market Value Share (%), By Segment 2, 2022 & 2029
Figure 90: Middle East & Africa Orthopedic Regenerative Surgical Market Forecast (USD Billion), by Sub-Segment 1, 2018-2029
Figure 91: Middle East & Africa Orthopedic Regenerative Surgical Market Forecast (USD Billion), by Sub-Segment 2, 2018-2029
Figure 92: Middle East & Africa Orthopedic Regenerative Surgical Market Forecast (USD Billion), by Sub-Segment 3, 2018-2029
Figure 93: Middle East & Africa Orthopedic Regenerative Surgical Market Forecast (USD Billion), by Others, 2018-2029
Figure 94: Middle East & Africa Orthopedic Regenerative Surgical Market Value Share (%), By Segment 3, 2022 & 2029
Figure 95: Middle East & Africa Orthopedic Regenerative Surgical Market Forecast (USD Billion), by Sub-Segment 1, 2018-2029
Figure 96: Middle East & Africa Orthopedic Regenerative Surgical Market Forecast (USD Billion), by Sub-Segment 2, 2018-2029
Figure 97: Middle East & Africa Orthopedic Regenerative Surgical Market Forecast (USD Billion), by Sub-Segment 3, 2018-2029
Figure 98: Middle East & Africa Orthopedic Regenerative Surgical Market Forecast (USD Billion), by Others, 2018-2029
Figure 99: Middle East & Africa Orthopedic Regenerative Surgical Market Forecast (USD Billion), by GCC, 2018-2029
Figure 100: Middle East & Africa Orthopedic Regenerative Surgical Market Forecast (USD Billion), by South Africa, 2018-2029
Figure 101: Middle East & Africa Orthopedic Regenerative Surgical Market Forecast (USD Billion), by Rest of Middle East & Africa, 2018-2029
List of Tables
Table 1: Global Orthopedic Regenerative Surgical Market Revenue (USD Billion) Forecast, by Segment 1, 2018-2029
Table 2: Global Orthopedic Regenerative Surgical Market Revenue (USD Billion) Forecast, by Segment 2, 2018-2029
Table 3: Global Orthopedic Regenerative Surgical Market Revenue (USD Billion) Forecast, by Segment 3, 2018-2029
Table 4: Global Orthopedic Regenerative Surgical Market Revenue (USD Billion) Forecast, by Region, 2018-2029
Table 5: North America Orthopedic Regenerative Surgical Market Revenue (USD Billion) Forecast, by Segment 1, 2018-2029
Table 6: North America Orthopedic Regenerative Surgical Market Revenue (USD Billion) Forecast, by Segment 2, 2018-2029
Table 7: North America Orthopedic Regenerative Surgical Market Revenue (USD Billion) Forecast, by Segment 3, 2018-2029
Table 8: North America Orthopedic Regenerative Surgical Market Revenue (USD Billion) Forecast, by Country, 2018-2029
Table 9: Europe Orthopedic Regenerative Surgical Market Revenue (USD Billion) Forecast, by Segment 1, 2018-2029
Table 10: Europe Orthopedic Regenerative Surgical Market Revenue (USD Billion) Forecast, by Segment 2, 2018-2029
Table 11: Europe Orthopedic Regenerative Surgical Market Revenue (USD Billion) Forecast, by Segment 3, 2018-2029
Table 12: Europe Orthopedic Regenerative Surgical Market Revenue (USD Billion) Forecast, by Country, 2018-2029
Table 13: Latin America Orthopedic Regenerative Surgical Market Revenue (USD Billion) Forecast, by Segment 1, 2018-2029
Table 14: Latin America Orthopedic Regenerative Surgical Market Revenue (USD Billion) Forecast, by Segment 2, 2018-2029
Table 15: Latin America Orthopedic Regenerative Surgical Market Revenue (USD Billion) Forecast, by Segment 3, 2018-2029
Table 16: Latin America Orthopedic Regenerative Surgical Market Revenue (USD Billion) Forecast, by Country, 2018-2029
Table 17: Asia Pacific Orthopedic Regenerative Surgical Market Revenue (USD Billion) Forecast, by Segment 1, 2018-2029
Table 18: Asia Pacific Orthopedic Regenerative Surgical Market Revenue (USD Billion) Forecast, by Segment 2, 2018-2029
Table 19: Asia Pacific Orthopedic Regenerative Surgical Market Revenue (USD Billion) Forecast, by Segment 3, 2018-2029
Table 20: Asia Pacific Orthopedic Regenerative Surgical Market Revenue (USD Billion) Forecast, by Country, 2018-2029
Table 21: Middle East & Africa Orthopedic Regenerative Surgical Market Revenue (USD Billion) Forecast, by Segment 1, 2018-2029
Table 22: Middle East & Africa Orthopedic Regenerative Surgical Market Revenue (USD Billion) Forecast, by Segment 2, 2018-2029
Table 23: Middle East & Africa Orthopedic Regenerative Surgical Market Revenue (USD Billion) Forecast, by Segment 3, 2018-2029
Table 24: Middle East & Africa Orthopedic Regenerative Surgical Market Revenue (USD Billion) Forecast, by Country, 2018-2029
Research Process
Data Library Research are conducted by industry experts who offer insight on
industry structure, market segmentations technology assessment and competitive landscape (CL), and penetration, as well as on emerging trends. Their analysis is based on primary interviews (~ 80%) and secondary research (~ 20%) as well as years of professional expertise in their respective industries. Adding to this, by analysing historical trends and current market positions, our analysts predict where the market will be headed for the next five years. Furthermore, the varying trends of segment & categories geographically presented are also studied and the estimated based on the primary & secondary research.
In this particular report from the supply side Data Library Research has conducted primary surveys (interviews) with the key level executives (VP, CEO’s, Marketing Director, Business Development Manager
and SOFT) of the companies that active & prominent as well as the midsized organization
FIGURE 1: DLR RESEARH PROCESS
![research-methodology1]()
Primary Research
Extensive primary research was conducted to gain a deeper insight of the market and industry performance. The analysis is based on both primary and secondary research as well as years of professional expertise in the respective industries.
In addition to analysing current and historical trends, our analysts predict where the market is headed over the next five years.
It varies by segment for these categories geographically presented in the list of market tables. Speaking about this particular report we have conducted primary surveys (interviews) with the key level executives (VP, CEO’s, Marketing Director, Business Development Manager and many more) of the major players active in the market.
Secondary Research
Secondary research was mainly used to collect and identify information useful for the extensive, technical, market-oriented, and Friend’s study of the Global Extra Neutral Alcohol. It was also used to obtain key information about major players, market classification and segmentation according to the industry trends, geographical markets, and developments related to the market and technology perspectives. For this study, analysts have gathered information from various credible sources, such as annual reports, sec filings, journals, white papers, SOFT presentations, and company web sites.
Market Size Estimation
Both, top-down and bottom-up approaches were used to estimate and validate the size of the Global market and to estimate the size of various other dependent submarkets in the overall Extra Neutral Alcohol. The key players in the market were identified through secondary research and their market contributions in the respective geographies were determined through primary and secondary research.
Forecast Model
![research-methodology2]()