Passenger Car Intelligent Steering Market Overview and Analysis

The Passenger Car Intelligent Steering Market was valued at USD 22.23 billion in 2025 and is likely to grow at a CAGR of over 18% from 2025 to 2032, reaching USD 26.56 billion in the year 2032.

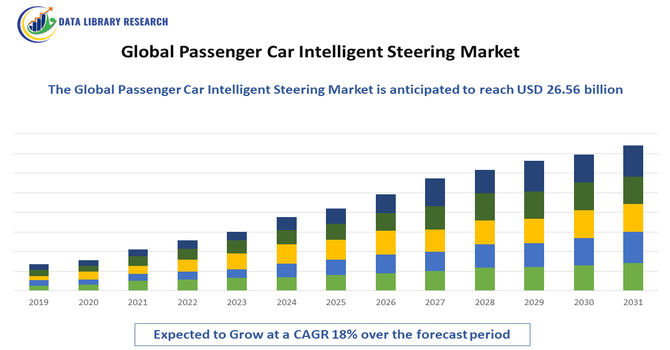
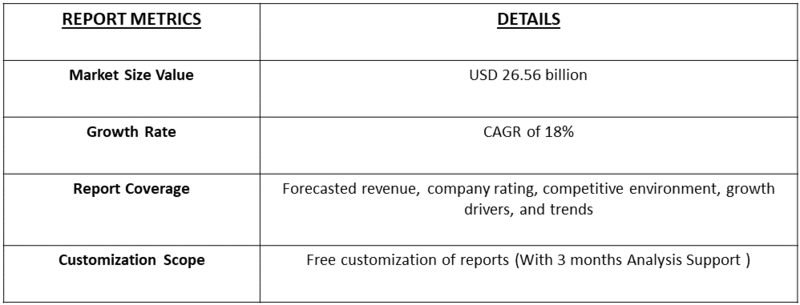
The Passenger Car Intelligent Steering Market refers to the industry focused on advanced steering systems that enhance vehicle control, safety, and driving experience through the integration of electronic, sensor-based, and software-driven technologies. These systems include features like Steer-by-Wire (SBW), adaptive steering, lane-keeping assistance, and integration with autonomous driving technologies. Unlike traditional mechanical steering, intelligent steering systems allow for more precise input, reduced driver effort, and enhanced response under varying driving conditions. As consumer demand for safety, comfort, and automation grows—especially in electric and autonomous vehicles—this market is witnessing significant innovation and investment from automotive OEMs and technology providers globally.

Passenger Car Intelligent Steering Market Latest Trends

The Passenger Car Intelligent Steering Market encompasses advanced steering technologies designed to improve vehicle safety, handling, and automation by replacing or enhancing traditional mechanical steering systems with electronic and software-based solutions. These include Steer-by-Wire, adaptive steering, and systems integrated with driver-assistance features like lane-keeping and autonomous driving. Intelligent steering enables more precise vehicle control, reduces driver fatigue, and supports the development of electric and self-driving cars. As the automotive industry moves toward smarter, more connected vehicles, the demand for intelligent steering systems is rapidly growing, driven by innovation, regulatory support for safety, and consumer expectations for comfort and performance.

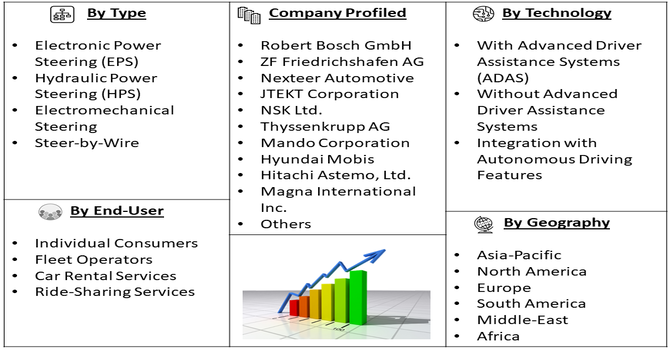
Segmentation: The Passenger Car Intelligent Steering Market is Segmented by Technology (Steer-by-Wire (SBW), Electronic Power Steering (EPS), Hydraulic Power Steering (HPS), Electro-Hydraulic Power Steering (EHPS), Active Front Steering (AFS) and Rear-Wheel Steering Systems), Component (Steering Sensors, Electronic Control Units (ECUs), Actuators, and Steering Columns & Gears), Vehicle Type (Hatchbacks, Sedans, SUVs, Luxury & Premium Cars, and Electric Passenger Cars), Level of Autonomy (Conventional (Non-Autonomous) Vehicles, Semi-Autonomous Vehicles (Level 1–2), Highly Autonomous Vehicles (Level 3–4) and Fully Autonomous Vehicles (Level 5)), Sales Channel (OEMs (Original Equipment Manufacturers) and Aftermarket), and Region (North America, Europe, Asia-Pacific, Latin America, Middle East & Africa). The report provides the value (in USD million) for the above segments.

Market Drivers:

  • Rising Demand for Advanced Driver Assistance Systems (ADAS)

The primary drivers of the passenger car intelligent steering market is the increasing demand for Advanced Driver Assistance Systems (ADAS). Intelligent steering plays a critical role in enabling functions such as lane-keeping assist, lane centering, and automated parking, all of which are key components of ADAS. As consumers become more safety-conscious and governments enforce stricter vehicle safety regulations, automakers are rapidly integrating intelligent steering technologies into their models. The rise of electric and autonomous vehicles is further accelerating this trend, as intelligent steering systems offer the precision and electronic control required for self-driving functionalities. This growing need for safety and automation is significantly boosting the adoption of intelligent steering systems globally.

  • Shift Toward Electric and Autonomous Vehicles

The global transition toward electric and autonomous vehicles is a major growth driver for the intelligent steering market. Unlike traditional mechanical systems, intelligent steering—especially steer-by-wire—offers greater design flexibility, reduced weight, and improved efficiency, which are crucial for EVs. Autonomous vehicles, in particular, require highly responsive and software-controlled steering systems to execute complex maneuvers without human input. As leading automakers invest heavily in electrification and self-driving technologies, the integration of intelligent steering has become essential. This shift not only supports better vehicle performance but also opens the door for advanced features like personalized driving modes and predictive steering control, fueling market growth in both mainstream and premium passenger car segments.

Market Restraints:

  • High Development and Integration Costs

A key restraint in the passenger car intelligent steering market is the high cost associated with developing and integrating advanced steering systems. Intelligent steering technologies require sophisticated sensors, actuators, control units, and software, all of which contribute to increased production expenses. Additionally, integrating these systems into existing vehicle architectures can be complex and time-consuming, often requiring specialized engineering and safety validation. For automakers, especially in cost-sensitive markets, these added expenses can limit the widespread adoption of such technologies in lower-priced vehicle segments. Moreover, the need for regular software updates and cybersecurity measures adds to long-term maintenance costs, making it harder for some manufacturers to justify the investment without clear consumer demand or regulatory pressure.

Socio Economic Impact on Passenger Car Intelligent Steering Market

The socio-economic impact on the Passenger Car Intelligent Steering Market is significant, as rising urbanization, growing middle-class incomes, and increasing consumer awareness of vehicle safety and comfort drive demand for advanced automotive technologies. As more people in developing and developed regions seek safer, smarter, and more convenient transportation options, intelligent steering systems are becoming a key differentiator in vehicle purchasing decisions. Additionally, government safety regulations and incentives for electric and autonomous vehicles are encouraging automakers to adopt intelligent steering solutions. This technological shift is creating new jobs in R&D, software development, and manufacturing, while also promoting skill development in high-tech automotive sectors. However, affordability remains a concern, particularly in emerging markets, where high costs may limit access to these advanced features.

Segmental Analysis:

  • Hydraulic Power Steering (HPS) Segment is Expected to Witness Significant Growth Over the Forecast Period

The Hydraulic Power Steering (HPS) segment is expected to witness notable growth, especially in developing markets where cost sensitivity remains a key concern. HPS systems, known for their robust performance and lower initial cost compared to fully electronic systems, continue to be favored in many conventional internal combustion engine (ICE) passenger cars. While the market is gradually shifting toward electronic solutions, the widespread presence of HPS in existing vehicles ensures strong aftermarket demand for maintenance and replacement. Additionally, HPS systems are valued for their strong steering feedback and durability in heavier or utility-oriented vehicles. As long as ICE vehicles remain prevalent in several regions, HPS will retain its relevance, contributing to steady growth over the forecast period.

  • Electronic Control Units (ECUs) Segment is Expected to Witness Significant Growth Over the Forecast Period

The Electronic Control Units (ECUs) segment is poised for significant growth due to the increasing integration of software-driven features in modern steering systems. ECUs are the brains behind intelligent steering, processing inputs from sensors and driver actions to ensure precise control, safety, and adaptive performance. With the rise of steer-by-wire, advanced driver assistance systems (ADAS), and autonomous driving technologies, demand for high-performance ECUs is surging. These units are essential for enabling functions such as lane keeping, automatic parking, and torque vectoring. As passenger vehicles become more connected and software-reliant, the complexity and quantity of ECUs per vehicle continue to grow, making this segment a critical driver of innovation and revenue in the intelligent steering market.

  • Luxury & Premium Cars Segment is Expected to Witness Significant Growth Over the Forecast Period

The luxury and premium cars segment is expected to see strong growth in the intelligent steering market, driven by rising consumer demand for high-performance, feature-rich vehicles. Automakers in this segment are early adopters of advanced technologies, including steer-by-wire systems, adaptive steering, and integrated ADAS features. Intelligent steering enhances ride comfort, safety, and personalization, aligning perfectly with the expectations of premium car buyers. Furthermore, the growing popularity of electric and semi-autonomous luxury vehicles is fueling demand for sophisticated steering solutions that support automation and digital control. With premium brands competing on innovation and technology, intelligent steering has become a key differentiator, ensuring this segment remains a major contributor to market expansion in the coming years.

  • Semi-Autonomous Vehicles (Level 1–2) Segment is Expected to Witness Significant Growth Over the Forecast Period

Semi-autonomous vehicles (Level 1–2) are anticipated to drive strong growth in the intelligent steering market, as these systems represent the most widely adopted form of vehicle automation today. Level 1 and 2 autonomy includes features like adaptive cruise control, lane keeping, and automatic emergency steering—functions that rely heavily on intelligent steering technologies. As regulatory bodies and consumers increasingly demand higher safety and convenience, manufacturers are equipping more mid-range vehicles with these features. Intelligent steering systems enhance the vehicle’s ability to assist the driver effectively, improving control and reducing fatigue. With rising adoption of ADAS in both emerging and developed markets, the semi-autonomous segment is set to significantly boost demand for advanced steering solutions over the forecast period.

  • Aftermarket Segment is Expected to Witness Significant Growth Over the Forecast Period

The aftermarket segment is expected to see substantial growth in the passenger car intelligent steering market, driven by increasing vehicle parc and longer vehicle lifespans. As intelligent steering systems become more common, demand for replacement components like ECUs, actuators, sensors, and steering columns is growing. Additionally, consumers seeking to upgrade their existing vehicles with ADAS features or improved handling capabilities are turning to aftermarket solutions. Independent repair shops and service centers are also investing in the tools and expertise needed to handle intelligent steering repairs. In regions with a large number of aging vehicles, the aftermarket provides a cost-effective alternative to full system replacements, contributing to this segment’s strong projected growth throughout the forecast period.

  • North America Region is Expected to Witness Significant Growth Over the Forecast Period

North America is expected to witness significant growth in the passenger car intelligent steering market, supported by strong technological infrastructure, early adoption of automotive innovations, and robust consumer demand for safety and performance features. The region is home to several major automotive OEMs, technology companies, and research institutions driving the development of advanced steering systems, including steer-by-wire and ADAS integration. Strict government regulations promoting vehicle safety and autonomous capabilities further encourage the adoption of intelligent steering technologies. Moreover, the growing electric vehicle (EV) market and consumer interest in semi-autonomous and premium vehicles are accelerating demand for precise and software-driven steering systems. These factors collectively position North America as a key growth region for the intelligent steering market over the coming years.

Passenger Car Intelligent Steering Market Competitive Landscape

The competitive landscape of the Passenger Car Intelligent Steering Market is characterized by intense innovation, strategic partnerships, and a strong focus on advanced technologies such as Steer-by-Wire, Electronic Power Steering, and integration with autonomous driving systems. Leading automotive component manufacturers like Bosch, ZF Friedrichshafen, JTEKT Corporation, Nexteer Automotive, and NSK Ltd. dominate the market, leveraging their extensive R&D capabilities and global supply chains. These players are actively collaborating with automakers and tech firms to develop next-generation steering solutions that support electric and autonomous vehicles. Startups and niche technology providers are also entering the space with specialized software and sensor-based solutions, increasing competition. As vehicle electrification and automation continue to rise, companies are prioritizing product differentiation, cost efficiency, and seamless system integration to maintain a competitive edge.

The 20 major players for above market:

  • Robert Bosch GmbH
  • ZF Friedrichshafen AG
  • Nexteer Automotive
  • JTEKT Corporation
  • NSK Ltd.
  • Thyssenkrupp AG
  • Mando Corporation
  • Hyundai Mobis
  • Showa Corporation (now part of Hitachi Astemo)
  • Hitachi Astemo, Ltd.
  • Magna International Inc.
  • Continental AG
  • TRW Automotive (part of ZF)
  • Aisin Seiki Co., Ltd.
  • Valeo S.A.
  • Denso Corporation
  • Mobis Steering Systems (MSS)
  • C.E. Niehoff & Co.
  • China Automotive Systems, Inc.
  • Mitsubishi Electric Corporation

Recent Development:

  • In September 2022, Geely and Hella announced the joint development of a production-ready Steer-by-Wire (SBW) system, with mass production scheduled to begin in 2026. This move supports greater vehicle automation and design flexibility, driving growth in the global intelligent steering market.


  • In October 2022, NIO entered into a strategic partnership with ZF to collaboratively develop advanced Steer-by-Wire technologies, marking a significant step toward next-generation intelligent driving systems. Their joint development efforts are likely to push high-performance SBW adoption, setting new standards in steering precision and safety in the global passenger car market.


Frequently Asked Questions (FAQ) :

Q1. What the main growth driving factors for this market?

The primary growth drivers are the rapid advancements in autonomous driving and Advanced Driver-Assistance Systems (ADAS). Intelligent steering is essential for features like lane-keeping and automated parking, pushing manufacturers to adopt sophisticated systems. Furthermore, the global shift towards Electric Vehicles (EVs) accelerates the demand for Electric Power Steering (EPS) and Steer-by-Wire (SBW) technologies, as these systems offer superior energy efficiency, reduced emissions, and seamless integration with complex electronic vehicle architectures. Strict government safety regulations also mandate the inclusion of these advanced features.

Q2. What are the main restraining factors for this market?

The market is constrained primarily by the high initial cost and the inherent system complexity associated with intelligent steering technologies, such as Steer-by-Wire (SBW) and advanced Electronic Power Steering (EPS). These factors often translate into higher vehicle prices, especially affecting price-sensitive developing markets. Additionally, concerns surrounding cybersecurity and data privacy are significant challenges. Since these systems rely on real-time data and electronic controls, they require robust protection against potential cyber threats to ensure vehicle safety and consumer trust.

Q3. Which segment is expected to witness high growth?

The Steer-by-Wire (SBW) technology segment is projected to witness the highest growth rate. SBW eliminates the traditional mechanical connection between the steering wheel and the road wheels, offering maximum design flexibility, significant weight reduction, and enhanced vehicle dynamics crucial for Level 3 and above autonomous vehicles. While Electronic Power Steering (EPS) currently holds the largest market share due to its widespread adoption in EVs, the foundational role of SBW in facilitating true, advanced vehicle autonomy positions it as the fastest-growing technology segment.

Q4. Who are the top major players for this market?

The global market is dominated by established automotive technology giants that specialize in steering and mobility solutions. Key major players include JTEKT Corporation, Robert Bosch GmbH, Nexteer Automotive, ZF Friedrichshafen AG, and NSK Ltd. These companies invest heavily in research and development, focusing on innovations like Steer-by-Wire and the integration of AI into steering ECUs (Electronic Control Units). Their global supply chain presence and strong relationships with Original Equipment Manufacturers (OEMs) solidify their market leadership.

Q5. Which country is the largest player?

While North America, as a region, often leads in market share due to early technology adoption and the presence of key industry players, the Asia-Pacific region, particularly China, is generally considered the largest and fastest-growing player by volume. This dominance is driven by China's massive vehicle production, strong domestic demand for passenger cars, rapid adoption of Electric Vehicles (EVs), and aggressive government policies supporting intelligent transportation systems, making it the most significant single-country market for intelligent steering systems.

Passenger Car Intelligent Steering MARKET STUDY GLOBAL MARKET ANALYSIS, INSIGHTS AND FORECAST, 2022-2029

    1. Introduction

    • 1.1. Research Scope
    • 1.2. Market Segmentation
    • 1.3. Research Methodology
    • 1.4. Definitions and Assumptions

    2. Executive Summary

      3. Market Dynamics

      • 3.1. Market Drivers
      • 3.2. Market Restraints
      • 3.3. Market Opportunities

      4. Key Insights

      • 4.1. Key Emerging Trends – For Major Countries
      • 4.2. Latest Technological Advancement
      • 4.3. Regulatory Landscape
      • 4.4. Industry SWOT Analysis
      • 4.5. Porters Five Forces Analysis

      5. Global Passenger Car Intelligent Steering Market Analysis (USD Billion), Insights and Forecast, 2018-2029

      • 5.1. Key Findings / Summary
      • 5.2. Market Analysis, Insights and Forecast – By Segment 1
        • 5.2.1. Sub-Segment 1
        • 5.2.2. Sub-Segment 2
      • 5.3. Market Analysis, Insights and Forecast – By Segment 2
        • 5.3.1. Sub-Segment 1
        • 5.3.2. Sub-Segment 2
        • 5.3.3. Sub-Segment 3
        • 5.3.4. Others
      • 5.4. Market Analysis, Insights and Forecast – By Segment 3
        • 5.4.1. Sub-Segment 1
        • 5.4.2. Sub-Segment 2
        • 5.4.3. Sub-Segment 3
        • 5.4.4. Others
      • 5.5. Market Analysis, Insights and Forecast – By Region
        • 5.5.1. North America
        • 5.5.2. Latin America
        • 5.5.3. Europe
        • 5.5.4. Asia Pacific
        • 5.5.5. Middle East and Africa

      6. North America Passenger Car Intelligent Steering Market Analysis (USD Billion), Insights and Forecast, 2018-2029

      • 6.1. Key Findings / Summary
      • 6.2. Market Analysis, Insights and Forecast – By Segment 1
        • 6.2.1. Sub-Segment 1
        • 6.2.2. Sub-Segment 2
      • 6.3. Market Analysis, Insights and Forecast – By Segment 2
        • 6.3.1. Sub-Segment 1
        • 6.3.2. Sub-Segment 2
        • 6.3.3. Sub-Segment 3
        • 6.3.4. Others
      • 6.4. Market Analysis, Insights and Forecast – By Segment 3
        • 6.4.1. Sub-Segment 1
        • 6.4.2. Sub-Segment 2
        • 6.4.3. Sub-Segment 3
        • 6.4.4. Others
      • 6.5. Market Analysis, Insights and Forecast – By Country
        • 6.5.1. U.S.
        • 6.5.2. Canada

      7. Latin America Passenger Car Intelligent Steering Market Analysis (USD Billion), Insights and Forecast, 2018-2029

      • 7.1. Key Findings / Summary
      • 7.2. Market Analysis, Insights and Forecast – By Segment 1
        • 7.2.1. Sub-Segment 1
        • 7.2.2. Sub-Segment 2
      • 7.3. Market Analysis, Insights and Forecast – By Segment 2
        • 7.3.1. Sub-Segment 1
        • 7.3.2. Sub-Segment 2
        • 7.3.3. Sub-Segment 3
        • 7.3.4. Others
      • 7.4. Market Analysis, Insights and Forecast – By Segment 3
        • 7.4.1. Sub-Segment 1
        • 7.4.2. Sub-Segment 2
        • 7.4.3. Sub-Segment 3
        • 7.4.4. Others
      • 7.5. Insights and Forecast – By Country
        • 7.5.1. Brazil
        • 7.5.2. Mexico
        • 7.5.3. Rest of Latin America

      8. Europe Passenger Car Intelligent Steering Market Analysis (USD Billion), Insights and Forecast, 2018-2029

      • 8.1. Key Findings / Summary
      • 8.2. Market Analysis, Insights and Forecast – By Segment 1
        • 8.2.1. Sub-Segment 1
        • 8.2.2. Sub-Segment 2
      • 8.3. Market Analysis, Insights and Forecast – By Segment 2
        • 8.3.1. Sub-Segment 1
        • 8.3.2. Sub-Segment 2
        • 8.3.3. Sub-Segment 3
        • 8.3.4. Others
      • 8.4. Market Analysis, Insights and Forecast – By Segment 3
        • 8.4.1. Sub-Segment 1
        • 8.4.2. Sub-Segment 2
        • 8.4.3. Sub-Segment 3
        • 8.4.4. Others
      • 8.5. Market Analysis, Insights and Forecast – By Country
        • 8.5.1. UK
        • 8.5.2. Germany
        • 8.5.3. France
        • 8.5.4. Italy
        • 8.5.5. Spain
        • 8.5.6. Russia
        • 8.5.7. Rest of Europe

      9. Asia Pacific Passenger Car Intelligent Steering Market Analysis (USD Billion), Insights and Forecast, 2018-2029

      • 9.1. Key Findings / Summary
      • 9.2. Market Analysis, Insights and Forecast – By Segment 1
        • 9.2.1. Sub-Segment 1
        • 9.2.2. Sub-Segment 2
      • 9.3. Market Analysis, Insights and Forecast – By Segment 2
        • 9.3.1. Sub-Segment 1
        • 9.3.2. Sub-Segment 2
        • 9.3.3. Sub-Segment 3
        • 9.3.4. Others
      • 9.4. Market Analysis, Insights and Forecast – By Segment 3
        • 9.4.1. Sub-Segment 1
        • 9.4.2. Sub-Segment 2
        • 9.4.3. Sub-Segment 3
        • 9.4.4. Others
      • 9.5. Market Analysis, Insights and Forecast – By Country
        • 9.5.1. China
        • 9.5.2. India
        • 9.5.3. Japan
        • 9.5.4. Australia
        • 9.5.5. South East Asia
        • 9.5.6. Rest of Asia Pacific

      10. Middle East & Africa Passenger Car Intelligent Steering Market Analysis (USD Billion), Insights and Forecast, 2018-2029

      • 10.1. Key Findings / Summary
      • 10.2. Market Analysis, Insights and Forecast – By Segment 1
        • 10.2.1. Sub-Segment 1
        • 10.2.2. Sub-Segment 2
      • 10.3. Market Analysis, Insights and Forecast – By Segment 2
        • 10.3.1. Sub-Segment 1
        • 10.3.2. Sub-Segment 2
        • 10.3.3. Sub-Segment 3
        • 10.3.4. Others
      • 10.4. Market Analysis, Insights and Forecast – By Segment 3
        • 10.4.1. Sub-Segment 1
        • 10.4.2. Sub-Segment 2
        • 10.4.3. Sub-Segment 3
        • 10.4.4. Others
      • 10.5. Market Analysis, Insights and Forecast – By Country
        • 10.5.1. GCC
        • 10.5.2. South Africa
        • 10.5.3. Rest of Middle East & Africa

      11. Competitive Analysis

      • 11.1. Company Market Share Analysis, 2018
      • 11.2. Key Industry Developments
      • 11.3. Company Profile
        • 11.3.1. Company 1
          • 11.3.1.1. Business Overview
          • 11.3.1.2. Segment 1 & Service Offering
          • 11.3.1.3. Overall Revenue
          • 11.3.1.4. Geographic Presence
          • 11.3.1.5. Recent Development
        *Similar details will be provided for the following companies
        • 11.3.2. Company 2
        • 11.3.3. Company 3
        • 11.3.4. Company 4
        • 11.3.5. Company 5
        • 11.3.6. Company 6
        • 11.3.7. Company 7
        • 11.3.8. Company 8
        • 11.3.9. Company 9
        • 11.3.10. Company 10
        • 11.3.11. Company 11
        • 11.3.12. Company 12
      List of Figures

      Figure 1: Global Real Estate Photo Editing Service Market Revenue Breakdown (USD Billion, %) by Region, 2022 & 2029
      Figure 2: Global Real Estate Photo Editing Service Market Value Share (%), By Segment 1, 2022 & 2029
      Figure 3: Global Real Estate Photo Editing Service Market Forecast (USD Billion), by Sub-Segment 1, 2018-2029
      Figure 4: Global Real Estate Photo Editing Service Market Forecast (USD Billion), by Sub-Segment 2, 2018-2029
      Figure 5: Global Real Estate Photo Editing Service Market Value Share (%), By Segment 2, 2022 & 2029
      Figure 6: Global Real Estate Photo Editing Service Market Forecast (USD Billion), by Sub-Segment 1, 2018-2029
      Figure 7: Global Real Estate Photo Editing Service Market Forecast (USD Billion), by Sub-Segment 2, 2018-2029
      Figure 8: Global Real Estate Photo Editing Service Market Forecast (USD Billion), by Sub-Segment 3, 2018-2029
      Figure 9: Global Real Estate Photo Editing Service Market Forecast (USD Billion), by Others, 2018-2029
      Figure 10: Global Real Estate Photo Editing Service Market Value Share (%), By Segment 3, 2022 & 2029
      Figure 11: Global Real Estate Photo Editing Service Market Forecast (USD Billion), by Sub-Segment 1, 2018-2029
      Figure 12: Global Real Estate Photo Editing Service Market Forecast (USD Billion), by Sub-Segment 2, 2018-2029
      Figure 13: Global Real Estate Photo Editing Service Market Forecast (USD Billion), by Sub-Segment 3, 2018-2029
      Figure 14: Global Real Estate Photo Editing Service Market Forecast (USD Billion), by Others, 2018-2029
      Figure 15: Global Real Estate Photo Editing Service Market Value (USD Billion), by Region, 2022 & 2029
      Figure 16: North America Real Estate Photo Editing Service Market Value Share (%), By Segment 1, 2022 & 2029
      Figure 17: North America Real Estate Photo Editing Service Market Forecast (USD Billion), by Sub-Segment 1, 2018-2029
      Figure 18: North America Real Estate Photo Editing Service Market Forecast (USD Billion), by Sub-Segment 2, 2018-2029
      Figure 19: North America Real Estate Photo Editing Service Market Value Share (%), By Segment 2, 2022 & 2029
      Figure 20: North America Real Estate Photo Editing Service Market Forecast (USD Billion), by Sub-Segment 1, 2018-2029
      Figure 21: North America Real Estate Photo Editing Service Market Forecast (USD Billion), by Sub-Segment 2, 2018-2029
      Figure 22: North America Real Estate Photo Editing Service Market Forecast (USD Billion), by Sub-Segment 3, 2018-2029
      Figure 23: North America Real Estate Photo Editing Service Market Forecast (USD Billion), by Others, 2018-2029
      Figure 24: North America Real Estate Photo Editing Service Market Value Share (%), By Segment 3, 2022 & 2029
      Figure 25: North America Real Estate Photo Editing Service Market Forecast (USD Billion), by Sub-Segment 1, 2018-2029
      Figure 26: North America Real Estate Photo Editing Service Market Forecast (USD Billion), by Sub-Segment 2, 2018-2029
      Figure 27: North America Real Estate Photo Editing Service Market Forecast (USD Billion), by Sub-Segment 3, 2018-2029
      Figure 28: North America Real Estate Photo Editing Service Market Forecast (USD Billion), by Others, 2018-2029
      Figure 29: North America Real Estate Photo Editing Service Market Forecast (USD Billion), by U.S., 2018-2029
      Figure 30: North America Real Estate Photo Editing Service Market Forecast (USD Billion), by Canada, 2018-2029
      Figure 31: Latin America Real Estate Photo Editing Service Market Value Share (%), By Segment 1, 2022 & 2029
      Figure 32: Latin America Real Estate Photo Editing Service Market Forecast (USD Billion), by Sub-Segment 1, 2018-2029
      Figure 33: Latin America Real Estate Photo Editing Service Market Forecast (USD Billion), by Sub-Segment 2, 2018-2029
      Figure 34: Latin America Real Estate Photo Editing Service Market Value Share (%), By Segment 2, 2022 & 2029
      Figure 35: Latin America Real Estate Photo Editing Service Market Forecast (USD Billion), by Sub-Segment 1, 2018-2029
      Figure 36: Latin America Real Estate Photo Editing Service Market Forecast (USD Billion), by Sub-Segment 2, 2018-2029
      Figure 37: Latin America Real Estate Photo Editing Service Market Forecast (USD Billion), by Sub-Segment 3, 2018-2029
      Figure 38: Latin America Real Estate Photo Editing Service Market Forecast (USD Billion), by Others, 2018-2029
      Figure 39: Latin America Real Estate Photo Editing Service Market Value Share (%), By Segment 3, 2022 & 2029
      Figure 40: Latin America Real Estate Photo Editing Service Market Forecast (USD Billion), by Sub-Segment 1, 2018-2029
      Figure 41: Latin America Real Estate Photo Editing Service Market Forecast (USD Billion), by Sub-Segment 2, 2018-2029
      Figure 42: Latin America Real Estate Photo Editing Service Market Forecast (USD Billion), by Sub-Segment 3, 2018-2029
      Figure 43: Latin America Real Estate Photo Editing Service Market Forecast (USD Billion), by Others, 2018-2029
      Figure 44: Latin America Real Estate Photo Editing Service Market Forecast (USD Billion), by Brazil, 2018-2029
      Figure 45: Latin America Real Estate Photo Editing Service Market Forecast (USD Billion), by Mexico, 2018-2029
      Figure 46: Latin America Real Estate Photo Editing Service Market Forecast (USD Billion), by Rest of Latin America, 2018-2029
      Figure 47: Europe Real Estate Photo Editing Service Market Value Share (%), By Segment 1, 2022 & 2029
      Figure 48: Europe Real Estate Photo Editing Service Market Forecast (USD Billion), by Sub-Segment 1, 2018-2029
      Figure 49: Europe Real Estate Photo Editing Service Market Forecast (USD Billion), by Sub-Segment 2, 2018-2029
      Figure 50: Europe Real Estate Photo Editing Service Market Value Share (%), By Segment 2, 2022 & 2029
      Figure 51: Europe Real Estate Photo Editing Service Market Forecast (USD Billion), by Sub-Segment 1, 2018-2029
      Figure 52: Europe Real Estate Photo Editing Service Market Forecast (USD Billion), by Sub-Segment 2, 2018-2029
      Figure 53: Europe Real Estate Photo Editing Service Market Forecast (USD Billion), by Sub-Segment 3, 2018-2029
      Figure 54: Europe Real Estate Photo Editing Service Market Forecast (USD Billion), by Others, 2018-2029
      Figure 55: Europe Real Estate Photo Editing Service Market Value Share (%), By Segment 3, 2022 & 2029
      Figure 56: Europe Real Estate Photo Editing Service Market Forecast (USD Billion), by Sub-Segment 1, 2018-2029
      Figure 57: Europe Real Estate Photo Editing Service Market Forecast (USD Billion), by Sub-Segment 2, 2018-2029
      Figure 58: Europe Real Estate Photo Editing Service Market Forecast (USD Billion), by Sub-Segment 3, 2018-2029
      Figure 59: Europe Real Estate Photo Editing Service Market Forecast (USD Billion), by Others, 2018-2029
      Figure 60: Europe Real Estate Photo Editing Service Market Forecast (USD Billion), by U.K., 2018-2029
      Figure 61: Europe Real Estate Photo Editing Service Market Forecast (USD Billion), by Germany, 2018-2029
      Figure 62: Europe Real Estate Photo Editing Service Market Forecast (USD Billion), by France, 2018-2029
      Figure 63: Europe Real Estate Photo Editing Service Market Forecast (USD Billion), by Italy, 2018-2029
      Figure 64: Europe Real Estate Photo Editing Service Market Forecast (USD Billion), by Spain, 2018-2029
      Figure 65: Europe Real Estate Photo Editing Service Market Forecast (USD Billion), by Russia, 2018-2029
      Figure 66: Europe Real Estate Photo Editing Service Market Forecast (USD Billion), by Rest of Europe, 2018-2029
      Figure 67: Asia Pacific Real Estate Photo Editing Service Market Value Share (%), By Segment 1, 2022 & 2029
      Figure 68: Asia Pacific Real Estate Photo Editing Service Market Forecast (USD Billion), by Sub-Segment 1, 2018-2029
      Figure 69: Asia Pacific Real Estate Photo Editing Service Market Forecast (USD Billion), by Sub-Segment 2, 2018-2029
      Figure 70: Asia Pacific Real Estate Photo Editing Service Market Value Share (%), By Segment 2, 2022 & 2029
      Figure 71: Asia Pacific Real Estate Photo Editing Service Market Forecast (USD Billion), by Sub-Segment 1, 2018-2029
      Figure 72: Asia Pacific Real Estate Photo Editing Service Market Forecast (USD Billion), by Sub-Segment 2, 2018-2029
      Figure 73: Asia Pacific Real Estate Photo Editing Service Market Forecast (USD Billion), by Sub-Segment 3, 2018-2029
      Figure 74: Asia Pacific Real Estate Photo Editing Service Market Forecast (USD Billion), by Others, 2018-2029
      Figure 75: Asia Pacific Real Estate Photo Editing Service Market Value Share (%), By Segment 3, 2022 & 2029
      Figure 76: Asia Pacific Real Estate Photo Editing Service Market Forecast (USD Billion), by Sub-Segment 1, 2018-2029
      Figure 77: Asia Pacific Real Estate Photo Editing Service Market Forecast (USD Billion), by Sub-Segment 2, 2018-2029
      Figure 78: Asia Pacific Real Estate Photo Editing Service Market Forecast (USD Billion), by Sub-Segment 3, 2018-2029
      Figure 79: Asia Pacific Real Estate Photo Editing Service Market Forecast (USD Billion), by Others, 2018-2029
      Figure 80: Asia Pacific Real Estate Photo Editing Service Market Forecast (USD Billion), by China, 2018-2029
      Figure 81: Asia Pacific Real Estate Photo Editing Service Market Forecast (USD Billion), by India, 2018-2029
      Figure 82: Asia Pacific Real Estate Photo Editing Service Market Forecast (USD Billion), by Japan, 2018-2029
      Figure 83: Asia Pacific Real Estate Photo Editing Service Market Forecast (USD Billion), by Australia, 2018-2029
      Figure 84: Asia Pacific Real Estate Photo Editing Service Market Forecast (USD Billion), by Southeast Asia, 2018-2029
      Figure 85: Asia Pacific Real Estate Photo Editing Service Market Forecast (USD Billion), by Rest of Asia Pacific, 2018-2029
      Figure 86: Middle East & Africa Real Estate Photo Editing Service Market Value Share (%), By Segment 1, 2022 & 2029
      Figure 87: Middle East & Africa Real Estate Photo Editing Service Market Forecast (USD Billion), by Sub-Segment 1, 2018-2029
      Figure 88: Middle East & Africa Real Estate Photo Editing Service Market Forecast (USD Billion), by Sub-Segment 2, 2018-2029
      Figure 89: Middle East & Africa Real Estate Photo Editing Service Market Value Share (%), By Segment 2, 2022 & 2029
      Figure 90: Middle East & Africa Real Estate Photo Editing Service Market Forecast (USD Billion), by Sub-Segment 1, 2018-2029
      Figure 91: Middle East & Africa Real Estate Photo Editing Service Market Forecast (USD Billion), by Sub-Segment 2, 2018-2029
      Figure 92: Middle East & Africa Real Estate Photo Editing Service Market Forecast (USD Billion), by Sub-Segment 3, 2018-2029
      Figure 93: Middle East & Africa Real Estate Photo Editing Service Market Forecast (USD Billion), by Others, 2018-2029
      Figure 94: Middle East & Africa Real Estate Photo Editing Service Market Value Share (%), By Segment 3, 2022 & 2029
      Figure 95: Middle East & Africa Real Estate Photo Editing Service Market Forecast (USD Billion), by Sub-Segment 1, 2018-2029
      Figure 96: Middle East & Africa Real Estate Photo Editing Service Market Forecast (USD Billion), by Sub-Segment 2, 2018-2029
      Figure 97: Middle East & Africa Real Estate Photo Editing Service Market Forecast (USD Billion), by Sub-Segment 3, 2018-2029
      Figure 98: Middle East & Africa Real Estate Photo Editing Service Market Forecast (USD Billion), by Others, 2018-2029
      Figure 99: Middle East & Africa Real Estate Photo Editing Service Market Forecast (USD Billion), by GCC, 2018-2029
      Figure 100: Middle East & Africa Real Estate Photo Editing Service Market Forecast (USD Billion), by South Africa, 2018-2029
      Figure 101: Middle East & Africa Real Estate Photo Editing Service Market Forecast (USD Billion), by Rest of Middle East & Africa, 2018-2029 
      List of Tables
      Table 1: Global Real Estate Photo Editing Service Market Revenue (USD Billion) Forecast, by Segment 1, 2018-2029
      Table 2: Global Real Estate Photo Editing Service Market Revenue (USD Billion) Forecast, by Segment 2, 2018-2029
      Table 3: Global Real Estate Photo Editing Service Market Revenue (USD Billion) Forecast, by Segment 3, 2018-2029
      Table 4: Global Real Estate Photo Editing Service Market Revenue (USD Billion) Forecast, by Region, 2018-2029
      Table 5: North America Real Estate Photo Editing Service Market Revenue (USD Billion) Forecast, by Segment 1, 2018-2029
      Table 6: North America Real Estate Photo Editing Service Market Revenue (USD Billion) Forecast, by Segment 2, 2018-2029
      Table 7: North America Real Estate Photo Editing Service Market Revenue (USD Billion) Forecast, by Segment 3, 2018-2029
      Table 8: North America Real Estate Photo Editing Service Market Revenue (USD Billion) Forecast, by Country, 2018-2029
      Table 9: Europe Real Estate Photo Editing Service Market Revenue (USD Billion) Forecast, by Segment 1, 2018-2029
      Table 10: Europe Real Estate Photo Editing Service Market Revenue (USD Billion) Forecast, by Segment 2, 2018-2029
      Table 11: Europe Real Estate Photo Editing Service Market Revenue (USD Billion) Forecast, by Segment 3, 2018-2029
      Table 12: Europe Real Estate Photo Editing Service Market Revenue (USD Billion) Forecast, by Country, 2018-2029
      Table 13: Latin America Real Estate Photo Editing Service Market Revenue (USD Billion) Forecast, by Segment 1, 2018-2029
      Table 14: Latin America Real Estate Photo Editing Service Market Revenue (USD Billion) Forecast, by Segment 2, 2018-2029
      Table 15: Latin America Real Estate Photo Editing Service Market Revenue (USD Billion) Forecast, by Segment 3, 2018-2029
      Table 16: Latin America Real Estate Photo Editing Service Market Revenue (USD Billion) Forecast, by Country, 2018-2029
      Table 17: Asia Pacific Real Estate Photo Editing Service Market Revenue (USD Billion) Forecast, by Segment 1, 2018-2029
      Table 18: Asia Pacific Real Estate Photo Editing Service Market Revenue (USD Billion) Forecast, by Segment 2, 2018-2029
      Table 19: Asia Pacific Real Estate Photo Editing Service Market Revenue (USD Billion) Forecast, by Segment 3, 2018-2029
      Table 20: Asia Pacific Real Estate Photo Editing Service Market Revenue (USD Billion) Forecast, by Country, 2018-2029
      Table 21: Middle East & Africa Real Estate Photo Editing Service Market Revenue (USD Billion) Forecast, by Segment 1, 2018-2029
      Table 22: Middle East & Africa Real Estate Photo Editing Service Market Revenue (USD Billion) Forecast, by Segment 2, 2018-2029
      Table 23: Middle East & Africa Real Estate Photo Editing Service Market Revenue (USD Billion) Forecast, by Segment 3, 2018-2029
      Table 24: Middle East & Africa Real Estate Photo Editing Service Market Revenue (USD Billion) Forecast, by Country, 2018-2029
      Research Process

      Data Library Research are conducted by industry experts who offer insight on industry structure, market segmentations technology assessment and competitive landscape (CL), and penetration, as well as on emerging trends. Their analysis is based on primary interviews (~ 80%) and secondary research (~ 20%) as well as years of professional expertise in their respective industries. Adding to this, by analysing historical trends and current market positions, our analysts predict where the market will be headed for the next five years. Furthermore, the varying trends of segment & categories geographically presented are also studied and the estimated based on the primary & secondary research.

      In this particular report from the supply side Data Library Research has conducted primary surveys (interviews) with the key level executives (VP, CEO’s, Marketing Director, Business Development Manager and SOFT) of the companies that active & prominent as well as the midsized organization

      FIGURE 1: DLR RESEARH PROCESS

      research-methodology1

      Primary Research

      Extensive primary research was conducted to gain a deeper insight of the market and industry performance. The analysis is based on both primary and secondary research as well as years of professional expertise in the respective industries.

      In addition to analysing current and historical trends, our analysts predict where the market is headed over the next five years.

      It varies by segment for these categories geographically presented in the list of market tables. Speaking about this particular report we have conducted primary surveys (interviews) with the key level executives (VP, CEO’s, Marketing Director, Business Development Manager and many more) of the major players active in the market.

      Secondary Research

      Secondary research was mainly used to collect and identify information useful for the extensive, technical, market-oriented, and Friend’s study of the Global Extra Neutral Alcohol. It was also used to obtain key information about major players, market classification and segmentation according to the industry trends, geographical markets, and developments related to the market and technology perspectives. For this study, analysts have gathered information from various credible sources, such as annual reports, sec filings, journals, white papers, SOFT presentations, and company web sites.

      Market Size Estimation

      Both, top-down and bottom-up approaches were used to estimate and validate the size of the Global market and to estimate the size of various other dependent submarkets in the overall Extra Neutral Alcohol. The key players in the market were identified through secondary research and their market contributions in the respective geographies were determined through primary and secondary research.

      Forecast Model

      research-methodology2

      Happy to Assist You

      If you have a question?

      info@datalibraryresearch.com

      IND : +91 955 279 0357

      Browse Related Reports