Pharmaceutical Isolator Market Overview
A pharmaceutical isolator isolates the interior from the external environment continually. Pharmaceutical isolators are generally used to handle medications, quality control processes, and materials that require complete isolation from the outside world. They also come in a variety of forms and sizes, allowing them to be used in a wide range of sectors. The global Pharmaceutical Isolator market is expected to rise at a considerable rate in the forthcoming years.
The pharmaceutical isolators market is growing due to the rising demand for pharmaceutical isolators in the burgeoning pharmaceutical and biotechnology sectors. Pharmaceutical isolators are becoming more popular as laws for assuring the safety of pharmaceutical techniques become more widely implemented. The increased demand for pharmaceutical isolators from small and midscale pharmaceutical companies. This factor is expected to increase the growth of the global pharmaceutical isolators market.
Other reasons driving the global pharmaceutical isolators market are increased use of sterilizing procedures, the expense of noncompliance, the expansion of research laboratories, and developments in isolator efficiency. Furthermore, pharmaceutical isolators' ability to properly manage hazardous compounds, combined with the introduction of new products, is driving the global pharmaceutical isolators market forward.
Furthermore, features such as portability, connectivity, and the ability to grab a stationary position make them useful for a wide range of applications. These reasons are accelerating the usage of pharmaceutical isolators and positively impacting the pharmaceutical isolators market's growth.
| Report Metric |
Details |
| Market size available for years |
2023–2030 |
| Base year considered |
2023 |
| Forecast period |
2024–2030 |
| Forecast unit |
Value (USD Million) |
| Segments covered |
Type, Pressure, Application, End-User, and Region |
| Regions covered |
North America (the U.S. and Canada), Europe (UK, Germany, France, Italy, Spain, Russia, Rest of Europe), Asia-Pacific (China, India, Japan, Australia, South East Asia, Rest of Asia Pacific), Latin America and the Middle East and Africa (Brazil, Saudi Arabia, UAE, Rest of LAMEA) |
| Companies covered |
Skan AG, COMECER S.p.A., Hosokawa Micron Ltd, Getinge AB, Azbil Telstar, Robert Bosch GmbH. |
Covid-19 Impact on Pharmaceutical Isolator Market
In addition, the current Pharmaceutical Isolator Market study offers a detailed analysis of the current COVID-19 pandemic impact on the market growth and its influence on the future growth of the Pharmaceutical Isolator Market. The recently published report demonstrates the elevation in the demand for the healthcare sector. The healthcare manufacturers have experienced long term as well as short term effect which includes supply shortages, panic buying, and stocking, regulation changes as short-term whereas approval delays and possible trend variations in consumption could be perceived as long-term impacts of COVID-19 on the health and pharmaceutical market.
The increasing need for a cure has pushed vaccine research and manufacturers to the limit. In addition to this, panic conditions have already spurred the demand for many healthcare products and services which are discussed in detail in this report. Moreover, the impact of COVID-19 on overall market revenue for the base year 2020 and its projection up to 2027 is provided in detail in this report.
Pharmaceutical Isolator Market Segment Overview
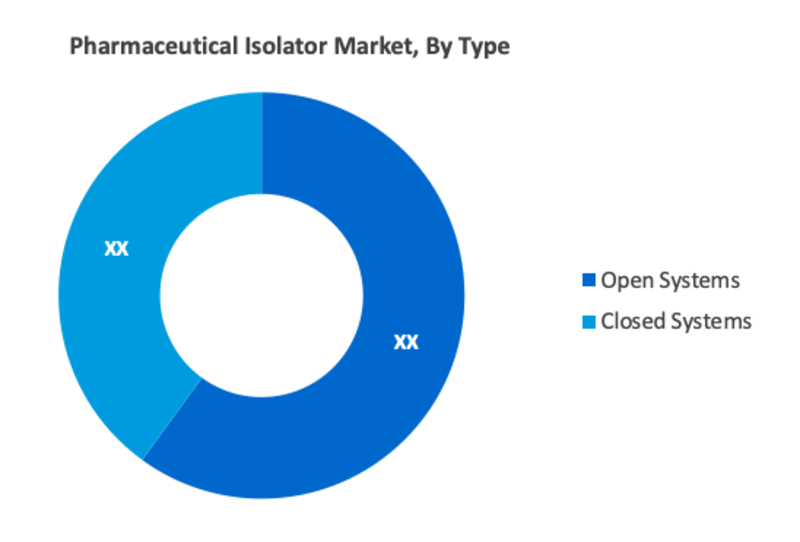
According to Type, Open Systems is one of the most prominent segments in the global Pharmaceutical Isolator Market. This is because these are easy to operate, validate, and quite inexpensive isolators. The rise in the manufacturing of products and contract manufacturing services in the pharmaceutical sector can propel the open system isolator market growth.
Pharmaceutical Isolator Market, By Type
· Open Systems
· Closed Systems
Pharmaceutical Isolator Market, By Pressure
· Positive Pressure
· Negative Pressure
Pharmaceutical Isolator Market, By Application
· Aseptic Filling
· Sampling or Weighing or Distribution
· Fluid Dispensing
· Product Containment
· Others
Pharmaceutical Isolator Market, By End-User
· Hospitals
· Pharmaceutical and Biotechnology Companies
· Research and Academic Laboratories
· Others
Pharmaceutical Isolator Market Regional Overview
Geographically, North America is expected to dominate the global pharmaceutical isolator market. This is due to the faster acceptance of advanced healthcare products. On the other hand, the market in the Asia Pacific is anticipated to enlarge with a high CAGR owing to increasing investment in the pharmaceutical isolators market by key players for catering to the unmet needs of the pharmaceutical sector.
Pharmaceutical Isolator Market, By Geography
· North America (US & Canada)
· Europe (UK, Germany, France, Italy, Spain, Russia & Rest of Europe)
· Asia-Pacific (Japan, China, India, Australia, & South Korea, & Rest of Asia-Pacific)
· LAMEA (Brazil, Saudi Arabia, UAE & Rest of LAMEA)
Pharmaceutical Isolator Market Competitor overview
Some key developments and strategies adopted by manufacturers in the Pharmaceutical Isolator are highlighted below.
· In April 2021, ILC Dover, specialising in the design and production of single-use flexible solutions for global pharmaceutical and biopharmaceutical processing, has introduced the soloPURE flexible aseptic isolator. The new offering is a cost-effective, closed-barrier system for sterile manufacturing. With a fully disposable, single-use chamber and a CAPEX-efficient compact design, soloPURE represents the future of sterile manufacturing.
Pharmaceutical Isolator Market, Key Players
· Skan AG
· COMECER S.p.A.
· Hosokawa Micron Ltd
· Getinge AB
· Azbil Telstar
· Robert Bosch GmbH
Frequently Asked Questions (FAQ) :
Q1. What are the driving factors for the Pharmaceutical Isolator market?
The pharmaceutical isolators market is growing due to the rising demand for pharmaceutical isolators in the burgeoning pharmaceutical and biotechnology sectors
Q2. Which Segments are covered in the Pharmaceutical Isolator Market report?
Type, Pressure, Application, End-User, and Region these segments are covered in the Pharmaceutical Isolator market report.
Q3. Which segment is projected to hold the largest share in the Pharmaceutical Isolator Market?
Open Systems segment is projected to hold the largest share in the Pharmaceutical Isolator Market.
Q4. Which region holds the largest share in the Pharmaceutical Isolator market?
North America held the largest share in the global Pharmaceutical Isolator market
Q5. Which are the prominent players in the Pharmaceutical Isolator Market?
Skan AG, COMECER S.p.A., Hosokawa Micron Ltd, Getinge AB, Azbil Telstar, Robert Bosch GmbH are some key players in the Pharmaceutical Isolator Market.
List of Figures
Figure 1: Global Pharmaceutical Isolator Market Revenue Breakdown (USD Billion, %) by Region, 2019 & 2027
Figure 2: Global Market Value Share (%), By Segment 1, 2019 & 2027
Figure 3: Global Market Forecast (USD Billion), by Sub-Segment 1, 2016-2027
Figure 4: Global Market Forecast (USD Billion), by Sub-Segment 2, 2016-2027
Figure 5: Global Market Value Share (%), By Segment 2, 2019 & 2027
Figure 6: Global Market Forecast (USD Billion), by Sub-Segment 1, 2016-2027
Figure 7: Global Market Forecast (USD Billion), by Sub-Segment 2, 2016-2027
Figure 8: Global Market Forecast (USD Billion), by Sub-Segment 3, 2016-2027
Figure 9: Global Pharmaceutical Isolator Market Forecast (USD Billion), by Others, 2016-2027
Figure 10: Global Market Value Share (%), By Segment 3, 2019 & 2027
Figure 11: Global Market Forecast (USD Billion), by Sub-Segment 1, 2016-2027
Figure 12: Global Market Forecast (USD Billion), by Sub-Segment 2, 2016-2027
Figure 13: Global Market Forecast (USD Billion), by Sub-Segment 3, 2016-2027
Figure 14: Global Market Forecast (USD Billion), by Others, 2016-2027
Figure 15: Global Market Value (USD Billion), by Region, 2019 & 2027
Figure 16: North America Pharmaceutical Isolator Market Value Share (%), By Segment 1, 2019 & 2027
Figure 17: North America Market Forecast (USD Billion), by Sub-Segment 1, 2016-2027
Figure 18: North America Market Forecast (USD Billion), by Sub-Segment 2, 2016-2027
Figure 19: North America Market Value Share (%), By Segment 2, 2019 & 2027
Figure 20: North America Market Forecast (USD Billion), by Sub-Segment 1, 2016-2027
Figure 21: North America Market Forecast (USD Billion), by Sub-Segment 2, 2016-2027
Figure 22: North America Market Forecast (USD Billion), by Sub-Segment 3, 2016-2027
Figure 23: North America Market Forecast (USD Billion), by Others, 2016-2027
Figure 24: North America Market Value Share (%), By Segment 3, 2019 & 2027
Figure 25: North America Market Forecast (USD Billion), by Sub-Segment 1, 2016-2027
Figure 26: North America Market Forecast (USD Billion), by Sub-Segment 2, 2016-2027
Figure 27: North America Market Forecast (USD Billion), by Sub-Segment 3, 2016-2027
Figure 28: North America Market Forecast (USD Billion), by Others, 2016-2027
Figure 29: North America Market Forecast (USD Billion), by U.S., 2016-2027
Figure 30: North America Market Forecast (USD Billion), by Canada, 2016-2027
Figure 31: Latin America Pharmaceutical Isolator Market Value Share (%), By Segment 1, 2019 & 2027
Figure 32: Latin America Market Forecast (USD Billion), by Sub-Segment 1, 2016-2027
Figure 33: Latin America Market Forecast (USD Billion), by Sub-Segment 2, 2016-2027
Figure 34: Latin America Market Value Share (%), By Segment 2, 2019 & 2027
Figure 35: Latin America Market Forecast (USD Billion), by Sub-Segment 1, 2016-2027
Figure 36: Latin America Market Forecast (USD Billion), by Sub-Segment 2, 2016-2027
Figure 37: Latin America Market Forecast (USD Billion), by Sub-Segment 3, 2016-2027
Figure 38: Latin America Market Forecast (USD Billion), by Others, 2016-2027
Figure 39: Latin America Market Value Share (%), By Segment 3, 2019 & 2027
Figure 40: Latin America Market Forecast (USD Billion), by Sub-Segment 1, 2016-2027
Figure 41: Latin America Market Forecast (USD Billion), by Sub-Segment 2, 2016-2027
Figure 42: Latin America Market Forecast (USD Billion), by Sub-Segment 3, 2016-2027
Figure 43: Latin America Market Forecast (USD Billion), by Others, 2016-2027
Figure 44: Latin America Market Forecast (USD Billion), by Brazil, 2016-2027
Figure 45: Latin America Market Forecast (USD Billion), by Mexico, 2016-2027
Figure 46: Latin America Market Forecast (USD Billion), by Rest of Latin America, 2016-2027
Figure 47: Europe Pharmaceutical Isolator Market Value Share (%), By Segment 1, 2019 & 2027
Figure 48: Europe Market Forecast (USD Billion), by Sub-Segment 1, 2016-2027
Figure 49: Europe Market Forecast (USD Billion), by Sub-Segment 2, 2016-2027
Figure 50: Europe Market Value Share (%), By Segment 2, 2019 & 2027
Figure 51: Europe Market Forecast (USD Billion), by Sub-Segment 1, 2016-2027
Figure 52: Europe Market Forecast (USD Billion), by Sub-Segment 2, 2016-2027
Figure 53: Europe Market Forecast (USD Billion), by Sub-Segment 3, 2016-2027
Figure 54: Europe Market Forecast (USD Billion), by Others, 2016-2027
Figure 55: Europe Market Value Share (%), By Segment 3, 2019 & 2027
Figure 56: Europe Market Forecast (USD Billion), by Sub-Segment 1, 2016-2027
Figure 57: Europe Market Forecast (USD Billion), by Sub-Segment 2, 2016-2027
Figure 58: Europe Market Forecast (USD Billion), by Sub-Segment 3, 2016-2027
Figure 59: Europe Market Forecast (USD Billion), by Others, 2016-2027
Figure 60: Europe Market Forecast (USD Billion), by U.K., 2016-2027
Figure 61: Europe Market Forecast (USD Billion), by Germany, 2016-2027
Figure 62: Europe Market Forecast (USD Billion), by France, 2016-2027
Figure 63: Europe Market Forecast (USD Billion), by Italy, 2016-2027
Figure 64: Europe Market Forecast (USD Billion), by Spain, 2016-2027
Figure 65: Europe Market Forecast (USD Billion), by Russia, 2016-2027
Figure 66: Europe Market Forecast (USD Billion), by Rest of Europe, 2016-2027
Figure 67: Asia Pacific Pharmaceutical Isolator Market Value Share (%), By Segment 1, 2019 & 2027
Figure 68: Asia Pacific Market Forecast (USD Billion), by Sub-Segment 1, 2016-2027
Figure 69: Asia Pacific Market Forecast (USD Billion), by Sub-Segment 2, 2016-2027
Figure 70: Asia Pacific Market Value Share (%), By Segment 2, 2019 & 2027
Figure 71: Asia Pacific Market Forecast (USD Billion), by Sub-Segment 1, 2016-2027
Figure 72: Asia Pacific Market Forecast (USD Billion), by Sub-Segment 2, 2016-2027
Figure 73: Asia Pacific Market Forecast (USD Billion), by Sub-Segment 3, 2016-2027
Figure 74: Asia Pacific Market Forecast (USD Billion), by Others, 2016-2027
Figure 75: Asia Pacific Market Value Share (%), By Segment 3, 2019 & 2027
Figure 76: Asia Pacific Market Forecast (USD Billion), by Sub-Segment 1, 2016-2027
Figure 77: Asia Pacific Market Forecast (USD Billion), by Sub-Segment 2, 2016-2027
Figure 78: Asia Pacific Market Forecast (USD Billion), by Sub-Segment 3, 2016-2027
Figure 79: Asia Pacific Market Forecast (USD Billion), by Others, 2016-2027
Figure 80: Asia Pacific Market Forecast (USD Billion), by China, 2016-2027
Figure 81: Asia Pacific Market Forecast (USD Billion), by India, 2016-2027
Figure 82: Asia Pacific Market Forecast (USD Billion), by Japan, 2016-2027
Figure 83: Asia Pacific Market Forecast (USD Billion), by Australia, 2016-2027
Figure 84: Asia Pacific Market Forecast (USD Billion), by Southeast Asia, 2016-2027
Figure 85: Asia Pacific Market Forecast (USD Billion), by Rest of Asia Pacific, 2016-2027
Figure 86: Middle East & Africa Pharmaceutical Isolator Market Value Share (%), By Segment 1, 2019 & 2027
Figure 87: Middle East & Africa Market Forecast (USD Billion), by Sub-Segment 1, 2016-2027
Figure 88: Middle East & Africa Market Forecast (USD Billion), by Sub-Segment 2, 2016-2027
Figure 89: Middle East & Africa Market Value Share (%), By Segment 2, 2019 & 2027
Figure 90: Middle East & Africa Market Forecast (USD Billion), by Sub-Segment 1, 2016-2027
Figure 91: Middle East & Africa Market Forecast (USD Billion), by Sub-Segment 2, 2016-2027
Figure 92: Middle East & Africa Market Forecast (USD Billion), by Sub-Segment 3, 2016-2027
Figure 93: Middle East & Africa Market Forecast (USD Billion), by Others, 2016-2027
Figure 94: Middle East & Africa Market Value Share (%), By Segment 3, 2019 & 2027
Figure 95: Middle East & Africa Market Forecast (USD Billion), by Sub-Segment 1, 2016-2027
Figure 96: Middle East & Africa Market Forecast (USD Billion), by Sub-Segment 2, 2016-2027
Figure 97: Middle East & Africa Market Forecast (USD Billion), by Sub-Segment 3, 2016-2027
Figure 98: Middle East & Africa Market Forecast (USD Billion), by Others, 2016-2027
Figure 99: Middle East & Africa Market Forecast (USD Billion), by GCC, 2016-2027
Figure 100: Middle East & Africa Market Forecast (USD Billion), by South Africa, 2016-2027
Figure 101: Middle East & Africa Market Forecast (USD Billion), by Rest of Middle East & Africa, 2016-2027
List of Tables
Table 1: Global Pharmaceutical Isolator Market Revenue (USD Billion) Forecast, by Segment 1, 2016-2027
Table 2: Global Market Revenue (USD Billion) Forecast, by Segment 2, 2016-2027
Table 3: Global Market Revenue (USD Billion) Forecast, by Segment 3, 2016-2027
Table 4: Global Market Revenue (USD Billion) Forecast, by Region, 2016-2027
Table 5: North America Pharmaceutical Isolator Market Revenue (USD Billion) Forecast, by Segment 1, 2016-2027
Table 6: North America Market Revenue (USD Billion) Forecast, by Segment 2, 2016-2027
Table 7: North America Market Revenue (USD Billion) Forecast, by Segment 3, 2016-2027
Table 8: North America Market Revenue (USD Billion) Forecast, by Country, 2016-2027
Table 9: Europe Pharmaceutical Isolator Market Revenue (USD Billion) Forecast, by Segment 1, 2016-2027
Table 10: Europe Market Revenue (USD Billion) Forecast, by Segment 2, 2016-2027
Table 11: Europe Market Revenue (USD Billion) Forecast, by Segment 3, 2016-2027
Table 12: Europe Market Revenue (USD Billion) Forecast, by Country, 2016-2027
Table 13: Latin America Pharmaceutical Isolator Market Revenue (USD Billion) Forecast, by Segment 1, 2016-2027
Table 14: Latin America Market Revenue (USD Billion) Forecast, by Segment 2, 2016-2027
Table 15: Latin America Market Revenue (USD Billion) Forecast, by Segment 3, 2016-2027
Table 16: Latin America Market Revenue (USD Billion) Forecast, by Country, 2016-2027
Table 17: Asia Pacific Pharmaceutical Isolator Market Revenue (USD Billion) Forecast, by Segment 1, 2016-2027
Table 18: Asia Pacific Market Revenue (USD Billion) Forecast, by Segment 2, 2016-2027
Table 19: Asia Pacific Market Revenue (USD Billion) Forecast, by Segment 3, 2016-2027
Table 20: Asia Pacific Market Revenue (USD Billion) Forecast, by Country, 2016-2027
Table 21: Middle East & Africa Pharmaceutical Isolator Market Revenue (USD Billion) Forecast, by Segment 1, 2016-2027
Table 22: Middle East & Africa Market Revenue (USD Billion) Forecast, by Segment 2, 2016-2027
Table 23: Middle East & Africa Market Revenue (USD Billion) Forecast, by Segment 3, 2016-2027
Table 24: Middle East & Africa Market Revenue (USD Billion) Forecast, by Country, 2016-2027
Research Process
Data Library Research are conducted by industry experts who offer insight on
industry structure, market segmentations technology assessment and competitive landscape (CL), and penetration, as well as on emerging trends. Their analysis is based on primary interviews (~ 80%) and secondary research (~ 20%) as well as years of professional expertise in their respective industries. Adding to this, by analysing historical trends and current market positions, our analysts predict where the market will be headed for the next five years. Furthermore, the varying trends of segment & categories geographically presented are also studied and the estimated based on the primary & secondary research.
In this particular report from the supply side Data Library Research has conducted primary surveys (interviews) with the key level executives (VP, CEO’s, Marketing Director, Business Development Manager
and SOFT) of the companies that active & prominent as well as the midsized organization
FIGURE 1: DLR RESEARH PROCESS
![research-methodology1]()
Primary Research
Extensive primary research was conducted to gain a deeper insight of the market and industry performance. The analysis is based on both primary and secondary research as well as years of professional expertise in the respective industries.
In addition to analysing current and historical trends, our analysts predict where the market is headed over the next five years.
It varies by segment for these categories geographically presented in the list of market tables. Speaking about this particular report we have conducted primary surveys (interviews) with the key level executives (VP, CEO’s, Marketing Director, Business Development Manager and many more) of the major players active in the market.
Secondary Research
Secondary research was mainly used to collect and identify information useful for the extensive, technical, market-oriented, and Friend’s study of the Global Extra Neutral Alcohol. It was also used to obtain key information about major players, market classification and segmentation according to the industry trends, geographical markets, and developments related to the market and technology perspectives. For this study, analysts have gathered information from various credible sources, such as annual reports, sec filings, journals, white papers, SOFT presentations, and company web sites.
Market Size Estimation
Both, top-down and bottom-up approaches were used to estimate and validate the size of the Global market and to estimate the size of various other dependent submarkets in the overall Extra Neutral Alcohol. The key players in the market were identified through secondary research and their market contributions in the respective geographies were determined through primary and secondary research.
Forecast Model
![research-methodology2]()