Phased Array Ultrasonic Testing (PAUT) Service Market Overview and Analysis
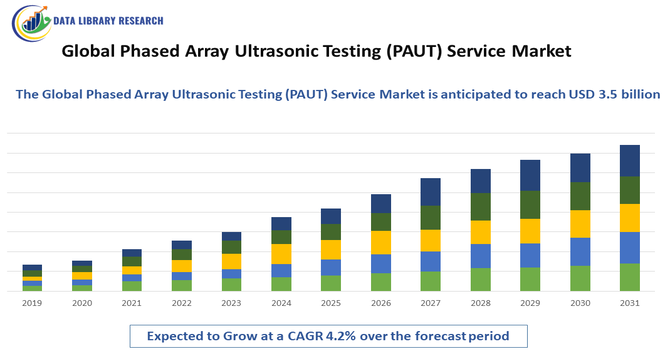
- The Global Phased Array Ultrasonic Testing (PAUT) Service Market is expected to witness robust growth from USD 1.8 billion in 2025 to USD 3.5 billion by 2032, growing with a CAGR of 4.2% from 2025-2032.
Get Complete Analysis Of The Report - Download Updated Free Sample PDF
The Global Phased Array Ultrasonic Testing (PAUT) Service Market involves advanced non-destructive testing services using phased array technology to inspect materials for defects. It offers precise, real-time imaging for industries like aerospace, oil & gas, and manufacturing, ensuring safety, quality control, and efficient maintenance across critical infrastructure worldwide.
Phased Array Ultrasonic Testing (PAUT) Service Market Latest Trends
The Global PAUT Service Market is experiencing strong growth driven by increasing demand for advanced non destructive testing across aerospace, oil & gas, automotive, and power generation sectors. PAUT’s enhanced imaging, faster inspection times, and higher defect detection accuracy are replacing conventional ultrasonic methods. Integration with digital reporting tools and automated scanning systems is improving efficiency and data analytics. Growing industrial safety regulations and the need for predictive maintenance in aging infrastructure are motivating service adoption. Additionally, portable and phased array enabled robotic inspection solutions are expanding remote and hard to reach capabilities, accelerating market penetration globally.
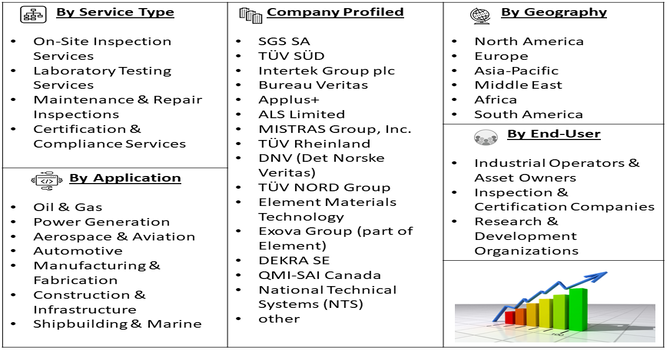
Segmentation: The Global PAUT Service Market is segmented by Service Type (On-Site Inspection Services, Laboratory Testing Services, Maintenance & Repair Inspections and Certification & Compliance Services), Application (Oil & Gas, Power Generation, Aerospace & Aviation, Automotive, Manufacturing & Fabrication, Construction & Infrastructure and Shipbuilding & Marine), Technology (Conventional PAUT Systems, Automated PAUT Systems and Handheld PAUT Devices), End Users (Industrial Operators & Asset Owners, Inspection & Certification Companies and Research & Development Organizations), and Geography (North America, Europe, Asia-Pacific, Middle East and Africa, and South America). The report provides the value (in USD million) for the above segments.
For Detailed Market Segmentation - Get a Free Sample PDF
Market Drivers:
- Growing Demand for Safety and Quality in Critical Industries
The Global PAUT Service Market is being driven by increasing safety and quality requirements in sectors like oil & gas, aerospace, power generation, and automotive. Aging infrastructure, pipelines, and aircraft components require precise inspection to prevent failures and accidents. PAUT provides high-resolution imaging, rapid defect detection, and real-time reporting, enabling predictive maintenance and regulatory compliance. Stricter government and industry safety standards, combined with the need for reliable infrastructure, are accelerating adoption. Companies are investing in PAUT services to ensure operational safety, reduce downtime, and minimize financial losses from equipment failure, further fueling market growth.
- Technological Advancements and Automation in Inspection Services
Advancements in phased array ultrasonic technology, including automated scanning, portable devices, and integration with AI and digital reporting tools, are driving market growth. Automated and robotic inspection systems enhance accuracy, efficiency, and coverage, reducing human error and inspection time. Innovations in software analytics, 3D imaging, and remote monitoring allow faster decision-making and seamless reporting. Industries increasingly prefer PAUT over conventional ultrasonic testing due to its precision, adaptability, and capability to inspect complex geometries. Continuous R&D, coupled with rising demand for non-destructive testing in manufacturing and maintenance, is expanding the adoption of PAUT services globally.
Market Restraints:
- High Initial Investment and Operational Costs
A key restraint for the PAUT service market is the high initial investment and operational costs associated with advanced phased array equipment and skilled personnel. Procurement, calibration, maintenance, and training costs are significant, particularly for small- and medium-sized enterprises. The complexity of operating sophisticated PAUT systems requires specialized technicians, increasing labor expenses. Additionally, the cost of integrating automated or robotic inspection systems with existing workflows can be prohibitive. In cost-sensitive industries, these high expenditures may slow adoption despite the technology’s advantages, limiting market penetration in certain regions and segments, and restraining overall growth.
Socioeconomic Impact on Phased Array Ultrasonic Testing (PAUT) Service Market
PAUT services significantly improve safety, quality, and reliability in critical industries, reducing the risk of catastrophic failures. By enabling early defect detection and precise material evaluation, PAUT supports cost effective maintenance strategies, lowers downtime, and extends asset life. This drives economic savings for operators and contributes to worker safety by preventing accidents. Skilled technician demand is rising, creating specialized job opportunities. Enhanced structural integrity of infrastructure like pipelines, aircraft components, and power plants also boosts public confidence. PAUT’s role in regulatory compliance and risk management promotes sustainable industrial growth, energy efficiency, and broader societal benefits through improved environmental protection.
Segmental Analysis:
- On-Site Inspection Services segment is expected to witness highest growth over the forecast period
The On-Site Inspection Services segment is expected to witness the highest growth due to the increasing need for real-time, accurate inspection of critical industrial assets. Industries such as oil & gas, power generation, and aerospace require on-site PAUT services to minimize downtime, prevent failures, and ensure compliance with safety and regulatory standards. On-site inspections enable immediate detection of material defects and corrosion without transporting equipment to a lab. Growing adoption of portable and robotic PAUT solutions enhances service efficiency. The rising focus on predictive maintenance and operational safety further drives demand for on-site phased array ultrasonic testing services globally.
- Oil & Gas segment is expected to witness highest growth over the forecast period
The Oil & Gas segment is anticipated to experience significant growth due to the sector’s reliance on pipelines, refineries, and offshore platforms that require continuous structural integrity monitoring. PAUT services detect corrosion, cracks, and welding defects in critical components, ensuring safe operations and regulatory compliance. Aging infrastructure and rising energy demand intensify the need for preventive maintenance and inspection solutions. Additionally, the sector’s emphasis on minimizing environmental and operational risks drives adoption. Technological advancements, including automated scanning and real-time reporting, further support growth in PAUT services for oil & gas applications across exploration, production, and distribution.
- Conventional PAUT Systems segment is expected to witness highest growth over the forecast period
The Conventional PAUT Systems segment is expected to witness strong growth as many industries continue to rely on established phased array ultrasonic testing equipment for routine inspections and defect detection. Conventional systems offer proven reliability, ease of use, and compatibility with standard inspection protocols. Companies prefer these systems for cost-effective, accurate evaluation of welds, pipelines, pressure vessels, and structural components. While advanced and automated solutions are emerging, conventional PAUT systems remain critical for sectors requiring high-precision inspection without extensive integration or software dependency. Their widespread acceptance and familiarity among technicians ensure steady market demand.
- Research & Development Organizations segment is expected to witness highest growth over the forecast period
The Research & Development (R&D) Organizations segment is projected to grow rapidly as these entities increasingly leverage PAUT services for materials testing, product validation, and innovation. R&D activities in aerospace, automotive, and manufacturing sectors require precise defect detection and material characterization, which PAUT enables. Universities, research institutions, and corporate R&D labs adopt PAUT for experimental setups, prototype evaluation, and development of next-generation materials and components. The rising focus on innovation, safety standards, and new material testing drives adoption. Additionally, collaboration with industrial partners for applied research expands the demand for specialized PAUT services in research and development environments.
- North America region is expected to witness highest growth over the forecast period
North America is expected to witness the highest growth over the forecast period due to advanced industrial infrastructure, high adoption of non-destructive testing technologies, and stringent safety regulations. The presence of major PAUT service providers, aerospace manufacturers, oil & gas operators, and power generation companies drives demand. Rapid technological adoption, including automated and portable PAUT systems, enhances inspection efficiency and reliability. Government and industry standards require regular inspection of critical infrastructure, further promoting PAUT service utilization. High investment in R&D, workforce expertise, and the focus on operational safety and predictive maintenance make North America a leading market for phased array ultrasonic testing services globally.
| Report Matrics |
Details |
| Market Size Value |
USD 3.5 billion |
| Growth Rate |
CAGR of 4.2 % |
| Forecast |
2026-2033 |
| Historical data |
2021-2024 |
| Base Year |
2025 |
| Report Coverage |
Forecasted revenue, company rating, competitive environment, growth drivers, and trends |
| Segment Coverage |
Type, Application, End-User, Geography |
| Regional Scope |
North America, Europe, Asia Pacific, Middle East |
| Customized scope |
Free customization of reports (With 3 months Analysis Support ) |
| To Learn More About This Report |
Request a Free Sample Copy |
Phased Array Ultrasonic Testing (PAUT) Service Market Competitive Landscape
The competitive landscape of the Global PAUT Service Market includes specialized non destructive testing firms, large engineering service providers, and inspection technology companies. Key players differentiate by offering advanced PAUT capabilities, such as high resolution imaging, automated scanning, and integrated reporting software. Service providers focus on expanding geographic reach, industry specific expertise, and strategic partnerships with manufacturers and asset owners. Innovation in phased array hardware, software enhancements, and portable solutions strengthens value propositions. Companies also invest in training certification programs to ensure skilled workforce availability. Competitive dynamics are shaped by quality, turnaround time, technological integration, and compliance with international inspection standards, driving continuous improvement.
The major players for this market are:
- SGS SA
- TÜV SÜD
- Intertek Group plc
- Bureau Veritas
- Applus+
- ALS Limited
- MISTRAS Group, Inc.
- TÜV Rheinland
- DNV (Det Norske Veritas)
- TÜV NORD Group
- Element Materials Technology
- Exova Group (part of Element)
- DEKRA SE
- QMI-SAI Canada
- National Technical Systems (NTS)
- Acuren Group, Inc.
- RINA S.p.A.
- Nippon Kaiji Kyokai (ClassNK)
- SGS India
- ASSURANT Test Services Pvt. Ltd.
Recent Development
- In January 2025, Mitsubishi Heavy Industries Compressor International Corporation (MCO-I) integrated PAUT into steam turbine maintenance, enabling precise detection of micro-cracks in rotors. This adoption enhanced real-time monitoring, optimized maintenance schedules, and improved turbine efficiency and safety, significantly driving the growth and adoption of the Global Phased Array Ultrasonic Testing (PAUT) Service Market.
- In May 2023, Eddyfi Technologies launched the Panther 2, a next-generation PAUT and TFM inspection solution, enabling faster, more versatile industrial inspections across manufacturing, laboratories, and field environments. Its advanced speed, accuracy, and durability enhanced non-destructive testing capabilities, significantly boosting the adoption and growth of the Global Phased Array Ultrasonic Testing (PAUT) Service Market.
Frequently Asked Questions (FAQ) :
Q1. What are the main growth-driving factors for this market?
Stricter government regulations for infrastructure and pipeline safety mandate advanced non-destructive testing (NDT) methods like PAUT. The technique's superiority in speed and accuracy for detecting flaws in critical assets, especially in oil & gas and power generation, drives its increasing adoption over traditional inspection methods.
Q2. What are the main restraining factors for this market?
The primary constraint is the high initial cost of PAUT equipment and the need for specialized, highly trained technicians. Furthermore, complex geometry of certain components can sometimes restrict accurate sound beam focusing, requiring customized solutions that increase service time and expense.
Q3. Which segment is expected to witness high growth?
The Oil & Gas sector is expected to witness the highest growth. This is due to the massive need for integrity management of aging pipelines, refineries, and offshore platforms. PAUT is crucial for inspecting welds and detecting corrosion, minimizing catastrophic failures and ensuring operational continuity in this critical infrastructure.
Q4. Who are the top major players for this market?
Leading the PAUT service market are established global industrial inspection firms. Key players include Mistras Group, Applus+, and SGS S.A. These companies provide comprehensive NDT services and possess the skilled personnel and sophisticated PAUT equipment required for complex industrial projects worldwide.
Q5. Which country is the largest player?
The United States (US) holds the position as the largest market player. This is attributed to the presence of extensive, aging oil and gas infrastructure, high-value manufacturing industries (aerospace), and strict federal safety regulations that necessitate frequent, advanced inspections to maintain asset integrity and regulatory compliance.
List of Figures
Figure 1: Global Phased Array Ultrasonic Testing (PAUT) Service Market Revenue Breakdown (USD Billion, %) by Region, 2022 & 2029
Figure 2: Global Phased Array Ultrasonic Testing (PAUT) Service Market Value Share (%), By Segment 1, 2022 & 2029
Figure 3: Global Phased Array Ultrasonic Testing (PAUT) Service Market Forecast (USD Billion), by Sub-Segment 1, 2018-2029
Figure 4: Global Phased Array Ultrasonic Testing (PAUT) Service Market Forecast (USD Billion), by Sub-Segment 2, 2018-2029
Figure 5: Global Phased Array Ultrasonic Testing (PAUT) Service Market Value Share (%), By Segment 2, 2022 & 2029
Figure 6: Global Phased Array Ultrasonic Testing (PAUT) Service Market Forecast (USD Billion), by Sub-Segment 1, 2018-2029
Figure 7: Global Phased Array Ultrasonic Testing (PAUT) Service Market Forecast (USD Billion), by Sub-Segment 2, 2018-2029
Figure 8: Global Phased Array Ultrasonic Testing (PAUT) Service Market Forecast (USD Billion), by Sub-Segment 3, 2018-2029
Figure 9: Global Phased Array Ultrasonic Testing (PAUT) Service Market Forecast (USD Billion), by Others, 2018-2029
Figure 10: Global Phased Array Ultrasonic Testing (PAUT) Service Market Value Share (%), By Segment 3, 2022 & 2029
Figure 11: Global Phased Array Ultrasonic Testing (PAUT) Service Market Forecast (USD Billion), by Sub-Segment 1, 2018-2029
Figure 12: Global Phased Array Ultrasonic Testing (PAUT) Service Market Forecast (USD Billion), by Sub-Segment 2, 2018-2029
Figure 13: Global Phased Array Ultrasonic Testing (PAUT) Service Market Forecast (USD Billion), by Sub-Segment 3, 2018-2029
Figure 14: Global Phased Array Ultrasonic Testing (PAUT) Service Market Forecast (USD Billion), by Others, 2018-2029
Figure 15: Global Phased Array Ultrasonic Testing (PAUT) Service Market Value (USD Billion), by Region, 2022 & 2029
Figure 16: North America Phased Array Ultrasonic Testing (PAUT) Service Market Value Share (%), By Segment 1, 2022 & 2029
Figure 17: North America Phased Array Ultrasonic Testing (PAUT) Service Market Forecast (USD Billion), by Sub-Segment 1, 2018-2029
Figure 18: North America Phased Array Ultrasonic Testing (PAUT) Service Market Forecast (USD Billion), by Sub-Segment 2, 2018-2029
Figure 19: North America Phased Array Ultrasonic Testing (PAUT) Service Market Value Share (%), By Segment 2, 2022 & 2029
Figure 20: North America Phased Array Ultrasonic Testing (PAUT) Service Market Forecast (USD Billion), by Sub-Segment 1, 2018-2029
Figure 21: North America Phased Array Ultrasonic Testing (PAUT) Service Market Forecast (USD Billion), by Sub-Segment 2, 2018-2029
Figure 22: North America Phased Array Ultrasonic Testing (PAUT) Service Market Forecast (USD Billion), by Sub-Segment 3, 2018-2029
Figure 23: North America Phased Array Ultrasonic Testing (PAUT) Service Market Forecast (USD Billion), by Others, 2018-2029
Figure 24: North America Phased Array Ultrasonic Testing (PAUT) Service Market Value Share (%), By Segment 3, 2022 & 2029
Figure 25: North America Phased Array Ultrasonic Testing (PAUT) Service Market Forecast (USD Billion), by Sub-Segment 1, 2018-2029
Figure 26: North America Phased Array Ultrasonic Testing (PAUT) Service Market Forecast (USD Billion), by Sub-Segment 2, 2018-2029
Figure 27: North America Phased Array Ultrasonic Testing (PAUT) Service Market Forecast (USD Billion), by Sub-Segment 3, 2018-2029
Figure 28: North America Phased Array Ultrasonic Testing (PAUT) Service Market Forecast (USD Billion), by Others, 2018-2029
Figure 29: North America Phased Array Ultrasonic Testing (PAUT) Service Market Forecast (USD Billion), by U.S., 2018-2029
Figure 30: North America Phased Array Ultrasonic Testing (PAUT) Service Market Forecast (USD Billion), by Canada, 2018-2029
Figure 31: Latin America Phased Array Ultrasonic Testing (PAUT) Service Market Value Share (%), By Segment 1, 2022 & 2029
Figure 32: Latin America Phased Array Ultrasonic Testing (PAUT) Service Market Forecast (USD Billion), by Sub-Segment 1, 2018-2029
Figure 33: Latin America Phased Array Ultrasonic Testing (PAUT) Service Market Forecast (USD Billion), by Sub-Segment 2, 2018-2029
Figure 34: Latin America Phased Array Ultrasonic Testing (PAUT) Service Market Value Share (%), By Segment 2, 2022 & 2029
Figure 35: Latin America Phased Array Ultrasonic Testing (PAUT) Service Market Forecast (USD Billion), by Sub-Segment 1, 2018-2029
Figure 36: Latin America Phased Array Ultrasonic Testing (PAUT) Service Market Forecast (USD Billion), by Sub-Segment 2, 2018-2029
Figure 37: Latin America Phased Array Ultrasonic Testing (PAUT) Service Market Forecast (USD Billion), by Sub-Segment 3, 2018-2029
Figure 38: Latin America Phased Array Ultrasonic Testing (PAUT) Service Market Forecast (USD Billion), by Others, 2018-2029
Figure 39: Latin America Phased Array Ultrasonic Testing (PAUT) Service Market Value Share (%), By Segment 3, 2022 & 2029
Figure 40: Latin America Phased Array Ultrasonic Testing (PAUT) Service Market Forecast (USD Billion), by Sub-Segment 1, 2018-2029
Figure 41: Latin America Phased Array Ultrasonic Testing (PAUT) Service Market Forecast (USD Billion), by Sub-Segment 2, 2018-2029
Figure 42: Latin America Phased Array Ultrasonic Testing (PAUT) Service Market Forecast (USD Billion), by Sub-Segment 3, 2018-2029
Figure 43: Latin America Phased Array Ultrasonic Testing (PAUT) Service Market Forecast (USD Billion), by Others, 2018-2029
Figure 44: Latin America Phased Array Ultrasonic Testing (PAUT) Service Market Forecast (USD Billion), by Brazil, 2018-2029
Figure 45: Latin America Phased Array Ultrasonic Testing (PAUT) Service Market Forecast (USD Billion), by Mexico, 2018-2029
Figure 46: Latin America Phased Array Ultrasonic Testing (PAUT) Service Market Forecast (USD Billion), by Rest of Latin America, 2018-2029
Figure 47: Europe Phased Array Ultrasonic Testing (PAUT) Service Market Value Share (%), By Segment 1, 2022 & 2029
Figure 48: Europe Phased Array Ultrasonic Testing (PAUT) Service Market Forecast (USD Billion), by Sub-Segment 1, 2018-2029
Figure 49: Europe Phased Array Ultrasonic Testing (PAUT) Service Market Forecast (USD Billion), by Sub-Segment 2, 2018-2029
Figure 50: Europe Phased Array Ultrasonic Testing (PAUT) Service Market Value Share (%), By Segment 2, 2022 & 2029
Figure 51: Europe Phased Array Ultrasonic Testing (PAUT) Service Market Forecast (USD Billion), by Sub-Segment 1, 2018-2029
Figure 52: Europe Phased Array Ultrasonic Testing (PAUT) Service Market Forecast (USD Billion), by Sub-Segment 2, 2018-2029
Figure 53: Europe Phased Array Ultrasonic Testing (PAUT) Service Market Forecast (USD Billion), by Sub-Segment 3, 2018-2029
Figure 54: Europe Phased Array Ultrasonic Testing (PAUT) Service Market Forecast (USD Billion), by Others, 2018-2029
Figure 55: Europe Phased Array Ultrasonic Testing (PAUT) Service Market Value Share (%), By Segment 3, 2022 & 2029
Figure 56: Europe Phased Array Ultrasonic Testing (PAUT) Service Market Forecast (USD Billion), by Sub-Segment 1, 2018-2029
Figure 57: Europe Phased Array Ultrasonic Testing (PAUT) Service Market Forecast (USD Billion), by Sub-Segment 2, 2018-2029
Figure 58: Europe Phased Array Ultrasonic Testing (PAUT) Service Market Forecast (USD Billion), by Sub-Segment 3, 2018-2029
Figure 59: Europe Phased Array Ultrasonic Testing (PAUT) Service Market Forecast (USD Billion), by Others, 2018-2029
Figure 60: Europe Phased Array Ultrasonic Testing (PAUT) Service Market Forecast (USD Billion), by U.K., 2018-2029
Figure 61: Europe Phased Array Ultrasonic Testing (PAUT) Service Market Forecast (USD Billion), by Germany, 2018-2029
Figure 62: Europe Phased Array Ultrasonic Testing (PAUT) Service Market Forecast (USD Billion), by France, 2018-2029
Figure 63: Europe Phased Array Ultrasonic Testing (PAUT) Service Market Forecast (USD Billion), by Italy, 2018-2029
Figure 64: Europe Phased Array Ultrasonic Testing (PAUT) Service Market Forecast (USD Billion), by Spain, 2018-2029
Figure 65: Europe Phased Array Ultrasonic Testing (PAUT) Service Market Forecast (USD Billion), by Russia, 2018-2029
Figure 66: Europe Phased Array Ultrasonic Testing (PAUT) Service Market Forecast (USD Billion), by Rest of Europe, 2018-2029
Figure 67: Asia Pacific Phased Array Ultrasonic Testing (PAUT) Service Market Value Share (%), By Segment 1, 2022 & 2029
Figure 68: Asia Pacific Phased Array Ultrasonic Testing (PAUT) Service Market Forecast (USD Billion), by Sub-Segment 1, 2018-2029
Figure 69: Asia Pacific Phased Array Ultrasonic Testing (PAUT) Service Market Forecast (USD Billion), by Sub-Segment 2, 2018-2029
Figure 70: Asia Pacific Phased Array Ultrasonic Testing (PAUT) Service Market Value Share (%), By Segment 2, 2022 & 2029
Figure 71: Asia Pacific Phased Array Ultrasonic Testing (PAUT) Service Market Forecast (USD Billion), by Sub-Segment 1, 2018-2029
Figure 72: Asia Pacific Phased Array Ultrasonic Testing (PAUT) Service Market Forecast (USD Billion), by Sub-Segment 2, 2018-2029
Figure 73: Asia Pacific Phased Array Ultrasonic Testing (PAUT) Service Market Forecast (USD Billion), by Sub-Segment 3, 2018-2029
Figure 74: Asia Pacific Phased Array Ultrasonic Testing (PAUT) Service Market Forecast (USD Billion), by Others, 2018-2029
Figure 75: Asia Pacific Phased Array Ultrasonic Testing (PAUT) Service Market Value Share (%), By Segment 3, 2022 & 2029
Figure 76: Asia Pacific Phased Array Ultrasonic Testing (PAUT) Service Market Forecast (USD Billion), by Sub-Segment 1, 2018-2029
Figure 77: Asia Pacific Phased Array Ultrasonic Testing (PAUT) Service Market Forecast (USD Billion), by Sub-Segment 2, 2018-2029
Figure 78: Asia Pacific Phased Array Ultrasonic Testing (PAUT) Service Market Forecast (USD Billion), by Sub-Segment 3, 2018-2029
Figure 79: Asia Pacific Phased Array Ultrasonic Testing (PAUT) Service Market Forecast (USD Billion), by Others, 2018-2029
Figure 80: Asia Pacific Phased Array Ultrasonic Testing (PAUT) Service Market Forecast (USD Billion), by China, 2018-2029
Figure 81: Asia Pacific Phased Array Ultrasonic Testing (PAUT) Service Market Forecast (USD Billion), by India, 2018-2029
Figure 82: Asia Pacific Phased Array Ultrasonic Testing (PAUT) Service Market Forecast (USD Billion), by Japan, 2018-2029
Figure 83: Asia Pacific Phased Array Ultrasonic Testing (PAUT) Service Market Forecast (USD Billion), by Australia, 2018-2029
Figure 84: Asia Pacific Phased Array Ultrasonic Testing (PAUT) Service Market Forecast (USD Billion), by Southeast Asia, 2018-2029
Figure 85: Asia Pacific Phased Array Ultrasonic Testing (PAUT) Service Market Forecast (USD Billion), by Rest of Asia Pacific, 2018-2029
Figure 86: Middle East & Africa Phased Array Ultrasonic Testing (PAUT) Service Market Value Share (%), By Segment 1, 2022 & 2029
Figure 87: Middle East & Africa Phased Array Ultrasonic Testing (PAUT) Service Market Forecast (USD Billion), by Sub-Segment 1, 2018-2029
Figure 88: Middle East & Africa Phased Array Ultrasonic Testing (PAUT) Service Market Forecast (USD Billion), by Sub-Segment 2, 2018-2029
Figure 89: Middle East & Africa Phased Array Ultrasonic Testing (PAUT) Service Market Value Share (%), By Segment 2, 2022 & 2029
Figure 90: Middle East & Africa Phased Array Ultrasonic Testing (PAUT) Service Market Forecast (USD Billion), by Sub-Segment 1, 2018-2029
Figure 91: Middle East & Africa Phased Array Ultrasonic Testing (PAUT) Service Market Forecast (USD Billion), by Sub-Segment 2, 2018-2029
Figure 92: Middle East & Africa Phased Array Ultrasonic Testing (PAUT) Service Market Forecast (USD Billion), by Sub-Segment 3, 2018-2029
Figure 93: Middle East & Africa Phased Array Ultrasonic Testing (PAUT) Service Market Forecast (USD Billion), by Others, 2018-2029
Figure 94: Middle East & Africa Phased Array Ultrasonic Testing (PAUT) Service Market Value Share (%), By Segment 3, 2022 & 2029
Figure 95: Middle East & Africa Phased Array Ultrasonic Testing (PAUT) Service Market Forecast (USD Billion), by Sub-Segment 1, 2018-2029
Figure 96: Middle East & Africa Phased Array Ultrasonic Testing (PAUT) Service Market Forecast (USD Billion), by Sub-Segment 2, 2018-2029
Figure 97: Middle East & Africa Phased Array Ultrasonic Testing (PAUT) Service Market Forecast (USD Billion), by Sub-Segment 3, 2018-2029
Figure 98: Middle East & Africa Phased Array Ultrasonic Testing (PAUT) Service Market Forecast (USD Billion), by Others, 2018-2029
Figure 99: Middle East & Africa Phased Array Ultrasonic Testing (PAUT) Service Market Forecast (USD Billion), by GCC, 2018-2029
Figure 100: Middle East & Africa Phased Array Ultrasonic Testing (PAUT) Service Market Forecast (USD Billion), by South Africa, 2018-2029
Figure 101: Middle East & Africa Phased Array Ultrasonic Testing (PAUT) Service Market Forecast (USD Billion), by Rest of Middle East & Africa, 2018-2029
List of Tables
Table 1: Global Phased Array Ultrasonic Testing (PAUT) Service Market Revenue (USD Billion) Forecast, by Segment 1, 2018-2029
Table 2: Global Phased Array Ultrasonic Testing (PAUT) Service Market Revenue (USD Billion) Forecast, by Segment 2, 2018-2029
Table 3: Global Phased Array Ultrasonic Testing (PAUT) Service Market Revenue (USD Billion) Forecast, by Segment 3, 2018-2029
Table 4: Global Phased Array Ultrasonic Testing (PAUT) Service Market Revenue (USD Billion) Forecast, by Region, 2018-2029
Table 5: North America Phased Array Ultrasonic Testing (PAUT) Service Market Revenue (USD Billion) Forecast, by Segment 1, 2018-2029
Table 6: North America Phased Array Ultrasonic Testing (PAUT) Service Market Revenue (USD Billion) Forecast, by Segment 2, 2018-2029
Table 7: North America Phased Array Ultrasonic Testing (PAUT) Service Market Revenue (USD Billion) Forecast, by Segment 3, 2018-2029
Table 8: North America Phased Array Ultrasonic Testing (PAUT) Service Market Revenue (USD Billion) Forecast, by Country, 2018-2029
Table 9: Europe Phased Array Ultrasonic Testing (PAUT) Service Market Revenue (USD Billion) Forecast, by Segment 1, 2018-2029
Table 10: Europe Phased Array Ultrasonic Testing (PAUT) Service Market Revenue (USD Billion) Forecast, by Segment 2, 2018-2029
Table 11: Europe Phased Array Ultrasonic Testing (PAUT) Service Market Revenue (USD Billion) Forecast, by Segment 3, 2018-2029
Table 12: Europe Phased Array Ultrasonic Testing (PAUT) Service Market Revenue (USD Billion) Forecast, by Country, 2018-2029
Table 13: Latin America Phased Array Ultrasonic Testing (PAUT) Service Market Revenue (USD Billion) Forecast, by Segment 1, 2018-2029
Table 14: Latin America Phased Array Ultrasonic Testing (PAUT) Service Market Revenue (USD Billion) Forecast, by Segment 2, 2018-2029
Table 15: Latin America Phased Array Ultrasonic Testing (PAUT) Service Market Revenue (USD Billion) Forecast, by Segment 3, 2018-2029
Table 16: Latin America Phased Array Ultrasonic Testing (PAUT) Service Market Revenue (USD Billion) Forecast, by Country, 2018-2029
Table 17: Asia Pacific Phased Array Ultrasonic Testing (PAUT) Service Market Revenue (USD Billion) Forecast, by Segment 1, 2018-2029
Table 18: Asia Pacific Phased Array Ultrasonic Testing (PAUT) Service Market Revenue (USD Billion) Forecast, by Segment 2, 2018-2029
Table 19: Asia Pacific Phased Array Ultrasonic Testing (PAUT) Service Market Revenue (USD Billion) Forecast, by Segment 3, 2018-2029
Table 20: Asia Pacific Phased Array Ultrasonic Testing (PAUT) Service Market Revenue (USD Billion) Forecast, by Country, 2018-2029
Table 21: Middle East & Africa Phased Array Ultrasonic Testing (PAUT) Service Market Revenue (USD Billion) Forecast, by Segment 1, 2018-2029
Table 22: Middle East & Africa Phased Array Ultrasonic Testing (PAUT) Service Market Revenue (USD Billion) Forecast, by Segment 2, 2018-2029
Table 23: Middle East & Africa Phased Array Ultrasonic Testing (PAUT) Service Market Revenue (USD Billion) Forecast, by Segment 3, 2018-2029
Table 24: Middle East & Africa Phased Array Ultrasonic Testing (PAUT) Service Market Revenue (USD Billion) Forecast, by Country, 2018-2029
Research Process
Data Library Research are conducted by industry experts who offer insight on
industry structure, market segmentations technology assessment and competitive landscape (CL), and penetration, as well as on emerging trends. Their analysis is based on primary interviews (~ 80%) and secondary research (~ 20%) as well as years of professional expertise in their respective industries. Adding to this, by analysing historical trends and current market positions, our analysts predict where the market will be headed for the next five years. Furthermore, the varying trends of segment & categories geographically presented are also studied and the estimated based on the primary & secondary research.
In this particular report from the supply side Data Library Research has conducted primary surveys (interviews) with the key level executives (VP, CEO’s, Marketing Director, Business Development Manager
and SOFT) of the companies that active & prominent as well as the midsized organization
FIGURE 1: DLR RESEARH PROCESS
![research-methodology1]()
Primary Research
Extensive primary research was conducted to gain a deeper insight of the market and industry performance. The analysis is based on both primary and secondary research as well as years of professional expertise in the respective industries.
In addition to analysing current and historical trends, our analysts predict where the market is headed over the next five years.
It varies by segment for these categories geographically presented in the list of market tables. Speaking about this particular report we have conducted primary surveys (interviews) with the key level executives (VP, CEO’s, Marketing Director, Business Development Manager and many more) of the major players active in the market.
Secondary Research
Secondary research was mainly used to collect and identify information useful for the extensive, technical, market-oriented, and Friend’s study of the Global Extra Neutral Alcohol. It was also used to obtain key information about major players, market classification and segmentation according to the industry trends, geographical markets, and developments related to the market and technology perspectives. For this study, analysts have gathered information from various credible sources, such as annual reports, sec filings, journals, white papers, SOFT presentations, and company web sites.
Market Size Estimation
Both, top-down and bottom-up approaches were used to estimate and validate the size of the Global market and to estimate the size of various other dependent submarkets in the overall Extra Neutral Alcohol. The key players in the market were identified through secondary research and their market contributions in the respective geographies were determined through primary and secondary research.
Forecast Model
![research-methodology2]()