Physiological Health Monitoring Sensors Market Overview and Analysis
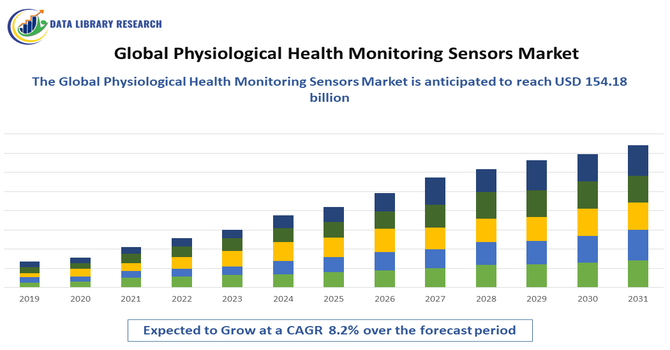
- The Global Physiological Health Monitoring Sensors Market size was estimated at USD 40.28 billion in 2025 and is projected to reach USD 154.18 billion by 2032, growing at a CAGR of 8.2% from 2025-2032.
Get Complete Analysis Of The Report - Download Updated Free Sample PDF
The Global Physiological Health Monitoring Sensors Market encompasses devices that continuously track vital signs and physiological parameters, such as heart rate, blood pressure, and respiratory rate. These sensors are used in healthcare and wellness applications to enable real-time monitoring, early disease detection, and personalized health management.
Key drivers of this growth include the widespread adoption of wearable devices such as smartwatches, fitness trackers, and continuous glucose monitors (CGMs), which enable real-time monitoring of vital signs like heart rate, blood oxygen levels, and glucose concentrations. The increasing prevalence of lifestyle-related conditions such as hypertension and diabetes further propels the demand for continuous health monitoring solutions.
Physiological Health Monitoring Sensors Market Latest Trends
The global physiological health monitoring sensors market is witnessing significant advancements driven by the integration of Artificial Intelligence (AI) and Machine Learning (ML), which enable real-time data analysis, predictive insights, and personalized care. Innovations are expanding beyond traditional wearables, with devices like Apple’s AirPods Pro 3 incorporating heart-rate sensors and workout tracking. There is a growing focus on chronic disease management through sensors monitoring glucose and blood pressure. Additionally, flexible, miniaturized sensors enhance comfort and continuous use, while integration with the Internet of Medical Things (IoMT) facilitates seamless data sharing and more efficient remote patient monitoring.
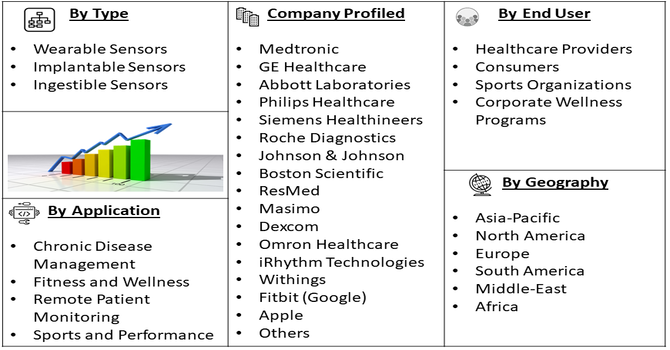
Segmentation: Global Physiological Health Monitoring Sensors Market is segmented Product Type (Wearable Sensors, Implantable Sensors, and Ingestible Sensors), Sensor Type (Optical Sensors, Accelerometers, Temperature Sensors, and Electrochemical Sensors), Application (Chronic Disease Management, Fitness and Wellness, Remote Patient Monitoring, Sports and Performance), End-User (Healthcare Providers, Consumers, Sports Organizations, and Corporate Wellness Programs), and Geography (North America, Europe, Asia-Pacific, Middle East and Africa, and South America). The report provides the value (in USD million) for the above segments.
For Detailed Market Segmentation - Get a Free Sample PDF
Market Drivers:
- Rising Consumer Health Awareness and Adoption of Wearable Devices
Increasing awareness about personal health and wellness is driving the demand for wearable health monitoring sensors. Consumers are actively seeking real-time insights into vital signs such as heart rate, blood oxygen levels, and glucose levels, which wearable devices and sensors provide. The popularity of smartwatches, fitness trackers, and continuous glucose monitors (CGMs) is significantly boosting market growth. Consumer wearables offer individuals personalized health insights, supporting self-diagnosis and promoting behavior change for improved well-being. However, concerns remain around their safety, reliability, and data security, especially when used in clinical settings. As these technologies evolve, healthcare professionals and researchers must evaluate their broader implications on care delivery. Rising consumer health awareness and the growing adoption of wearable devices are fueling demand in the global physiological health monitoring sensors market, driving innovation while highlighting the need for robust standards and integration into formal healthcare systems.
- Advancements in Sensor Technology and Miniaturization
Technological innovations in optical, electrochemical, and flexible sensors have improved the accuracy, reliability, and comfort of physiological monitoring devices. Miniaturized and flexible sensors can now be seamlessly integrated into everyday wearable devices, enabling continuous monitoring without compromising user convenience, which is accelerating adoption across healthcare, sports, and wellness sectors.
In August 2025, Abbott launched FreeStyle Libre 2 Plus sensor, the latest in its glucose monitoring portfolio. This advanced device delivers automatic, real-time glucose readings every minute directly to a user’s smartphone, eliminating the need for manual scans. Users receive instant alerts for high or low glucose levels, enabling proactive diabetes management with greater convenience and accuracy. This innovation reflects growing consumer demand for seamless, real-time health tracking and contributes to rising adoption of wearable devices. It also highlights significant advancements in sensor technology and miniaturization, making continuous monitoring more accessible and user-friendly
Market Restraints:
- High Costs Associated with Advanced Wearable and Implantable Sensors
High costs associated with advanced wearable and implantable sensors remain a significant barrier, particularly for consumers in developing regions and smaller healthcare providers. Data privacy and security concerns are another major challenge, as continuous monitoring generates large volumes of sensitive personal health data that require robust protection against breaches and unauthorized access. Additionally, the lack of standardized regulations and interoperability between devices can hinder seamless integration into healthcare systems, limiting the effectiveness of remote monitoring and personalized healthcare solutions. These factors collectively pose challenges to widespread adoption, despite the strong technological advancements and growing demand for health monitoring devices.
Socio Economic Impact on Physiological Health Monitoring Sensors Market
The global Physiological Health Monitoring Sensors Market creates a profound socio-economic impact by driving a paradigm shift from reactive to proactive healthcare. Economically, the market generates substantial value by enabling Remote Patient Monitoring (RPM), which is vital for the aging population and chronic disease management, significantly reducing expensive hospital readmissions and overall healthcare expenditure. Socially, these sensors—including wearables and implantables—enhance the quality of life for millions by facilitating continuous, non-invasive health tracking, leading to earlier disease detection, personalized treatment, and empowered self-management of conditions like diabetes and cardiovascular disease. This market's growth, therefore, not only fuels a lucrative tech-driven industry but also serves as a crucial public health strategy to contain rising costs and extend healthy, independent living.
Segmental Analysis:
- Wearable Sensors segment is expected to witness highest growth over the forecast period
Wearable sensors are the most widely adopted segment, embedded in devices such as smartwatches, wristbands, headbands, and clothing. They continuously monitor physiological parameters like heart rate, blood oxygen levels, body temperature, and physical activity. The non-invasive nature, ease of use, and integration with smartphones and health apps make wearable sensors highly popular among consumers for both personal health tracking and clinical applications.
- Optical Sensors segment is expected to witness highest growth over the forecast period
Optical sensors, particularly photoplethysmography (PPG) sensors, are widely used in wearable devices for non-invasive monitoring of cardiovascular health metrics such as heart rate, blood oxygen saturation, and stress levels. PPG sensors leverage light absorption changes in the skin to provide accurate and continuous readings, making them essential for real-time health monitoring applications.
Chronic Disease Management segment is expected to witness highest growth over the forecast period@@@@ Chronic disease management is a critical application segment, where physiological health monitoring sensors help track conditions such as diabetes, hypertension, and cardiovascular diseases. Continuous monitoring allows patients and healthcare providers to detect early warning signs, adjust treatments promptly, and reduce hospitalizations, improving patient outcomes and overall healthcare efficiency.
- Healthcare Providers segment is expected to witness highest growth over the forecast period
Hospitals, clinics, and other healthcare facilities are major end-users of health monitoring sensors. These providers use sensors to monitor patient vitals in real-time, support telemedicine initiatives, and manage patients with chronic conditions outside traditional hospital settings. Integration of these sensors into clinical workflows improves diagnostic accuracy and patient care efficiency.
- North America region is expected to witness highest growth over the forecast period
The North America region is expected to witness the highest growth in the Global Physiological Health Monitoring Sensors market over the forecast period. This growth is driven by the widespread adoption of wearable devices and advanced health monitoring technologies, coupled with increasing awareness about preventive healthcare and chronic disease management. The region benefits from a strong healthcare infrastructure, high consumer spending on wellness products, and the presence of leading sensor and wearable device manufacturers. Supportive regulatory frameworks and rapid technological advancements in optical, electrochemical, and flexible sensors further fuel market expansion. Additionally, North America’s robust research and development ecosystem and early adoption of innovative health monitoring solutions position it as the fastest-growing and most lucrative market in the global landscape.
| Report Matrics |
Details |
| Market Size Value |
USD 154.18 billion |
| Growth Rate |
CAGR of 8.2% |
| Forecast |
2026-2033 |
| Historical data |
2021-2024 |
| Base Year |
2025 |
| Report Coverage |
Forecasted revenue, company rating, competitive environment, growth drivers, and trends |
| Segment Coverage |
Type, Application, End-User, Geography |
| Regional Scope |
North America, Europe, Asia Pacific, Middle East |
| Customized scope |
Free customization of reports (With 3 months Analysis Support ) |
| To Learn More About This Report |
Request a Free Sample Copy |
Physiological Health Monitoring Sensors Market Competitive Landscape
The Global Physiological Health Monitoring Sensors Market is characterized by a competitive landscape featuring a diverse array of companies spanning established medical device manufacturers, technology firms, and innovative startups. These entities are actively engaged in the development of advanced sensors and wearable devices aimed at enhancing health monitoring capabilities.
Key Companies in the Market:
- Medtronic
- GE Healthcare
- Abbott Laboratories
- Philips Healthcare
- Siemens Healthineers
- Roche Diagnostics
- Johnson & Johnson
- Boston Scientific
- ResMed
- Masimo
- Dexcom
- Omron Healthcare
- iRhythm Technologies
- BioTelemetry (now part of Philips)
- Withings
- Fitbit (Google)
- Apple
- Garmin
- Huawei Health / Huawei Technologies
- Xiaomi (Huami / Amazfit)
Recent Development
- In June 2025, Fujitsu Limited announced the release of its Millimeter-Wave Monitoring System in Japa. The system utilized proprietary AI to monitor human movement and subtle body vibrations, such as breathing and muscle activity, enabling automatic anomaly detection without compromising privacy. It operated effectively in low-light settings and supported continuous monitoring during low-staff hours, making it ideal for sensitive locations like care facilities. This innovation enhanced the global physiological health monitoring sensors market by introducing advanced, privacy-focused, and non-invasive monitoring technology.
- In December 2024, Nokia launched a research initiative with Fraunhofer Heinrich Hertz Institute (HHI) and Charité – Universitätsmedizin Berlin to explore wireless sensing technologies for medical use. The team investigated how sub-terahertz (sub-THz) frequencies could remotely detect human vital signs with high accuracy, leveraging the unique properties of sub-THz waves. Their work focused on developing sensing networks capable of high-resolution spatial scans in hospitals to monitor patients’ vital signs. This research advanced the global physiological health monitoring sensors market by paving the way for more precise, non-invasive monitoring solutions.
Frequently Asked Questions (FAQ) :
Q1. What the main growth driving factors for this market?
The global physiological health monitoring sensors market is primarily driven by the increasing prevalence of chronic diseases such as cardiovascular disorders, diabetes, and respiratory conditions, necessitating continuous monitoring solutions. Technological advancements in sensor accuracy, wireless connectivity, and AI integration have enhanced the usability and affordability of these devices. Additionally, the rising geriatric population, more susceptible to chronic conditions, further expands the user base for physiological monitoring devices. These factors collectively contribute to the market's growth.
Q2. What are the main restraining factors for this market?
Despite the market's growth, several challenges hinder its expansion. The high cost of advanced physiological monitoring devices limits accessibility, particularly in low-income and developing regions. Stringent regulatory requirements, such as FDA approvals and ISO certifications, can delay product launches and increase costs. Additionally, data privacy concerns and the complexity of integrating new devices into existing healthcare systems pose significant barriers to widespread adoption
Q3. Which segment is expected to witness high growth?
The wearable physiological sensors segment is expected to witness significant growth, driven by advancements in sensor technology and increasing consumer demand for health-tracking devices. Fitness and wellness sensors currently dominate the market, but medical-grade sensors are projected to experience the fastest growth due to the rising demand for accurate and reliable health monitoring solutions. This trend reflects a shift towards preventive healthcare and personalized medicine.
Q4. Who are the top major players for this market?
Key players in the global physiological health monitoring sensors market include companies like Omron Corporation, Abbott Laboratories, Medtronic, Philips Healthcare, and GE Healthcare. These companies are at the forefront of developing innovative monitoring solutions, leveraging advancements in sensor technology and AI integration to enhance the accuracy and usability of their products. Their strong market presence and continuous product development efforts contribute significantly to the market's expansion.
Q5. Which country is the largest player?
The United States stands as the largest player in the global physiological health monitoring sensors market, accounting for a significant share. Factors contributing to this dominance include advanced healthcare infrastructure, high per-capita health spending, and widespread adoption of remote patient monitoring (RPM) technologies. The U.S. also benefits from favorable reimbursement policies and a robust ecosystem supporting the development and deployment of health monitoring devices
List of Figures
Figure 1: Global Physiological Health Monitoring Sensors Market Revenue Breakdown (USD Billion, %) by Region, 2022 & 2029
Figure 2: Global Physiological Health Monitoring Sensors Market Value Share (%), By Segment 1, 2022 & 2029
Figure 3: Global Physiological Health Monitoring Sensors Market Forecast (USD Billion), by Sub-Segment 1, 2018-2029
Figure 4: Global Physiological Health Monitoring Sensors Market Forecast (USD Billion), by Sub-Segment 2, 2018-2029
Figure 5: Global Physiological Health Monitoring Sensors Market Value Share (%), By Segment 2, 2022 & 2029
Figure 6: Global Physiological Health Monitoring Sensors Market Forecast (USD Billion), by Sub-Segment 1, 2018-2029
Figure 7: Global Physiological Health Monitoring Sensors Market Forecast (USD Billion), by Sub-Segment 2, 2018-2029
Figure 8: Global Physiological Health Monitoring Sensors Market Forecast (USD Billion), by Sub-Segment 3, 2018-2029
Figure 9: Global Physiological Health Monitoring Sensors Market Forecast (USD Billion), by Others, 2018-2029
Figure 10: Global Physiological Health Monitoring Sensors Market Value Share (%), By Segment 3, 2022 & 2029
Figure 11: Global Physiological Health Monitoring Sensors Market Forecast (USD Billion), by Sub-Segment 1, 2018-2029
Figure 12: Global Physiological Health Monitoring Sensors Market Forecast (USD Billion), by Sub-Segment 2, 2018-2029
Figure 13: Global Physiological Health Monitoring Sensors Market Forecast (USD Billion), by Sub-Segment 3, 2018-2029
Figure 14: Global Physiological Health Monitoring Sensors Market Forecast (USD Billion), by Others, 2018-2029
Figure 15: Global Physiological Health Monitoring Sensors Market Value (USD Billion), by Region, 2022 & 2029
Figure 16: North America Physiological Health Monitoring Sensors Market Value Share (%), By Segment 1, 2022 & 2029
Figure 17: North America Physiological Health Monitoring Sensors Market Forecast (USD Billion), by Sub-Segment 1, 2018-2029
Figure 18: North America Physiological Health Monitoring Sensors Market Forecast (USD Billion), by Sub-Segment 2, 2018-2029
Figure 19: North America Physiological Health Monitoring Sensors Market Value Share (%), By Segment 2, 2022 & 2029
Figure 20: North America Physiological Health Monitoring Sensors Market Forecast (USD Billion), by Sub-Segment 1, 2018-2029
Figure 21: North America Physiological Health Monitoring Sensors Market Forecast (USD Billion), by Sub-Segment 2, 2018-2029
Figure 22: North America Physiological Health Monitoring Sensors Market Forecast (USD Billion), by Sub-Segment 3, 2018-2029
Figure 23: North America Physiological Health Monitoring Sensors Market Forecast (USD Billion), by Others, 2018-2029
Figure 24: North America Physiological Health Monitoring Sensors Market Value Share (%), By Segment 3, 2022 & 2029
Figure 25: North America Physiological Health Monitoring Sensors Market Forecast (USD Billion), by Sub-Segment 1, 2018-2029
Figure 26: North America Physiological Health Monitoring Sensors Market Forecast (USD Billion), by Sub-Segment 2, 2018-2029
Figure 27: North America Physiological Health Monitoring Sensors Market Forecast (USD Billion), by Sub-Segment 3, 2018-2029
Figure 28: North America Physiological Health Monitoring Sensors Market Forecast (USD Billion), by Others, 2018-2029
Figure 29: North America Physiological Health Monitoring Sensors Market Forecast (USD Billion), by U.S., 2018-2029
Figure 30: North America Physiological Health Monitoring Sensors Market Forecast (USD Billion), by Canada, 2018-2029
Figure 31: Latin America Physiological Health Monitoring Sensors Market Value Share (%), By Segment 1, 2022 & 2029
Figure 32: Latin America Physiological Health Monitoring Sensors Market Forecast (USD Billion), by Sub-Segment 1, 2018-2029
Figure 33: Latin America Physiological Health Monitoring Sensors Market Forecast (USD Billion), by Sub-Segment 2, 2018-2029
Figure 34: Latin America Physiological Health Monitoring Sensors Market Value Share (%), By Segment 2, 2022 & 2029
Figure 35: Latin America Physiological Health Monitoring Sensors Market Forecast (USD Billion), by Sub-Segment 1, 2018-2029
Figure 36: Latin America Physiological Health Monitoring Sensors Market Forecast (USD Billion), by Sub-Segment 2, 2018-2029
Figure 37: Latin America Physiological Health Monitoring Sensors Market Forecast (USD Billion), by Sub-Segment 3, 2018-2029
Figure 38: Latin America Physiological Health Monitoring Sensors Market Forecast (USD Billion), by Others, 2018-2029
Figure 39: Latin America Physiological Health Monitoring Sensors Market Value Share (%), By Segment 3, 2022 & 2029
Figure 40: Latin America Physiological Health Monitoring Sensors Market Forecast (USD Billion), by Sub-Segment 1, 2018-2029
Figure 41: Latin America Physiological Health Monitoring Sensors Market Forecast (USD Billion), by Sub-Segment 2, 2018-2029
Figure 42: Latin America Physiological Health Monitoring Sensors Market Forecast (USD Billion), by Sub-Segment 3, 2018-2029
Figure 43: Latin America Physiological Health Monitoring Sensors Market Forecast (USD Billion), by Others, 2018-2029
Figure 44: Latin America Physiological Health Monitoring Sensors Market Forecast (USD Billion), by Brazil, 2018-2029
Figure 45: Latin America Physiological Health Monitoring Sensors Market Forecast (USD Billion), by Mexico, 2018-2029
Figure 46: Latin America Physiological Health Monitoring Sensors Market Forecast (USD Billion), by Rest of Latin America, 2018-2029
Figure 47: Europe Physiological Health Monitoring Sensors Market Value Share (%), By Segment 1, 2022 & 2029
Figure 48: Europe Physiological Health Monitoring Sensors Market Forecast (USD Billion), by Sub-Segment 1, 2018-2029
Figure 49: Europe Physiological Health Monitoring Sensors Market Forecast (USD Billion), by Sub-Segment 2, 2018-2029
Figure 50: Europe Physiological Health Monitoring Sensors Market Value Share (%), By Segment 2, 2022 & 2029
Figure 51: Europe Physiological Health Monitoring Sensors Market Forecast (USD Billion), by Sub-Segment 1, 2018-2029
Figure 52: Europe Physiological Health Monitoring Sensors Market Forecast (USD Billion), by Sub-Segment 2, 2018-2029
Figure 53: Europe Physiological Health Monitoring Sensors Market Forecast (USD Billion), by Sub-Segment 3, 2018-2029
Figure 54: Europe Physiological Health Monitoring Sensors Market Forecast (USD Billion), by Others, 2018-2029
Figure 55: Europe Physiological Health Monitoring Sensors Market Value Share (%), By Segment 3, 2022 & 2029
Figure 56: Europe Physiological Health Monitoring Sensors Market Forecast (USD Billion), by Sub-Segment 1, 2018-2029
Figure 57: Europe Physiological Health Monitoring Sensors Market Forecast (USD Billion), by Sub-Segment 2, 2018-2029
Figure 58: Europe Physiological Health Monitoring Sensors Market Forecast (USD Billion), by Sub-Segment 3, 2018-2029
Figure 59: Europe Physiological Health Monitoring Sensors Market Forecast (USD Billion), by Others, 2018-2029
Figure 60: Europe Physiological Health Monitoring Sensors Market Forecast (USD Billion), by U.K., 2018-2029
Figure 61: Europe Physiological Health Monitoring Sensors Market Forecast (USD Billion), by Germany, 2018-2029
Figure 62: Europe Physiological Health Monitoring Sensors Market Forecast (USD Billion), by France, 2018-2029
Figure 63: Europe Physiological Health Monitoring Sensors Market Forecast (USD Billion), by Italy, 2018-2029
Figure 64: Europe Physiological Health Monitoring Sensors Market Forecast (USD Billion), by Spain, 2018-2029
Figure 65: Europe Physiological Health Monitoring Sensors Market Forecast (USD Billion), by Russia, 2018-2029
Figure 66: Europe Physiological Health Monitoring Sensors Market Forecast (USD Billion), by Rest of Europe, 2018-2029
Figure 67: Asia Pacific Physiological Health Monitoring Sensors Market Value Share (%), By Segment 1, 2022 & 2029
Figure 68: Asia Pacific Physiological Health Monitoring Sensors Market Forecast (USD Billion), by Sub-Segment 1, 2018-2029
Figure 69: Asia Pacific Physiological Health Monitoring Sensors Market Forecast (USD Billion), by Sub-Segment 2, 2018-2029
Figure 70: Asia Pacific Physiological Health Monitoring Sensors Market Value Share (%), By Segment 2, 2022 & 2029
Figure 71: Asia Pacific Physiological Health Monitoring Sensors Market Forecast (USD Billion), by Sub-Segment 1, 2018-2029
Figure 72: Asia Pacific Physiological Health Monitoring Sensors Market Forecast (USD Billion), by Sub-Segment 2, 2018-2029
Figure 73: Asia Pacific Physiological Health Monitoring Sensors Market Forecast (USD Billion), by Sub-Segment 3, 2018-2029
Figure 74: Asia Pacific Physiological Health Monitoring Sensors Market Forecast (USD Billion), by Others, 2018-2029
Figure 75: Asia Pacific Physiological Health Monitoring Sensors Market Value Share (%), By Segment 3, 2022 & 2029
Figure 76: Asia Pacific Physiological Health Monitoring Sensors Market Forecast (USD Billion), by Sub-Segment 1, 2018-2029
Figure 77: Asia Pacific Physiological Health Monitoring Sensors Market Forecast (USD Billion), by Sub-Segment 2, 2018-2029
Figure 78: Asia Pacific Physiological Health Monitoring Sensors Market Forecast (USD Billion), by Sub-Segment 3, 2018-2029
Figure 79: Asia Pacific Physiological Health Monitoring Sensors Market Forecast (USD Billion), by Others, 2018-2029
Figure 80: Asia Pacific Physiological Health Monitoring Sensors Market Forecast (USD Billion), by China, 2018-2029
Figure 81: Asia Pacific Physiological Health Monitoring Sensors Market Forecast (USD Billion), by India, 2018-2029
Figure 82: Asia Pacific Physiological Health Monitoring Sensors Market Forecast (USD Billion), by Japan, 2018-2029
Figure 83: Asia Pacific Physiological Health Monitoring Sensors Market Forecast (USD Billion), by Australia, 2018-2029
Figure 84: Asia Pacific Physiological Health Monitoring Sensors Market Forecast (USD Billion), by Southeast Asia, 2018-2029
Figure 85: Asia Pacific Physiological Health Monitoring Sensors Market Forecast (USD Billion), by Rest of Asia Pacific, 2018-2029
Figure 86: Middle East & Africa Physiological Health Monitoring Sensors Market Value Share (%), By Segment 1, 2022 & 2029
Figure 87: Middle East & Africa Physiological Health Monitoring Sensors Market Forecast (USD Billion), by Sub-Segment 1, 2018-2029
Figure 88: Middle East & Africa Physiological Health Monitoring Sensors Market Forecast (USD Billion), by Sub-Segment 2, 2018-2029
Figure 89: Middle East & Africa Physiological Health Monitoring Sensors Market Value Share (%), By Segment 2, 2022 & 2029
Figure 90: Middle East & Africa Physiological Health Monitoring Sensors Market Forecast (USD Billion), by Sub-Segment 1, 2018-2029
Figure 91: Middle East & Africa Physiological Health Monitoring Sensors Market Forecast (USD Billion), by Sub-Segment 2, 2018-2029
Figure 92: Middle East & Africa Physiological Health Monitoring Sensors Market Forecast (USD Billion), by Sub-Segment 3, 2018-2029
Figure 93: Middle East & Africa Physiological Health Monitoring Sensors Market Forecast (USD Billion), by Others, 2018-2029
Figure 94: Middle East & Africa Physiological Health Monitoring Sensors Market Value Share (%), By Segment 3, 2022 & 2029
Figure 95: Middle East & Africa Physiological Health Monitoring Sensors Market Forecast (USD Billion), by Sub-Segment 1, 2018-2029
Figure 96: Middle East & Africa Physiological Health Monitoring Sensors Market Forecast (USD Billion), by Sub-Segment 2, 2018-2029
Figure 97: Middle East & Africa Physiological Health Monitoring Sensors Market Forecast (USD Billion), by Sub-Segment 3, 2018-2029
Figure 98: Middle East & Africa Physiological Health Monitoring Sensors Market Forecast (USD Billion), by Others, 2018-2029
Figure 99: Middle East & Africa Physiological Health Monitoring Sensors Market Forecast (USD Billion), by GCC, 2018-2029
Figure 100: Middle East & Africa Physiological Health Monitoring Sensors Market Forecast (USD Billion), by South Africa, 2018-2029
Figure 101: Middle East & Africa Physiological Health Monitoring Sensors Market Forecast (USD Billion), by Rest of Middle East & Africa, 2018-2029
List of Tables
Table 1: Global Physiological Health Monitoring Sensors Market Revenue (USD Billion) Forecast, by Segment 1, 2018-2029
Table 2: Global Physiological Health Monitoring Sensors Market Revenue (USD Billion) Forecast, by Segment 2, 2018-2029
Table 3: Global Physiological Health Monitoring Sensors Market Revenue (USD Billion) Forecast, by Segment 3, 2018-2029
Table 4: Global Physiological Health Monitoring Sensors Market Revenue (USD Billion) Forecast, by Region, 2018-2029
Table 5: North America Physiological Health Monitoring Sensors Market Revenue (USD Billion) Forecast, by Segment 1, 2018-2029
Table 6: North America Physiological Health Monitoring Sensors Market Revenue (USD Billion) Forecast, by Segment 2, 2018-2029
Table 7: North America Physiological Health Monitoring Sensors Market Revenue (USD Billion) Forecast, by Segment 3, 2018-2029
Table 8: North America Physiological Health Monitoring Sensors Market Revenue (USD Billion) Forecast, by Country, 2018-2029
Table 9: Europe Physiological Health Monitoring Sensors Market Revenue (USD Billion) Forecast, by Segment 1, 2018-2029
Table 10: Europe Physiological Health Monitoring Sensors Market Revenue (USD Billion) Forecast, by Segment 2, 2018-2029
Table 11: Europe Physiological Health Monitoring Sensors Market Revenue (USD Billion) Forecast, by Segment 3, 2018-2029
Table 12: Europe Physiological Health Monitoring Sensors Market Revenue (USD Billion) Forecast, by Country, 2018-2029
Table 13: Latin America Physiological Health Monitoring Sensors Market Revenue (USD Billion) Forecast, by Segment 1, 2018-2029
Table 14: Latin America Physiological Health Monitoring Sensors Market Revenue (USD Billion) Forecast, by Segment 2, 2018-2029
Table 15: Latin America Physiological Health Monitoring Sensors Market Revenue (USD Billion) Forecast, by Segment 3, 2018-2029
Table 16: Latin America Physiological Health Monitoring Sensors Market Revenue (USD Billion) Forecast, by Country, 2018-2029
Table 17: Asia Pacific Physiological Health Monitoring Sensors Market Revenue (USD Billion) Forecast, by Segment 1, 2018-2029
Table 18: Asia Pacific Physiological Health Monitoring Sensors Market Revenue (USD Billion) Forecast, by Segment 2, 2018-2029
Table 19: Asia Pacific Physiological Health Monitoring Sensors Market Revenue (USD Billion) Forecast, by Segment 3, 2018-2029
Table 20: Asia Pacific Physiological Health Monitoring Sensors Market Revenue (USD Billion) Forecast, by Country, 2018-2029
Table 21: Middle East & Africa Physiological Health Monitoring Sensors Market Revenue (USD Billion) Forecast, by Segment 1, 2018-2029
Table 22: Middle East & Africa Physiological Health Monitoring Sensors Market Revenue (USD Billion) Forecast, by Segment 2, 2018-2029
Table 23: Middle East & Africa Physiological Health Monitoring Sensors Market Revenue (USD Billion) Forecast, by Segment 3, 2018-2029
Table 24: Middle East & Africa Physiological Health Monitoring Sensors Market Revenue (USD Billion) Forecast, by Country, 2018-2029
Research Process
Data Library Research are conducted by industry experts who offer insight on
industry structure, market segmentations technology assessment and competitive landscape (CL), and penetration, as well as on emerging trends. Their analysis is based on primary interviews (~ 80%) and secondary research (~ 20%) as well as years of professional expertise in their respective industries. Adding to this, by analysing historical trends and current market positions, our analysts predict where the market will be headed for the next five years. Furthermore, the varying trends of segment & categories geographically presented are also studied and the estimated based on the primary & secondary research.
In this particular report from the supply side Data Library Research has conducted primary surveys (interviews) with the key level executives (VP, CEO’s, Marketing Director, Business Development Manager
and SOFT) of the companies that active & prominent as well as the midsized organization
FIGURE 1: DLR RESEARH PROCESS
![research-methodology1]()
Primary Research
Extensive primary research was conducted to gain a deeper insight of the market and industry performance. The analysis is based on both primary and secondary research as well as years of professional expertise in the respective industries.
In addition to analysing current and historical trends, our analysts predict where the market is headed over the next five years.
It varies by segment for these categories geographically presented in the list of market tables. Speaking about this particular report we have conducted primary surveys (interviews) with the key level executives (VP, CEO’s, Marketing Director, Business Development Manager and many more) of the major players active in the market.
Secondary Research
Secondary research was mainly used to collect and identify information useful for the extensive, technical, market-oriented, and Friend’s study of the Global Extra Neutral Alcohol. It was also used to obtain key information about major players, market classification and segmentation according to the industry trends, geographical markets, and developments related to the market and technology perspectives. For this study, analysts have gathered information from various credible sources, such as annual reports, sec filings, journals, white papers, SOFT presentations, and company web sites.
Market Size Estimation
Both, top-down and bottom-up approaches were used to estimate and validate the size of the Global market and to estimate the size of various other dependent submarkets in the overall Extra Neutral Alcohol. The key players in the market were identified through secondary research and their market contributions in the respective geographies were determined through primary and secondary research.
Forecast Model
![research-methodology2]()