Get Complete Analysis Of The Report - Download Updated Free Sample PDF
The Global Plant SAP Analysis Market refers to the industry focused on analyzing Secondary Metabolites, Active Compounds, and Phytochemicals (SAP) in plants for applications in pharmaceuticals, nutraceuticals, agriculture, and biotechnology. It involves advanced analytical techniques such as chromatography, spectroscopy, and mass spectrometry to identify, quantify, and standardize plant-derived compounds. Rising demand for herbal medicines, functional foods, and quality control in plant-based products is driving market growth globally.
The Global Plant SAP Analysis Market is witnessing rapid growth due to increasing demand for plant-based therapeutics, nutraceuticals, and functional foods. Advanced analytical techniques like HPLC, GC-MS, LC-MS, and NMR spectroscopy are widely adopted to ensure precise identification and quantification of secondary metabolites and active phytochemicals. Rising investments in R&D by pharmaceutical and biotechnology companies are driving innovations in plant compound profiling. Additionally, growing awareness about herbal medicine efficacy, regulatory requirements for quality control, and the popularity of natural products are propelling the adoption of SAP analysis. Emerging markets in Asia Pacific are contributing to significant regional growth.
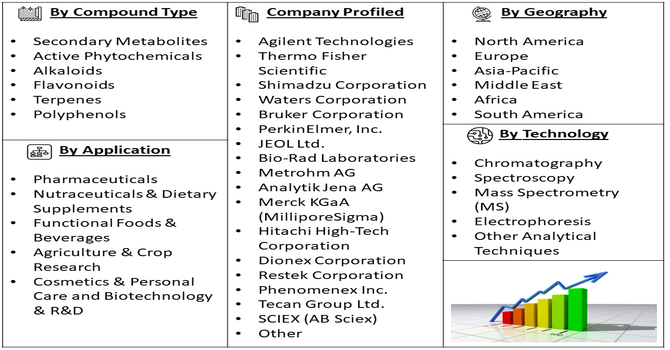
Segmentation: The Global Plant SAP Analysis Market is segmented by Compound Type (Secondary Metabolites, Active Phytochemicals, Alkaloids, Flavonoids, Terpenes, and Polyphenols), Technology (Chromatography, Spectroscopy, Mass Spectrometry (MS), Electrophoresis and Other Analytical Techniques), Application (Pharmaceuticals, Nutraceuticals & Dietary Supplements, Functional Foods & Beverages, Agriculture & Crop Research, Cosmetics & Personal Care and Biotechnology & R&D), and Geography (North America, Europe, Asia-Pacific, Middle East and Africa, and South America). The report provides the value (in USD million) for the above segments.
For Detailed Market Segmentation - Get a Free Sample PDF
Market Drivers:
The Global Plant SAP Analysis Market is driven by increasing consumer demand for herbal medicines, dietary supplements, and functional foods. Growing awareness of the health benefits of plant-derived bioactive compounds encourages pharmaceutical, nutraceutical, and food companies to invest in precise analysis of secondary metabolites and active phytochemicals. For instance, in November 2025, Eli Lilly announced plans to build a USD 3 billion manufacturing plant in the Netherlands to expand production of its experimental weight-loss drug, orforglipron, and other oral medicines. This expansion increased demand for Global Plant SAP Analysis to support quality control, compound standardization, and research in plant-derived and synthetic bioactive compounds for pharmaceutical applications.
Accurate identification and quantification ensure efficacy, safety, and regulatory compliance. Additionally, the surge in natural and organic product consumption globally is accelerating the adoption of advanced SAP analysis technologies, supporting R&D, quality control, and standardization of plant-based formulations.
Advancements in chromatography, spectroscopy, and mass spectrometry are driving growth in the Plant SAP Analysis Market. High-throughput, automated, and integrated platforms enable faster, more accurate, and reproducible analysis of complex plant compounds. Coupled with AI, big data, and software-driven analytics, these technologies enhance precision, reduce experimental errors, and support large-scale research and production.
In September 2025, Arkema and Catalyxx formed a strategic partnership to develop low-carbon, bio-based acrylic resins using proprietary technology. Catalyxx produced bio-alcohols, including bio n-butanol, from bioethanol with reduced carbon footprint. This initiative drove demand for Global Plant SAP Analysis to characterize, standardize, and optimize bio-derived compounds for sustainable materials and industrial applications. Thus, the continuous technological improvements, miniaturization, and cost optimization make SAP analysis more accessible, fueling market expansion globally.
Market Restraints:
High costs and technical complexity limit the adoption of Plant SAP Analysis solutions. Sophisticated instruments such as LC-MS, NMR, and UPLC require significant capital investment, skilled personnel, and ongoing maintenance. Small and medium enterprises, especially in emerging markets, may face challenges affording or operating advanced analytical platforms. Additionally, sample preparation, method development, and data interpretation are resource-intensive, which can slow research timelines. These financial and operational barriers hinder widespread implementation, despite increasing demand for plant compound analysis, limiting market penetration in cost-sensitive regions and among smaller organizations seeking plant-based product development.
The Plant SAP Analysis Market has significant socioeconomic implications by promoting safer, standardized, and effective plant-based products. It enhances the quality of herbal medicines, nutraceuticals, and functional foods, contributing to public health and wellness. By supporting R&D in pharmaceutical and agricultural sectors, the market fosters high-skilled employment and innovation. Standardized plant compound analysis also reduces economic losses from substandard or adulterated products and ensures regulatory compliance. Additionally, growing adoption of natural therapies encourages sustainable agriculture and ethical sourcing of plant materials, promoting environmental conservation and providing socioeconomic benefits to farming communities globally.
Segmental Analysis:
The Secondary Metabolites segment is expected to witness the highest growth over the forecast period due to their critical role in pharmaceuticals, nutraceuticals, and functional foods. Secondary metabolites such as alkaloids, flavonoids, terpenes, and polyphenols exhibit significant therapeutic properties, including antioxidant, anti-inflammatory, and anticancer effects. Increasing demand for natural bioactive compounds drives research in their identification, quantification, and standardization using advanced analytical techniques. Pharmaceutical, food, and cosmetic industries are investing heavily in secondary metabolite profiling to ensure product efficacy, safety, and regulatory compliance. Rising awareness of natural compounds’ health benefits continues to fuel global market expansion.
The Chromatography segment is expected to witness the highest growth due to its widespread use in analyzing complex plant compounds with precision and accuracy. Techniques such as HPLC, GC, and UPLC allow for efficient separation, identification, and quantification of secondary metabolites and active phytochemicals. Industries including pharmaceuticals, nutraceuticals, and agriculture rely heavily on chromatography for quality control, research, and regulatory compliance. Advancements in automated, high-throughput chromatography systems, coupled with enhanced sensitivity and reproducibility, further drive adoption. The technique’s versatility, reliability, and ability to handle diverse plant matrices position chromatography as the leading analytical method in the global Plant SAP Analysis Market.
The Pharmaceuticals segment is projected to witness the highest growth as plant-derived bioactive compounds gain importance in drug discovery, formulation, and development. Secondary metabolites, alkaloids, and flavonoids are extensively studied for therapeutic applications, driving demand for precise SAP analysis to ensure efficacy, safety, and regulatory compliance. Pharmaceutical companies are investing in advanced analytical techniques such as chromatography, spectroscopy, and mass spectrometry to accelerate R&D and optimize plant-based formulations. Additionally, increasing prevalence of chronic diseases and growing interest in natural remedies contribute to market expansion. The focus on standardized, high-quality plant compounds reinforces the pharmaceuticals sector as a primary driver of market growth.
Europe is expected to witness the highest growth in the Plant SAP Analysis Market due to stringent regulatory frameworks, advanced research infrastructure, and high adoption of analytical technologies.
Countries such as Germany, the UK, Netherlands, and France have strong pharmaceutical, nutraceutical, and biotechnology industries that demand precise plant compound analysis for product development and quality assurance. For instance, in March 2025, Dutch company Isobionics, a BASF brand, launched two biotech-derived flavor ingredients, Natural beta-Sinensal 20 and Natural alpha-Humulene 90, produced via renewable-source fermentation. This innovation drove demand for Plant SAP Analysis in Europe, supporting quality control, compound standardization, and characterization of bioactive plant-derived molecules for the food, nutraceutical, and flavor industries.
Similarly, in September 2025, Arkema and Catalyxx partnered in the Netherlands to develop low-carbon, bio-based acrylic resins, with Catalyxx producing bio-alcohols as sustainable feedstocks. This collaboration increased demand for Plant SAP Analysis in Europe to evaluate, standardize, and optimize bio-derived compounds for environmentally friendly materials and sustainable industrial applications.
Rising consumer awareness of natural products, functional foods, and herbal medicines further drives market demand. Investments in R&D, coupled with the presence of leading analytical instrument manufacturers and service providers, strengthen Europe’s market position. Advanced laboratories, government support, and technological innovation ensure continued growth in plant SAP analysis across the region.
| Report Matrics | Details |
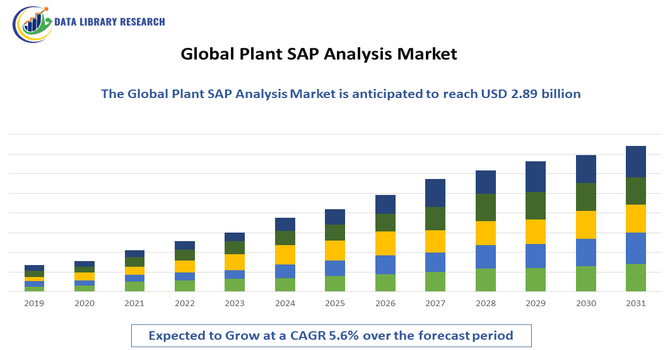
| Market Size Value | USD 2.89 billion |
| Growth Rate | CAGR of 5.6 % |
| Forecast | 2026-2033 |
| Historical data | 2021-2024 |
| Base Year | 2025 |
| Report Coverage | Forecasted revenue, company rating, competitive environment, growth drivers, and trends |
| Segment Coverage | Type, Application, End-User, Geography |
| Regional Scope | North America, Europe, Asia Pacific, Middle East |
| Customized scope | Free customization of reports (With 3 months Analysis Support ) |
| To Learn More About This Report | Request a Free Sample Copy |
The competitive landscape of the Global Plant SAP Analysis Market features a mix of established analytical instrument manufacturers, contract research organizations, and specialized service providers. Key players focus on product innovation, high-throughput analytical solutions, and strategic collaborations with pharmaceutical, nutraceutical, and agricultural companies. Companies offering integrated platforms, customized analysis services, and automation-driven solutions are gaining market share. Competitive strategies also include mergers, acquisitions, and partnerships to expand global reach and service capabilities. Differentiation through advanced instrumentation, rapid analysis, and compliance with international quality standards is critical to maintaining a competitive edge in this rapidly evolving market.
The major players for above market:
Recent Development
Q1. What are the main growth-driving factors for this market?
The primary driver is the shift toward precision agriculture. Unlike soil or dry tissue testing, SAP analysis provides a "real-time" look at a plant's current nutrient uptake, allowing farmers to adjust fertilization immediately. Increasing global food demand and the need to optimize resource use while reducing chemical runoff are pushing growers toward these highly accurate diagnostic tools.
Q2. What are the main restraining factors for this market?
Growth is limited by the high cost of specialized testing equipment and the technical expertise required to interpret complex data. Many small-scale farmers lack the budget or training to implement these systems. Additionally, the lack of standardized global benchmarks for "ideal" SAP levels across all crop varieties can lead to inconsistent results and slow market adoption.
Q3. Which segment is expected to witness high growth?
The Handheld/Portable Meters segment is expected to witness the highest growth. These devices allow agronomists and farmers to perform on-the-spot testing in the field rather than waiting days for laboratory results. As battery life improves and costs decrease, these "in-field" solutions are becoming the go-to tool for rapid, data-driven decision-making during critical growing stages.
Q4. Who are the top major players for this market?
The market is led by specialized agricultural technology and laboratory firms. Key players include NovaCropControl, Horiba, Eurofins Scientific, and Agrolab. These companies dominate by offering either high-end laboratory services that provide detailed mineral breakdowns or precise sensor technology that integrates with broader digital farm management software.
Q5. Which country is the largest player?
The Netherlands is a leading player and innovation hub in this market. Known for its highly advanced greenhouse industry and "smart farming" techniques, the country has invested heavily in SAP research to maximize yields in small spaces. While the U.S. has a larger total agricultural area, the Netherlands remains the center for SAP analysis expertise and service providers.
Data Library Research are conducted by industry experts who offer insight on industry structure, market segmentations technology assessment and competitive landscape (CL), and penetration, as well as on emerging trends. Their analysis is based on primary interviews (~ 80%) and secondary research (~ 20%) as well as years of professional expertise in their respective industries. Adding to this, by analysing historical trends and current market positions, our analysts predict where the market will be headed for the next five years. Furthermore, the varying trends of segment & categories geographically presented are also studied and the estimated based on the primary & secondary research.
In this particular report from the supply side Data Library Research has conducted primary surveys (interviews) with the key level executives (VP, CEO’s, Marketing Director, Business Development Manager and SOFT) of the companies that active & prominent as well as the midsized organization
FIGURE 1: DLR RESEARH PROCESS
Extensive primary research was conducted to gain a deeper insight of the market and industry performance. The analysis is based on both primary and secondary research as well as years of professional expertise in the respective industries.
In addition to analysing current and historical trends, our analysts predict where the market is headed over the next five years.
It varies by segment for these categories geographically presented in the list of market tables. Speaking about this particular report we have conducted primary surveys (interviews) with the key level executives (VP, CEO’s, Marketing Director, Business Development Manager and many more) of the major players active in the market.
Secondary ResearchSecondary research was mainly used to collect and identify information useful for the extensive, technical, market-oriented, and Friend’s study of the Global Extra Neutral Alcohol. It was also used to obtain key information about major players, market classification and segmentation according to the industry trends, geographical markets, and developments related to the market and technology perspectives. For this study, analysts have gathered information from various credible sources, such as annual reports, sec filings, journals, white papers, SOFT presentations, and company web sites.
Market Size EstimationBoth, top-down and bottom-up approaches were used to estimate and validate the size of the Global market and to estimate the size of various other dependent submarkets in the overall Extra Neutral Alcohol. The key players in the market were identified through secondary research and their market contributions in the respective geographies were determined through primary and secondary research.
Forecast Model