Probiotics for Middle-aged and Elderly Market Overview and Analysis

  • The Global Probiotics for Middle-aged and Elderly Market, encompassing dietary supplements, functional foods, and beverages, is on a significant upward trajectory, projected to increase substantially from its 2025 value. Estimates suggest the market size, valued around USD 74.81 billion in 2025, will reach between USD 126.78 billion by 2032, reflecting a robust Compound Annual Growth Rate (CAGR) in the range of 7.5% from 2025-2032.

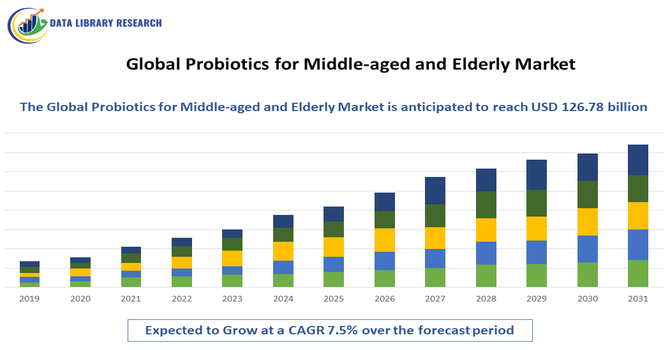
The Global Probiotics for Middle-aged and Elderly Market refers to the segment focused on developing and supplying probiotic supplements and functional foods specifically tailored to the health needs of individuals aged 40 and above. This market addresses age-related concerns such as digestive health, immunity, bone density, and cognitive function by leveraging beneficial microorganisms to restore gut microbiota balance. Driven by rising health awareness, an aging global population, and growing demand for preventive healthcare solutions, the market is witnessing innovation in delivery formats, including capsules, powders, yogurts, and fortified beverages, making probiotics a key component in healthy aging strategies.

Probiotics for Middle-aged and Elderly Market Latest Trends

The Global Probiotics for Middle-aged and Elderly Market is witnessing significant growth, driven by rising health consciousness and a rapidly aging global population. Key trends include the development of age-specific probiotic strains targeting issues such as weakened immunity, gastrointestinal disorders, bone health, and cognitive decline. Consumers are increasingly favoring functional foods and supplements that offer both convenience and proven health benefits. Innovations in formulation, including delayed-release capsules and probiotic-enriched foods like yogurts, beverages, and snacks, are enhancing product appeal. Companies are also investing in clinical research to validate health claims and personalize probiotics based on gut microbiome profiles.

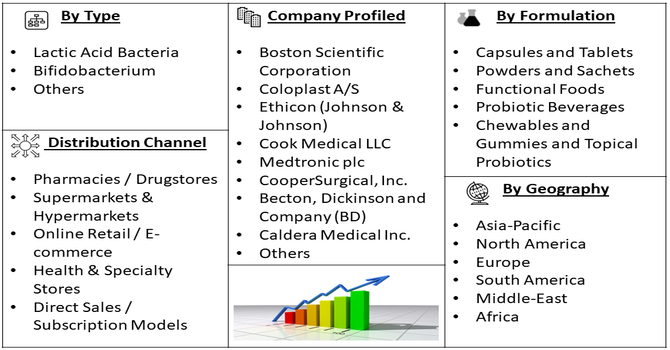
Segmentation: The Global Probiotics for Middle aged and Elderly Market is Segmented by Type (Lactic Acid Bacteria, Bifidobacterium and Others), Formulation (Capsules and Tablets, Powders and Sachets, Functional Foods, Probiotic Beverages, Chewables and Gummies and Topical Probiotics), Therapeutic (Digestive Health, Immune Support, Cognitive & Mental Health, Bone and Joint Health, Heart Health and Anti-inflammatory & Anti-allergy), Distribution Channel (Pharmacies / Drugstores, Supermarkets & Hypermarkets, Online Retail / E-commerce, Health & Specialty Stores, Direct Sales / Subscription Models), and Geography (North America, Europe, Asia-Pacific, Middle East and Africa, and South America). The report provides the value (in USD million) for the above segments.

Market Drivers:

  • Rising Health Awareness Among Aging Populations

Growing awareness about preventive healthcare and wellness is a major driver for probiotic consumption among middle-aged and elderly individuals. As age-related issues like poor digestion, weakened immunity, and chronic inflammation become more common, consumers are turning to probiotics as a natural solution. Educational campaigns and increased accessibility of health information online have empowered older adults to proactively manage their well-being. Additionally, the popularity of holistic and alternative medicine has pushed probiotics into mainstream acceptance. With aging populations expanding rapidly, especially in developed countries like Japan, Germany, and the U.S., the demand for targeted probiotic formulations addressing age-specific concerns continues to rise, supporting long-term market growth and innovation in this space.

  • Innovation in Probiotic Delivery Formats and Personalization

Manufacturers are investing heavily in advanced delivery mechanisms and personalized formulations, enhancing user experience and efficacy. Innovations such as delayed-release capsules, probiotic-infused foods and beverages, and chewable or gummy forms cater to seniors who may have trouble swallowing pills or have dietary restrictions. Additionally, the rise of microbiome testing and next-generation sequencing has enabled tailored probiotic solutions based on an individual’s gut profile.

Personalized nutrition is gaining traction, especially among health-conscious middle-aged consumers willing to spend more for effective, customized solutions. For instance, in April 2025, Verb Biotics, in partnership with the decentralized clinical research organization People Science, announced promising results from a randomized, double-blind, placebo-controlled clinical trial. The study demonstrated that daily supplementation with the GABA-producing probiotic strain Lactiplantibacillus plantarum LP815 significantly reduced anxiety levels in adults experiencing mild to moderate anxiety. The findings were published in the journal Beneficial Microbes, highlighting the probiotic’s potential as an effective intervention for anxiety management. These innovations improve compliance, reduce side effects, and enhance product differentiation, thereby fueling demand and expanding the consumer base for probiotics tailored to middle-aged and elderly populations.

Market Restraints:

  • Lack of Standardization and Regulatory Challenges

The key challenge restraining the growth of the probiotic market for the elderly is the lack of consistent global regulatory standards. This inconsistency creates confusion among consumers and restricts cross-border product launches by global brands. Moreover, proving the efficacy and safety of probiotics for specific age-related conditions requires rigorous clinical trials, which are time-consuming and costly. The absence of standardized guidelines can also lead to subpar or misleading products in the market, eroding consumer trust. Without stronger regulatory frameworks and harmonized quality assurance practices, market expansion could be hindered, particularly in developing regions.

Socio Economic Impact on Probiotics for Middle-aged and Elderly Market

The expansion of the probiotics market for middle-aged and elderly populations is creating positive socio-economic outcomes. Improved access to gut-health solutions helps reduce the burden on healthcare systems by supporting preventive care and reducing age-related illnesses. As life expectancy increases, the demand for products that support healthy aging grows, empowering older adults to remain active and independent longer. This shift encourages economic participation among seniors and contributes to wellness-oriented consumer spending. In emerging economies, the rise of the middle class is driving demand for affordable and accessible health supplements. Meanwhile, job creation in biotech, food manufacturing, and retail sectors is stimulated by growing market demand. Government support for healthy aging initiatives also reinforces the market's development and reach.

Segmental Analysis:

  • Lactic Acid Bacteria segment is expected to witness highest growth over the forecast period

The Lactic Acid Bacteria (LAB) segment is poised for the highest growth in the coming forecast period, largely due to its established reputation and extensive scientific validation. Strains from genera like Lactobacillus and Bifidobacterium are the most commonly used probiotics, known for their critical role in promoting gut health and enhancing immune function. Their versatility allows them to be incorporated into a wide variety of products, from traditional fermented foods like yogurt and cheese to modern dietary supplements. Increasing consumer awareness about the link between a healthy gut microbiome and overall well-being is the primary driver behind the significant and sustained market expansion of this vital microbial segment.

  • Capsules and Tablets segment is expected to witness highest growth over the forecast period

Capsules and tablets are projected to experience the highest growth as a product form over the forecast period, driven by their superior convenience and effectiveness as a delivery system. These solid formats offer several key advantages: precise dosing, extended shelf stability without the need for refrigeration, and a barrier that protects the live probiotic organisms from the harsh acidic environment of the stomach. This ensures more active bacteria reach the intestines where they can confer health benefits. The busy, modern consumer increasingly favors the portability and ease of a daily pill or capsule regimen over functional foods.

  • Immune Support segment is expected to witness highest growth over the forecast period

The Immune Support application segment is expected to witness the highest growth, fueled by rising consumer focus on preventive healthcare and overall wellness. Recent global health events have significantly increased awareness of probiotics' role in modulating the immune system, as a large portion of the body's immune cells reside in the gut. Consumers are actively seeking natural, safe, and effective solutions to boost their body’s defenses. This proactive approach to health, coupled with growing scientific evidence linking specific probiotic strains to improved immune response, positions this segment for rapid market acceleration.

  • Online Retail / E-commerce segment is expected to witness highest growth over the forecast period

Online Retail and E-commerce is anticipated to be the fastest-growing distribution channel, fundamentally changing how consumers purchase probiotics. The online platform provides unparalleled convenience, allowing consumers to easily compare products, access a wider variety of specialized or niche brands, and read peer reviews. For products like probiotics, the ability of e-commerce to manage temperature-controlled logistics for specific strains is a key advantage. This channel's rapid expansion, especially across emerging markets and among younger, digitally-native consumers, makes it a vital engine for future market growth.

  • Asia Pacific region is expected to witness highest growth over the forecast period

The Asia Pacific region is forecast to demonstrate the highest growth in the global market, driven by a confluence of favorable demographic and economic factors. The region's rapidly growing and aging population, combined with rising disposable incomes and a growing middle class, is translating to increased spending on health and wellness products.

Furthermore, many Asian countries have a strong cultural acceptance and tradition of consuming fermented foods, making the transition to probiotic-rich functional foods and supplements seamless. Key markets like China and India are leading this boom, positioning Asia Pacific as the most dynamic regional market. For instance, in May 2025, India’s Gut health startup The Good Bug raised INR 100 crore (approximately USD 12 million) in a Series B funding round led by Susquehanna Asia Venture Capital, the investment arm of Susquehanna International Group, with participation from existing investor Fireside Ventures. Earlier, the Mumbai-based company had secured USD 4 million in a Series A extension in 2024, led by Sharrp Ventures, the family office of Marico Group’s Harsh Mariwala. This latest funding brought The Good Bug’s total capital raised to around USD 20 million. The funds were allocated to advancing R&D in microbiome science, scaling clinical trials, expanding distribution networks, and boosting brand awareness among consumers and healthcare professionals. This significant investment has accelerated innovation and growth, driving the expansion of the APAC probiotics market by enhancing product development and increasing consumer accessibility.

Probiotics for Middle-aged and Elderly Market Competitive Landscape

The Global Probiotics for Middle-aged and Elderly Market is highly competitive, with key players including Nestlé, Danone, Yakult, Chr. Hansen, and DSM dominating the space. These companies are investing in R&D to develop targeted formulations that address specific age-related health concerns. Strategic partnerships, acquisitions, and expansions into emerging markets are common tactics to strengthen global footprints. Startups and niche brands are also entering the market with innovative delivery formats and personalized probiotic solutions. Regulatory approvals, clinical backing, and clean-label certifications are becoming critical differentiators as consumers seek trusted, scientifically supported products. The increasing consumer demand for transparency, sustainability, and efficacy is pushing both established and emerging players to innovate and differentiate within this growing and dynamic landscape.

The 20 major players for above market includes:

  • Yakult Honsha Co., Ltd.
  • Danone S.A.
  • Nestlé S.A.
  • Chr. Hansen Holding A/S
  • IFF (International Flavors & Fragrances)
  • Lallemand Inc.
  • ADM (Archer Daniels Midland Company)
  • BioGaia AB
  • Morinaga Milk Industry Co., Ltd.
  • Probi AB
  • Kerry Group plc
  • Lifeway Foods Inc.
  • H&H Group
  • AB-Biotics S.A.
  • Meiji Holdings Co., Ltd.
  • Valio Ltd.
  • Winclove Probiotics
  • i-Health, Inc. (a division of DSM)
  • Bayer AG
  • Sanzyme Biologics

Recent Development

  • In March 2025, Nature Made, a global national vitamin and supplement brand with over 50 years of experience in science-backed wellness solutions, launched new clinically studied innovations and formulations within its Digestive Health portfolio. The expanded line included a range of probiotic, prebiotic, and fiber supplements, designed to provide daily gut health support tailored to specific wellness needs. This strategic move reinforced Nature Made’s commitment to delivering high-quality, research-driven products while addressing the growing consumer demand for personalized and functional digestive health solution.


  • In January 2025, Cibo Vita, launched Probiotic FruiChias—a line of snacks made with real fruit puree and chia seeds, available in strawberry, blueberry, and raspberry flavors. Utilizing its patented microencapsulated delivery system, Cibo Vita ensured that the high-quality probiotic strain remained shelf-stable, allowing it to reach the gut intact for maximum digestive benefit. Each serving of FruiChias contained 2 billion microencapsulated probiotics, alongside 90 calories and 4 grams of dietary fiber. This product launch reinforced Cibo Vita’s commitment to delivering innovative, gut-health-focused snacks that combine nutritional value with convenience and taste.


Frequently Asked Questions (FAQ) :

Q1. What the main growth driving factors for this market?

The primary growth driver is the escalating global geriatric population, as older adults are more susceptible to age-related digestive and immune system disorders, increasing the demand for prophylactic health solutions. Growing consumer awareness of the link between gut health and overall well-being, coupled with a preference for natural and preventive healthcare over pharmaceuticals, significantly boosts market expansion. Additionally, the proliferation of functional foods and beverages fortified with probiotics, driven by rising disposable incomes and advancements in scientific research validating the health benefits of specific strains for elderly care, fuels the market's robust trajectory.

Q2. What are the main restraining factors for this market?

A key restraining factor is the high cost associated with the research, development, and commercialization of new, clinically validated probiotic strains, which contributes to higher product prices that may deter price-sensitive consumers. Furthermore, a lack of standardized regulatory guidelines and oversight, particularly concerning health claims, can create consumer confusion and distrust. The stability and efficacy challenges of live microorganisms during processing, storage, and shelf life, which can compromise the product's effectiveness before consumption, also pose a significant technical barrier to consistent market growth.

Q3. Which segment is expected to witness high growth?

The probiotic dietary supplements segment is expected to witness high growth. This surge is driven by the increasing consumer trend towards self-medication and a rising adoption of supplements as a convenient, concentrated method for preventative care, often as an alternative or complement to traditional medicine. The segment benefits from higher product innovation, offering targeted formulas for age-specific concerns like immune support, bone health, and gut-brain axis benefits. The growing accessibility and variety of these products through online distribution channels further contribute to its rapid expansion among the middle-aged and elderly demographic.

Q4. Who are the top major players for this market?

The global market for probiotics, including those targeted at the middle-aged and elderly, is dominated by several large, established nutrition and food science corporations. Key major players include Danone S.A., renowned for its dairy and plant-based probiotic foods like Activia, and Nestlé S.A., which leverages its Nestlé Health Science division for medical nutrition and supplements. Other significant players are Yakult Honsha Co., Ltd., a pioneer in probiotic drinks, and ingredient suppliers like Chr. Hansen Holding A/S (now Novonesis) and International Flavors & Fragrances (IFF), which are crucial in supplying proprietary, scientifically-backed probiotic strains to product manufacturers worldwide.

Q5. Which country is the largest player?

The Asia-Pacific (APAC) region, particularly countries like China, Japan, and India, is widely considered the largest regional player in the overall probiotics market by revenue share. This dominance is driven by a large and rapidly aging population, rising health consciousness, and a cultural acceptance of functional foods and traditional fermented products. Within the APAC region, while some sources point to the regional dominance, others suggest North America holds the largest individual country market share for the wider probiotics market. However, for the large and growing demographic of middle-aged and elderly consumers, the sheer volume and cultural integration of probiotics in daily diets position the collective APAC market as the most influential and largest force.

Probiotics for Middle-aged and Elderly MARKET STUDY GLOBAL MARKET ANALYSIS, INSIGHTS AND FORECAST, 2022-2029

    1. Introduction

    • 1.1. Research Scope
    • 1.2. Market Segmentation
    • 1.3. Research Methodology
    • 1.4. Definitions and Assumptions

    2. Executive Summary

      3. Market Dynamics

      • 3.1. Market Drivers
      • 3.2. Market Restraints
      • 3.3. Market Opportunities

      4. Key Insights

      • 4.1. Key Emerging Trends – For Major Countries
      • 4.2. Latest Technological Advancement
      • 4.3. Regulatory Landscape
      • 4.4. Industry SWOT Analysis
      • 4.5. Porters Five Forces Analysis

      5. Global Probiotics for Middle-aged and Elderly Market Analysis (USD Billion), Insights and Forecast, 2018-2029

      • 5.1. Key Findings / Summary
      • 5.2. Market Analysis, Insights and Forecast – By Segment 1
        • 5.2.1. Sub-Segment 1
        • 5.2.2. Sub-Segment 2
      • 5.3. Market Analysis, Insights and Forecast – By Segment 2
        • 5.3.1. Sub-Segment 1
        • 5.3.2. Sub-Segment 2
        • 5.3.3. Sub-Segment 3
        • 5.3.4. Others
      • 5.4. Market Analysis, Insights and Forecast – By Segment 3
        • 5.4.1. Sub-Segment 1
        • 5.4.2. Sub-Segment 2
        • 5.4.3. Sub-Segment 3
        • 5.4.4. Others
      • 5.5. Market Analysis, Insights and Forecast – By Region
        • 5.5.1. North America
        • 5.5.2. Latin America
        • 5.5.3. Europe
        • 5.5.4. Asia Pacific
        • 5.5.5. Middle East and Africa

      6. North America Probiotics for Middle-aged and Elderly Market Analysis (USD Billion), Insights and Forecast, 2018-2029

      • 6.1. Key Findings / Summary
      • 6.2. Market Analysis, Insights and Forecast – By Segment 1
        • 6.2.1. Sub-Segment 1
        • 6.2.2. Sub-Segment 2
      • 6.3. Market Analysis, Insights and Forecast – By Segment 2
        • 6.3.1. Sub-Segment 1
        • 6.3.2. Sub-Segment 2
        • 6.3.3. Sub-Segment 3
        • 6.3.4. Others
      • 6.4. Market Analysis, Insights and Forecast – By Segment 3
        • 6.4.1. Sub-Segment 1
        • 6.4.2. Sub-Segment 2
        • 6.4.3. Sub-Segment 3
        • 6.4.4. Others
      • 6.5. Market Analysis, Insights and Forecast – By Country
        • 6.5.1. U.S.
        • 6.5.2. Canada

      7. Latin America Probiotics for Middle-aged and Elderly Market Analysis (USD Billion), Insights and Forecast, 2018-2029

      • 7.1. Key Findings / Summary
      • 7.2. Market Analysis, Insights and Forecast – By Segment 1
        • 7.2.1. Sub-Segment 1
        • 7.2.2. Sub-Segment 2
      • 7.3. Market Analysis, Insights and Forecast – By Segment 2
        • 7.3.1. Sub-Segment 1
        • 7.3.2. Sub-Segment 2
        • 7.3.3. Sub-Segment 3
        • 7.3.4. Others
      • 7.4. Market Analysis, Insights and Forecast – By Segment 3
        • 7.4.1. Sub-Segment 1
        • 7.4.2. Sub-Segment 2
        • 7.4.3. Sub-Segment 3
        • 7.4.4. Others
      • 7.5. Insights and Forecast – By Country
        • 7.5.1. Brazil
        • 7.5.2. Mexico
        • 7.5.3. Rest of Latin America

      8. Europe Probiotics for Middle-aged and Elderly Market Analysis (USD Billion), Insights and Forecast, 2018-2029

      • 8.1. Key Findings / Summary
      • 8.2. Market Analysis, Insights and Forecast – By Segment 1
        • 8.2.1. Sub-Segment 1
        • 8.2.2. Sub-Segment 2
      • 8.3. Market Analysis, Insights and Forecast – By Segment 2
        • 8.3.1. Sub-Segment 1
        • 8.3.2. Sub-Segment 2
        • 8.3.3. Sub-Segment 3
        • 8.3.4. Others
      • 8.4. Market Analysis, Insights and Forecast – By Segment 3
        • 8.4.1. Sub-Segment 1
        • 8.4.2. Sub-Segment 2
        • 8.4.3. Sub-Segment 3
        • 8.4.4. Others
      • 8.5. Market Analysis, Insights and Forecast – By Country
        • 8.5.1. UK
        • 8.5.2. Germany
        • 8.5.3. France
        • 8.5.4. Italy
        • 8.5.5. Spain
        • 8.5.6. Russia
        • 8.5.7. Rest of Europe

      9. Asia Pacific Probiotics for Middle-aged and Elderly Market Analysis (USD Billion), Insights and Forecast, 2018-2029

      • 9.1. Key Findings / Summary
      • 9.2. Market Analysis, Insights and Forecast – By Segment 1
        • 9.2.1. Sub-Segment 1
        • 9.2.2. Sub-Segment 2
      • 9.3. Market Analysis, Insights and Forecast – By Segment 2
        • 9.3.1. Sub-Segment 1
        • 9.3.2. Sub-Segment 2
        • 9.3.3. Sub-Segment 3
        • 9.3.4. Others
      • 9.4. Market Analysis, Insights and Forecast – By Segment 3
        • 9.4.1. Sub-Segment 1
        • 9.4.2. Sub-Segment 2
        • 9.4.3. Sub-Segment 3
        • 9.4.4. Others
      • 9.5. Market Analysis, Insights and Forecast – By Country
        • 9.5.1. China
        • 9.5.2. India
        • 9.5.3. Japan
        • 9.5.4. Australia
        • 9.5.5. South East Asia
        • 9.5.6. Rest of Asia Pacific

      10. Middle East & Africa Probiotics for Middle-aged and Elderly Market Analysis (USD Billion), Insights and Forecast, 2018-2029

      • 10.1. Key Findings / Summary
      • 10.2. Market Analysis, Insights and Forecast – By Segment 1
        • 10.2.1. Sub-Segment 1
        • 10.2.2. Sub-Segment 2
      • 10.3. Market Analysis, Insights and Forecast – By Segment 2
        • 10.3.1. Sub-Segment 1
        • 10.3.2. Sub-Segment 2
        • 10.3.3. Sub-Segment 3
        • 10.3.4. Others
      • 10.4. Market Analysis, Insights and Forecast – By Segment 3
        • 10.4.1. Sub-Segment 1
        • 10.4.2. Sub-Segment 2
        • 10.4.3. Sub-Segment 3
        • 10.4.4. Others
      • 10.5. Market Analysis, Insights and Forecast – By Country
        • 10.5.1. GCC
        • 10.5.2. South Africa
        • 10.5.3. Rest of Middle East & Africa

      11. Competitive Analysis

      • 11.1. Company Market Share Analysis, 2018
      • 11.2. Key Industry Developments
      • 11.3. Company Profile
        • 11.3.1. Company 1
          • 11.3.1.1. Business Overview
          • 11.3.1.2. Segment 1 & Service Offering
          • 11.3.1.3. Overall Revenue
          • 11.3.1.4. Geographic Presence
          • 11.3.1.5. Recent Development
        *Similar details will be provided for the following companies
        • 11.3.2. Company 2
        • 11.3.3. Company 3
        • 11.3.4. Company 4
        • 11.3.5. Company 5
        • 11.3.6. Company 6
        • 11.3.7. Company 7
        • 11.3.8. Company 8
        • 11.3.9. Company 9
        • 11.3.10. Company 10
        • 11.3.11. Company 11
        • 11.3.12. Company 12
      List of Figures

      Figure 1: Global Probiotics for Middle-aged and Elderly Market Revenue Breakdown (USD Billion, %) by Region, 2022 & 2029
      Figure 2: Global Probiotics for Middle-aged and Elderly Market Value Share (%), By Segment 1, 2022 & 2029
      Figure 3: Global Probiotics for Middle-aged and Elderly Market Forecast (USD Billion), by Sub-Segment 1, 2018-2029
      Figure 4: Global Probiotics for Middle-aged and Elderly Market Forecast (USD Billion), by Sub-Segment 2, 2018-2029
      Figure 5: Global Probiotics for Middle-aged and Elderly Market Value Share (%), By Segment 2, 2022 & 2029
      Figure 6: Global Probiotics for Middle-aged and Elderly Market Forecast (USD Billion), by Sub-Segment 1, 2018-2029
      Figure 7: Global Probiotics for Middle-aged and Elderly Market Forecast (USD Billion), by Sub-Segment 2, 2018-2029
      Figure 8: Global Probiotics for Middle-aged and Elderly Market Forecast (USD Billion), by Sub-Segment 3, 2018-2029
      Figure 9: Global Probiotics for Middle-aged and Elderly Market Forecast (USD Billion), by Others, 2018-2029
      Figure 10: Global Probiotics for Middle-aged and Elderly Market Value Share (%), By Segment 3, 2022 & 2029
      Figure 11: Global Probiotics for Middle-aged and Elderly Market Forecast (USD Billion), by Sub-Segment 1, 2018-2029
      Figure 12: Global Probiotics for Middle-aged and Elderly Market Forecast (USD Billion), by Sub-Segment 2, 2018-2029
      Figure 13: Global Probiotics for Middle-aged and Elderly Market Forecast (USD Billion), by Sub-Segment 3, 2018-2029
      Figure 14: Global Probiotics for Middle-aged and Elderly Market Forecast (USD Billion), by Others, 2018-2029
      Figure 15: Global Probiotics for Middle-aged and Elderly Market Value (USD Billion), by Region, 2022 & 2029
      Figure 16: North America Probiotics for Middle-aged and Elderly Market Value Share (%), By Segment 1, 2022 & 2029
      Figure 17: North America Probiotics for Middle-aged and Elderly Market Forecast (USD Billion), by Sub-Segment 1, 2018-2029
      Figure 18: North America Probiotics for Middle-aged and Elderly Market Forecast (USD Billion), by Sub-Segment 2, 2018-2029
      Figure 19: North America Probiotics for Middle-aged and Elderly Market Value Share (%), By Segment 2, 2022 & 2029
      Figure 20: North America Probiotics for Middle-aged and Elderly Market Forecast (USD Billion), by Sub-Segment 1, 2018-2029
      Figure 21: North America Probiotics for Middle-aged and Elderly Market Forecast (USD Billion), by Sub-Segment 2, 2018-2029
      Figure 22: North America Probiotics for Middle-aged and Elderly Market Forecast (USD Billion), by Sub-Segment 3, 2018-2029
      Figure 23: North America Probiotics for Middle-aged and Elderly Market Forecast (USD Billion), by Others, 2018-2029
      Figure 24: North America Probiotics for Middle-aged and Elderly Market Value Share (%), By Segment 3, 2022 & 2029
      Figure 25: North America Probiotics for Middle-aged and Elderly Market Forecast (USD Billion), by Sub-Segment 1, 2018-2029
      Figure 26: North America Probiotics for Middle-aged and Elderly Market Forecast (USD Billion), by Sub-Segment 2, 2018-2029
      Figure 27: North America Probiotics for Middle-aged and Elderly Market Forecast (USD Billion), by Sub-Segment 3, 2018-2029
      Figure 28: North America Probiotics for Middle-aged and Elderly Market Forecast (USD Billion), by Others, 2018-2029
      Figure 29: North America Probiotics for Middle-aged and Elderly Market Forecast (USD Billion), by U.S., 2018-2029
      Figure 30: North America Probiotics for Middle-aged and Elderly Market Forecast (USD Billion), by Canada, 2018-2029
      Figure 31: Latin America Probiotics for Middle-aged and Elderly Market Value Share (%), By Segment 1, 2022 & 2029
      Figure 32: Latin America Probiotics for Middle-aged and Elderly Market Forecast (USD Billion), by Sub-Segment 1, 2018-2029
      Figure 33: Latin America Probiotics for Middle-aged and Elderly Market Forecast (USD Billion), by Sub-Segment 2, 2018-2029
      Figure 34: Latin America Probiotics for Middle-aged and Elderly Market Value Share (%), By Segment 2, 2022 & 2029
      Figure 35: Latin America Probiotics for Middle-aged and Elderly Market Forecast (USD Billion), by Sub-Segment 1, 2018-2029
      Figure 36: Latin America Probiotics for Middle-aged and Elderly Market Forecast (USD Billion), by Sub-Segment 2, 2018-2029
      Figure 37: Latin America Probiotics for Middle-aged and Elderly Market Forecast (USD Billion), by Sub-Segment 3, 2018-2029
      Figure 38: Latin America Probiotics for Middle-aged and Elderly Market Forecast (USD Billion), by Others, 2018-2029
      Figure 39: Latin America Probiotics for Middle-aged and Elderly Market Value Share (%), By Segment 3, 2022 & 2029
      Figure 40: Latin America Probiotics for Middle-aged and Elderly Market Forecast (USD Billion), by Sub-Segment 1, 2018-2029
      Figure 41: Latin America Probiotics for Middle-aged and Elderly Market Forecast (USD Billion), by Sub-Segment 2, 2018-2029
      Figure 42: Latin America Probiotics for Middle-aged and Elderly Market Forecast (USD Billion), by Sub-Segment 3, 2018-2029
      Figure 43: Latin America Probiotics for Middle-aged and Elderly Market Forecast (USD Billion), by Others, 2018-2029
      Figure 44: Latin America Probiotics for Middle-aged and Elderly Market Forecast (USD Billion), by Brazil, 2018-2029
      Figure 45: Latin America Probiotics for Middle-aged and Elderly Market Forecast (USD Billion), by Mexico, 2018-2029
      Figure 46: Latin America Probiotics for Middle-aged and Elderly Market Forecast (USD Billion), by Rest of Latin America, 2018-2029
      Figure 47: Europe Probiotics for Middle-aged and Elderly Market Value Share (%), By Segment 1, 2022 & 2029
      Figure 48: Europe Probiotics for Middle-aged and Elderly Market Forecast (USD Billion), by Sub-Segment 1, 2018-2029
      Figure 49: Europe Probiotics for Middle-aged and Elderly Market Forecast (USD Billion), by Sub-Segment 2, 2018-2029
      Figure 50: Europe Probiotics for Middle-aged and Elderly Market Value Share (%), By Segment 2, 2022 & 2029
      Figure 51: Europe Probiotics for Middle-aged and Elderly Market Forecast (USD Billion), by Sub-Segment 1, 2018-2029
      Figure 52: Europe Probiotics for Middle-aged and Elderly Market Forecast (USD Billion), by Sub-Segment 2, 2018-2029
      Figure 53: Europe Probiotics for Middle-aged and Elderly Market Forecast (USD Billion), by Sub-Segment 3, 2018-2029
      Figure 54: Europe Probiotics for Middle-aged and Elderly Market Forecast (USD Billion), by Others, 2018-2029
      Figure 55: Europe Probiotics for Middle-aged and Elderly Market Value Share (%), By Segment 3, 2022 & 2029
      Figure 56: Europe Probiotics for Middle-aged and Elderly Market Forecast (USD Billion), by Sub-Segment 1, 2018-2029
      Figure 57: Europe Probiotics for Middle-aged and Elderly Market Forecast (USD Billion), by Sub-Segment 2, 2018-2029
      Figure 58: Europe Probiotics for Middle-aged and Elderly Market Forecast (USD Billion), by Sub-Segment 3, 2018-2029
      Figure 59: Europe Probiotics for Middle-aged and Elderly Market Forecast (USD Billion), by Others, 2018-2029
      Figure 60: Europe Probiotics for Middle-aged and Elderly Market Forecast (USD Billion), by U.K., 2018-2029
      Figure 61: Europe Probiotics for Middle-aged and Elderly Market Forecast (USD Billion), by Germany, 2018-2029
      Figure 62: Europe Probiotics for Middle-aged and Elderly Market Forecast (USD Billion), by France, 2018-2029
      Figure 63: Europe Probiotics for Middle-aged and Elderly Market Forecast (USD Billion), by Italy, 2018-2029
      Figure 64: Europe Probiotics for Middle-aged and Elderly Market Forecast (USD Billion), by Spain, 2018-2029
      Figure 65: Europe Probiotics for Middle-aged and Elderly Market Forecast (USD Billion), by Russia, 2018-2029
      Figure 66: Europe Probiotics for Middle-aged and Elderly Market Forecast (USD Billion), by Rest of Europe, 2018-2029
      Figure 67: Asia Pacific Probiotics for Middle-aged and Elderly Market Value Share (%), By Segment 1, 2022 & 2029
      Figure 68: Asia Pacific Probiotics for Middle-aged and Elderly Market Forecast (USD Billion), by Sub-Segment 1, 2018-2029
      Figure 69: Asia Pacific Probiotics for Middle-aged and Elderly Market Forecast (USD Billion), by Sub-Segment 2, 2018-2029
      Figure 70: Asia Pacific Probiotics for Middle-aged and Elderly Market Value Share (%), By Segment 2, 2022 & 2029
      Figure 71: Asia Pacific Probiotics for Middle-aged and Elderly Market Forecast (USD Billion), by Sub-Segment 1, 2018-2029
      Figure 72: Asia Pacific Probiotics for Middle-aged and Elderly Market Forecast (USD Billion), by Sub-Segment 2, 2018-2029
      Figure 73: Asia Pacific Probiotics for Middle-aged and Elderly Market Forecast (USD Billion), by Sub-Segment 3, 2018-2029
      Figure 74: Asia Pacific Probiotics for Middle-aged and Elderly Market Forecast (USD Billion), by Others, 2018-2029
      Figure 75: Asia Pacific Probiotics for Middle-aged and Elderly Market Value Share (%), By Segment 3, 2022 & 2029
      Figure 76: Asia Pacific Probiotics for Middle-aged and Elderly Market Forecast (USD Billion), by Sub-Segment 1, 2018-2029
      Figure 77: Asia Pacific Probiotics for Middle-aged and Elderly Market Forecast (USD Billion), by Sub-Segment 2, 2018-2029
      Figure 78: Asia Pacific Probiotics for Middle-aged and Elderly Market Forecast (USD Billion), by Sub-Segment 3, 2018-2029
      Figure 79: Asia Pacific Probiotics for Middle-aged and Elderly Market Forecast (USD Billion), by Others, 2018-2029
      Figure 80: Asia Pacific Probiotics for Middle-aged and Elderly Market Forecast (USD Billion), by China, 2018-2029
      Figure 81: Asia Pacific Probiotics for Middle-aged and Elderly Market Forecast (USD Billion), by India, 2018-2029
      Figure 82: Asia Pacific Probiotics for Middle-aged and Elderly Market Forecast (USD Billion), by Japan, 2018-2029
      Figure 83: Asia Pacific Probiotics for Middle-aged and Elderly Market Forecast (USD Billion), by Australia, 2018-2029
      Figure 84: Asia Pacific Probiotics for Middle-aged and Elderly Market Forecast (USD Billion), by Southeast Asia, 2018-2029
      Figure 85: Asia Pacific Probiotics for Middle-aged and Elderly Market Forecast (USD Billion), by Rest of Asia Pacific, 2018-2029
      Figure 86: Middle East & Africa Probiotics for Middle-aged and Elderly Market Value Share (%), By Segment 1, 2022 & 2029
      Figure 87: Middle East & Africa Probiotics for Middle-aged and Elderly Market Forecast (USD Billion), by Sub-Segment 1, 2018-2029
      Figure 88: Middle East & Africa Probiotics for Middle-aged and Elderly Market Forecast (USD Billion), by Sub-Segment 2, 2018-2029
      Figure 89: Middle East & Africa Probiotics for Middle-aged and Elderly Market Value Share (%), By Segment 2, 2022 & 2029
      Figure 90: Middle East & Africa Probiotics for Middle-aged and Elderly Market Forecast (USD Billion), by Sub-Segment 1, 2018-2029
      Figure 91: Middle East & Africa Probiotics for Middle-aged and Elderly Market Forecast (USD Billion), by Sub-Segment 2, 2018-2029
      Figure 92: Middle East & Africa Probiotics for Middle-aged and Elderly Market Forecast (USD Billion), by Sub-Segment 3, 2018-2029
      Figure 93: Middle East & Africa Probiotics for Middle-aged and Elderly Market Forecast (USD Billion), by Others, 2018-2029
      Figure 94: Middle East & Africa Probiotics for Middle-aged and Elderly Market Value Share (%), By Segment 3, 2022 & 2029
      Figure 95: Middle East & Africa Probiotics for Middle-aged and Elderly Market Forecast (USD Billion), by Sub-Segment 1, 2018-2029
      Figure 96: Middle East & Africa Probiotics for Middle-aged and Elderly Market Forecast (USD Billion), by Sub-Segment 2, 2018-2029
      Figure 97: Middle East & Africa Probiotics for Middle-aged and Elderly Market Forecast (USD Billion), by Sub-Segment 3, 2018-2029
      Figure 98: Middle East & Africa Probiotics for Middle-aged and Elderly Market Forecast (USD Billion), by Others, 2018-2029
      Figure 99: Middle East & Africa Probiotics for Middle-aged and Elderly Market Forecast (USD Billion), by GCC, 2018-2029
      Figure 100: Middle East & Africa Probiotics for Middle-aged and Elderly Market Forecast (USD Billion), by South Africa, 2018-2029
      Figure 101: Middle East & Africa Probiotics for Middle-aged and Elderly Market Forecast (USD Billion), by Rest of Middle East & Africa, 2018-2029 
      List of Tables
      Table 1: Global Probiotics for Middle-aged and Elderly Market Revenue (USD Billion) Forecast, by Segment 1, 2018-2029
      Table 2: Global Probiotics for Middle-aged and Elderly Market Revenue (USD Billion) Forecast, by Segment 2, 2018-2029
      Table 3: Global Probiotics for Middle-aged and Elderly Market Revenue (USD Billion) Forecast, by Segment 3, 2018-2029
      Table 4: Global Probiotics for Middle-aged and Elderly Market Revenue (USD Billion) Forecast, by Region, 2018-2029
      Table 5: North America Probiotics for Middle-aged and Elderly Market Revenue (USD Billion) Forecast, by Segment 1, 2018-2029
      Table 6: North America Probiotics for Middle-aged and Elderly Market Revenue (USD Billion) Forecast, by Segment 2, 2018-2029
      Table 7: North America Probiotics for Middle-aged and Elderly Market Revenue (USD Billion) Forecast, by Segment 3, 2018-2029
      Table 8: North America Probiotics for Middle-aged and Elderly Market Revenue (USD Billion) Forecast, by Country, 2018-2029
      Table 9: Europe Probiotics for Middle-aged and Elderly Market Revenue (USD Billion) Forecast, by Segment 1, 2018-2029
      Table 10: Europe Probiotics for Middle-aged and Elderly Market Revenue (USD Billion) Forecast, by Segment 2, 2018-2029
      Table 11: Europe Probiotics for Middle-aged and Elderly Market Revenue (USD Billion) Forecast, by Segment 3, 2018-2029
      Table 12: Europe Probiotics for Middle-aged and Elderly Market Revenue (USD Billion) Forecast, by Country, 2018-2029
      Table 13: Latin America Probiotics for Middle-aged and Elderly Market Revenue (USD Billion) Forecast, by Segment 1, 2018-2029
      Table 14: Latin America Probiotics for Middle-aged and Elderly Market Revenue (USD Billion) Forecast, by Segment 2, 2018-2029
      Table 15: Latin America Probiotics for Middle-aged and Elderly Market Revenue (USD Billion) Forecast, by Segment 3, 2018-2029
      Table 16: Latin America Probiotics for Middle-aged and Elderly Market Revenue (USD Billion) Forecast, by Country, 2018-2029
      Table 17: Asia Pacific Probiotics for Middle-aged and Elderly Market Revenue (USD Billion) Forecast, by Segment 1, 2018-2029
      Table 18: Asia Pacific Probiotics for Middle-aged and Elderly Market Revenue (USD Billion) Forecast, by Segment 2, 2018-2029
      Table 19: Asia Pacific Probiotics for Middle-aged and Elderly Market Revenue (USD Billion) Forecast, by Segment 3, 2018-2029
      Table 20: Asia Pacific Probiotics for Middle-aged and Elderly Market Revenue (USD Billion) Forecast, by Country, 2018-2029
      Table 21: Middle East & Africa Probiotics for Middle-aged and Elderly Market Revenue (USD Billion) Forecast, by Segment 1, 2018-2029
      Table 22: Middle East & Africa Probiotics for Middle-aged and Elderly Market Revenue (USD Billion) Forecast, by Segment 2, 2018-2029
      Table 23: Middle East & Africa Probiotics for Middle-aged and Elderly Market Revenue (USD Billion) Forecast, by Segment 3, 2018-2029
      Table 24: Middle East & Africa Probiotics for Middle-aged and Elderly Market Revenue (USD Billion) Forecast, by Country, 2018-2029
      Research Process

      Data Library Research are conducted by industry experts who offer insight on industry structure, market segmentations technology assessment and competitive landscape (CL), and penetration, as well as on emerging trends. Their analysis is based on primary interviews (~ 80%) and secondary research (~ 20%) as well as years of professional expertise in their respective industries. Adding to this, by analysing historical trends and current market positions, our analysts predict where the market will be headed for the next five years. Furthermore, the varying trends of segment & categories geographically presented are also studied and the estimated based on the primary & secondary research.

      In this particular report from the supply side Data Library Research has conducted primary surveys (interviews) with the key level executives (VP, CEO’s, Marketing Director, Business Development Manager and SOFT) of the companies that active & prominent as well as the midsized organization

      FIGURE 1: DLR RESEARH PROCESS

      research-methodology1

      Primary Research

      Extensive primary research was conducted to gain a deeper insight of the market and industry performance. The analysis is based on both primary and secondary research as well as years of professional expertise in the respective industries.

      In addition to analysing current and historical trends, our analysts predict where the market is headed over the next five years.

      It varies by segment for these categories geographically presented in the list of market tables. Speaking about this particular report we have conducted primary surveys (interviews) with the key level executives (VP, CEO’s, Marketing Director, Business Development Manager and many more) of the major players active in the market.

      Secondary Research

      Secondary research was mainly used to collect and identify information useful for the extensive, technical, market-oriented, and Friend’s study of the Global Extra Neutral Alcohol. It was also used to obtain key information about major players, market classification and segmentation according to the industry trends, geographical markets, and developments related to the market and technology perspectives. For this study, analysts have gathered information from various credible sources, such as annual reports, sec filings, journals, white papers, SOFT presentations, and company web sites.

      Market Size Estimation

      Both, top-down and bottom-up approaches were used to estimate and validate the size of the Global market and to estimate the size of various other dependent submarkets in the overall Extra Neutral Alcohol. The key players in the market were identified through secondary research and their market contributions in the respective geographies were determined through primary and secondary research.

      Forecast Model

      research-methodology2

      Happy to Assist You

      If you have a question?

      info@datalibraryresearch.com

      IND : +91 955 279 0357

      Browse Related Reports