Radiopharmaceuticals Market Overview
The radiopharmaceuticals industry, a sub-branch of the pharmaceutical sector, has a distinct structure. Radiopharmaceuticals are radioisotopes that have been bonded to biological molecules and can target specific organs, tissues, or cells in the human body. These radioactive medications can be used for disease diagnosis and, in some cases, therapy. Radiopharmaceuticals are biologically active compounds that have been tagged with radionuclides to provide a useful source of ionizing radiation for diagnostic imaging and therapy. The global Radiopharmaceuticals market is projected to rise at a considerable rate in the forthcoming years.
Currently, diagnostic laboratories and hospitals use radiopharmaceuticals compounds to superimpose nuclear medicine images with computed tomography (CT) or magnetic resonance imaging (MRI) to provide exceptional perspectives. The image is created by using an isotope compound as a tracer. Image fusion or co-registration is the term for this. This is one of the factors that boost the demand for radiopharmaceuticals compounds.
In recent years, there has been an upsurge in funding towards the development of novel radioisotope-based theranostic agents. After decades of neglect by the pharmaceutical industry, radiopharmaceuticals are now generating large cancer deals all over the world. This could lead to an increase in 'theranostics,' or cancer medications that can be used as both therapies and diagnostics. All these aforementioned factors are majorly contributed to the growth of the global Radiopharmaceuticals market.
| Report Metric |
Details |
| Market size available for years |
2023–2030 |
| Base year considered |
2023 |
| Forecast period |
2024–2030 |
| Forecast unit |
Value (USD Million) |
| Segments covered |
Compound, System, Indication, End-user, and Region |
| Regions covered |
North America (the U.S. and Canada), Europe (UK, Germany, France, Italy, Spain, Russia, Rest of Europe), Asia-Pacific (China, India, Japan, Australia, South East Asia, Rest of Asia Pacific), Latin America and the Middle East and Africa (Brazil, Saudi Arabia, UAE, Rest of LAMEA) |
| Companies covered |
Siemens Healthineers, GE Healthcare, Advanced Accelerator Applications (a Novartis AG Company), Jubilant Pharma Limited, Bayer AG, ITM Isotopen Technologien München AG, Telix Pharmaceuticals, Lantheus Holdings, Inc., Eli Lilly and Company, Nihon Medi-Physics, Avanos Medical, Inc. |
Covid-19 Impact on Radiopharmaceuticals Market
In addition, the current Radiopharmaceuticals Market study offers a detailed analysis of the current COVID-19 pandemic impact on the market growth and its influence on the future growth of the Radiopharmaceuticals Market. The recently published report demonstrates the elevation in the demand for the healthcare sector. The healthcare manufacturers have experienced long term as well as short term effect which includes supply shortages, panic buying, and stocking, regulation changes as short-term whereas approval delays and possible trend variations in consumption could be perceived as long-term impacts of COVID-19 on the health and pharmaceutical market.
The increasing need for a cure has pushed vaccine research and manufacturers to the limit. In addition to this, panic conditions have already spurred the demand for many healthcare products and services which are discussed in detail in this report. Moreover, the impact of COVID-19 on overall market revenue for the base year 2020 and its projection up to 2027 is provided in detail in this report.
Radiopharmaceuticals Market Segment Overview
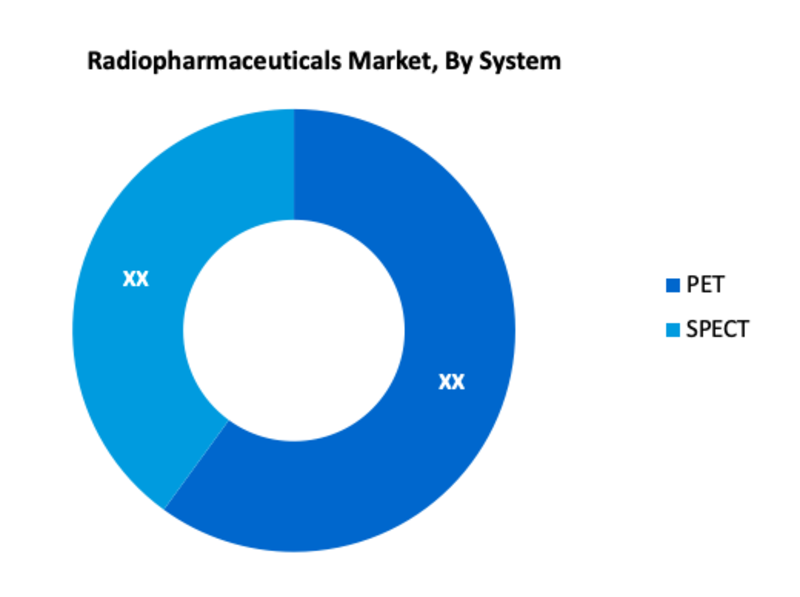
According to the System, PET is one of the largest segments in the global Radiopharmaceuticals market. As the global prevalence of cancer rises, so does the demand for PET imaging to provide appropriate treatment. The PET/PET-CT test aids in the diagnosis of cancer and provides additional information, such as whether a tumor is benign or malignant and how well it responds to treatment. This imaging modality is particularly sensitive in detecting malignant tissues and has a high specificity, which is the primary reason for fewer ambiguous scans and improved diagnostic outcomes. The need for radiopharmaceuticals compounds is propelled by this.
Radiopharmaceuticals Market, By Compound
· Fluorine-18 Derivatives
· Technetium-99
· Lutetium [Lu] 177
· Gallium-68
· Zirconium 89
· 11C-choline
· 14C-urea
· Others
Radiopharmaceuticals Market, By System
· PET
· SPECT
Radiopharmaceuticals Market, By Indication
· Oncology
· Neurology
· Cardiology
· Others
Radiopharmaceuticals Market, By End-user
· Hospitals
· Diagnostic Labs
· Others
Radiopharmaceuticals Market Regional Overview
Geographically, North America holds a dominant position in the market and going forward too will likely retain its stronghold. In 2020, the United States accounted for the majority of the radiopharmaceuticals market in North America. During the forecast period, the country is expected to maintain its market share. The United States' dominance in the radiopharmaceuticals market in the region can be due to its well-established healthcare infrastructure and early adoption of modern imaging equipment. During the forecast period, Asia Pacific is expected to acquire market share. Product launches, acquisitions, distribution agreements, collaborations, and geographic expansion by competitors are likely to boost the radiopharmaceuticals market in the region, particularly in China and India.
Radiopharmaceuticals Market, By Geography
· North America (US & Canada)
· Europe (UK, Germany, France, Italy, Spain, Russia & Rest of Europe)
· Asia-Pacific (Japan, China, India, Australia, & South Korea, & Rest of Asia-Pacific)
· LAMEA (Brazil, Saudi Arabia, UAE & Rest of LAMEA)
Radiopharmaceuticals Market, Key Players
· Siemens Healthineers
· GE Healthcare
· Advanced Accelerator Applications (a Novartis AG Company)
· Jubilant Pharma Limited
· Bayer AG
· ITM Isotopen Technologien München AG
· Telix Pharmaceuticals
· Lantheus Holdings, Inc.
· Eli Lilly and Company
· Nihon Medi-Physics
· Avanos Medical, Inc.
Frequently Asked Questions (FAQ) :
Q1. Which Segments are covered in the Radiopharmaceuticals Market report?
Compound, System, Indication, End-user, and Region these segments are covered in the Radiopharmaceuticals market report.
Q2. Which are the parts of the Indication segment in the Radiopharmaceuticals market?
Oncology, Neurology, Cardiology, Others are parts of the end-use industry segment in the Radiopharmaceuticals market
Q3. Which segment is projected to hold the largest share in the Radiopharmaceuticals Market?
The PET segment is projected to hold the largest share in the Radiopharmaceuticals Market
Q4. Which region holds the largest share in the Radiopharmaceuticals market?
North America held the largest share in the global Radiopharmaceuticals market
Q5. Which are the prominent players in the Radiopharmaceuticals Market?
Siemens Healthineers, GE Healthcare, Advanced Accelerator Applications (a Novartis AG Company), Jubilant Pharma Limited, Bayer AG, ITM Isotopen Technologien München AG, Telix Pharmaceuticals, Lantheus Holdings, Inc., Eli Lilly and Company, Nihon Medi-Physics, Avanos Medical, Inc. are some key players in the Radiopharmaceuticals Market.
List of Figures
Figure 1: Global Radiopharmaceuticals Market Revenue Breakdown (USD Billion, %) by Region, 2019 & 2027
Figure 2: Global Radiopharmaceuticals Market Value Share (%), By Segment 1, 2019 & 2027
Figure 3: Global Radiopharmaceuticals Market Forecast (USD Billion), by Sub-Segment 1, 2016-2027
Figure 4: Global Radiopharmaceuticals Market Forecast (USD Billion), by Sub-Segment 2, 2016-2027
Figure 5: Global Radiopharmaceuticals Market Value Share (%), By Segment 2, 2019 & 2027
Figure 6: Global Radiopharmaceuticals Market Forecast (USD Billion), by Sub-Segment 1, 2016-2027
Figure 7: Global Radiopharmaceuticals Market Forecast (USD Billion), by Sub-Segment 2, 2016-2027
Figure 8: Global Radiopharmaceuticals Market Forecast (USD Billion), by Sub-Segment 3, 2016-2027
Figure 9: Global Radiopharmaceuticals Market Forecast (USD Billion), by Others, 2016-2027
Figure 10: Global Radiopharmaceuticals Market Value Share (%), By Segment 3, 2019 & 2027
Figure 11: Global Radiopharmaceuticals Market Forecast (USD Billion), by Sub-Segment 1, 2016-2027
Figure 12: Global Radiopharmaceuticals Market Forecast (USD Billion), by Sub-Segment 2, 2016-2027
Figure 13: Global Radiopharmaceuticals Market Forecast (USD Billion), by Sub-Segment 3, 2016-2027
Figure 14: Global Radiopharmaceuticals Market Forecast (USD Billion), by Others, 2016-2027
Figure 15: Global Radiopharmaceuticals Market Value (USD Billion), by Region, 2019 & 2027
Figure 16: North America Radiopharmaceuticals Market Value Share (%), By Segment 1, 2019 & 2027
Figure 17: North America Radiopharmaceuticals Market Forecast (USD Billion), by Sub-Segment 1, 2016-2027
Figure 18: North America Radiopharmaceuticals Market Forecast (USD Billion), by Sub-Segment 2, 2016-2027
Figure 19: North America Radiopharmaceuticals Market Value Share (%), By Segment 2, 2019 & 2027
Figure 20: North America Radiopharmaceuticals Market Forecast (USD Billion), by Sub-Segment 1, 2016-2027
Figure 21: North America Radiopharmaceuticals Market Forecast (USD Billion), by Sub-Segment 2, 2016-2027
Figure 22: North America Radiopharmaceuticals Market Forecast (USD Billion), by Sub-Segment 3, 2016-2027
Figure 23: North America Radiopharmaceuticals Market Forecast (USD Billion), by Others, 2016-2027
Figure 24: North America Radiopharmaceuticals Market Value Share (%), By Segment 3, 2019 & 2027
Figure 25: North America Radiopharmaceuticals Market Forecast (USD Billion), by Sub-Segment 1, 2016-2027
Figure 26: North America Radiopharmaceuticals Market Forecast (USD Billion), by Sub-Segment 2, 2016-2027
Figure 27: North America Radiopharmaceuticals Market Forecast (USD Billion), by Sub-Segment 3, 2016-2027
Figure 28: North America Radiopharmaceuticals Market Forecast (USD Billion), by Others, 2016-2027
Figure 29: North America Radiopharmaceuticals Market Forecast (USD Billion), by U.S., 2016-2027
Figure 30: North America Radiopharmaceuticals Market Forecast (USD Billion), by Canada, 2016-2027
Figure 31: Latin America Radiopharmaceuticals Market Value Share (%), By Segment 1, 2019 & 2027
Figure 32: Latin America Radiopharmaceuticals Market Forecast (USD Billion), by Sub-Segment 1, 2016-2027
Figure 33: Latin America Radiopharmaceuticals Market Forecast (USD Billion), by Sub-Segment 2, 2016-2027
Figure 34: Latin America Radiopharmaceuticals Market Value Share (%), By Segment 2, 2019 & 2027
Figure 35: Latin America Radiopharmaceuticals Market Forecast (USD Billion), by Sub-Segment 1, 2016-2027
Figure 36: Latin America Radiopharmaceuticals Market Forecast (USD Billion), by Sub-Segment 2, 2016-2027
Figure 37: Latin America Radiopharmaceuticals Market Forecast (USD Billion), by Sub-Segment 3, 2016-2027
Figure 38: Latin America Radiopharmaceuticals Market Forecast (USD Billion), by Others, 2016-2027
Figure 39: Latin America Radiopharmaceuticals Market Value Share (%), By Segment 3, 2019 & 2027
Figure 40: Latin America Radiopharmaceuticals Market Forecast (USD Billion), by Sub-Segment 1, 2016-2027
Figure 41: Latin America Radiopharmaceuticals Market Forecast (USD Billion), by Sub-Segment 2, 2016-2027
Figure 42: Latin America Radiopharmaceuticals Market Forecast (USD Billion), by Sub-Segment 3, 2016-2027
Figure 43: Latin America Radiopharmaceuticals Market Forecast (USD Billion), by Others, 2016-2027
Figure 44: Latin America Radiopharmaceuticals Market Forecast (USD Billion), by Brazil, 2016-2027
Figure 45: Latin America Radiopharmaceuticals Market Forecast (USD Billion), by Mexico, 2016-2027
Figure 46: Latin America Radiopharmaceuticals Market Forecast (USD Billion), by Rest of Latin America, 2016-2027
Figure 47: Europe Radiopharmaceuticals Market Value Share (%), By Segment 1, 2019 & 2027
Figure 48: Europe Radiopharmaceuticals Market Forecast (USD Billion), by Sub-Segment 1, 2016-2027
Figure 49: Europe Radiopharmaceuticals Market Forecast (USD Billion), by Sub-Segment 2, 2016-2027
Figure 50: Europe Radiopharmaceuticals Market Value Share (%), By Segment 2, 2019 & 2027
Figure 51: Europe Radiopharmaceuticals Market Forecast (USD Billion), by Sub-Segment 1, 2016-2027
Figure 52: Europe Radiopharmaceuticals Market Forecast (USD Billion), by Sub-Segment 2, 2016-2027
Figure 53: Europe Radiopharmaceuticals Market Forecast (USD Billion), by Sub-Segment 3, 2016-2027
Figure 54: Europe Radiopharmaceuticals Market Forecast (USD Billion), by Others, 2016-2027
Figure 55: Europe Radiopharmaceuticals Market Value Share (%), By Segment 3, 2019 & 2027
Figure 56: Europe Radiopharmaceuticals Market Forecast (USD Billion), by Sub-Segment 1, 2016-2027
Figure 57: Europe Radiopharmaceuticals Market Forecast (USD Billion), by Sub-Segment 2, 2016-2027
Figure 58: Europe Radiopharmaceuticals Market Forecast (USD Billion), by Sub-Segment 3, 2016-2027
Figure 59: Europe Radiopharmaceuticals Market Forecast (USD Billion), by Others, 2016-2027
Figure 60: Europe Radiopharmaceuticals Market Forecast (USD Billion), by U.K., 2016-2027
Figure 61: Europe Radiopharmaceuticals Market Forecast (USD Billion), by Germany, 2016-2027
Figure 62: Europe Radiopharmaceuticals Market Forecast (USD Billion), by France, 2016-2027
Figure 63: Europe Radiopharmaceuticals Market Forecast (USD Billion), by Italy, 2016-2027
Figure 64: Europe Radiopharmaceuticals Market Forecast (USD Billion), by Spain, 2016-2027
Figure 65: Europe Radiopharmaceuticals Market Forecast (USD Billion), by Russia, 2016-2027
Figure 66: Europe Radiopharmaceuticals Market Forecast (USD Billion), by Rest of Europe, 2016-2027
Figure 67: Asia Pacific Radiopharmaceuticals Market Value Share (%), By Segment 1, 2019 & 2027
Figure 68: Asia Pacific Radiopharmaceuticals Market Forecast (USD Billion), by Sub-Segment 1, 2016-2027
Figure 69: Asia Pacific Radiopharmaceuticals Market Forecast (USD Billion), by Sub-Segment 2, 2016-2027
Figure 70: Asia Pacific Radiopharmaceuticals Market Value Share (%), By Segment 2, 2019 & 2027
Figure 71: Asia Pacific Radiopharmaceuticals Market Forecast (USD Billion), by Sub-Segment 1, 2016-2027
Figure 72: Asia Pacific Radiopharmaceuticals Market Forecast (USD Billion), by Sub-Segment 2, 2016-2027
Figure 73: Asia Pacific Radiopharmaceuticals Market Forecast (USD Billion), by Sub-Segment 3, 2016-2027
Figure 74: Asia Pacific Radiopharmaceuticals Market Forecast (USD Billion), by Others, 2016-2027
Figure 75: Asia Pacific Radiopharmaceuticals Market Value Share (%), By Segment 3, 2019 & 2027
Figure 76: Asia Pacific Radiopharmaceuticals Market Forecast (USD Billion), by Sub-Segment 1, 2016-2027
Figure 77: Asia Pacific Radiopharmaceuticals Market Forecast (USD Billion), by Sub-Segment 2, 2016-2027
Figure 78: Asia Pacific Radiopharmaceuticals Market Forecast (USD Billion), by Sub-Segment 3, 2016-2027
Figure 79: Asia Pacific Radiopharmaceuticals Market Forecast (USD Billion), by Others, 2016-2027
Figure 80: Asia Pacific Radiopharmaceuticals Market Forecast (USD Billion), by China, 2016-2027
Figure 81: Asia Pacific Radiopharmaceuticals Market Forecast (USD Billion), by India, 2016-2027
Figure 82: Asia Pacific Radiopharmaceuticals Market Forecast (USD Billion), by Japan, 2016-2027
Figure 83: Asia Pacific Radiopharmaceuticals Market Forecast (USD Billion), by Australia, 2016-2027
Figure 84: Asia Pacific Radiopharmaceuticals Market Forecast (USD Billion), by Southeast Asia, 2016-2027
Figure 85: Asia Pacific Radiopharmaceuticals Market Forecast (USD Billion), by Rest of Asia Pacific, 2016-2027
Figure 86: Middle East & Africa Radiopharmaceuticals Market Value Share (%), By Segment 1, 2019 & 2027
Figure 87: Middle East & Africa Radiopharmaceuticals Market Forecast (USD Billion), by Sub-Segment 1, 2016-2027
Figure 88: Middle East & Africa Radiopharmaceuticals Market Forecast (USD Billion), by Sub-Segment 2, 2016-2027
Figure 89: Middle East & Africa Radiopharmaceuticals Market Value Share (%), By Segment 2, 2019 & 2027
Figure 90: Middle East & Africa Radiopharmaceuticals Market Forecast (USD Billion), by Sub-Segment 1, 2016-2027
Figure 91: Middle East & Africa Radiopharmaceuticals Market Forecast (USD Billion), by Sub-Segment 2, 2016-2027
Figure 92: Middle East & Africa Radiopharmaceuticals Market Forecast (USD Billion), by Sub-Segment 3, 2016-2027
Figure 93: Middle East & Africa Radiopharmaceuticals Market Forecast (USD Billion), by Others, 2016-2027
Figure 94: Middle East & Africa Radiopharmaceuticals Market Value Share (%), By Segment 3, 2019 & 2027
Figure 95: Middle East & Africa Radiopharmaceuticals Market Forecast (USD Billion), by Sub-Segment 1, 2016-2027
Figure 96: Middle East & Africa Radiopharmaceuticals Market Forecast (USD Billion), by Sub-Segment 2, 2016-2027
Figure 97: Middle East & Africa Radiopharmaceuticals Market Forecast (USD Billion), by Sub-Segment 3, 2016-2027
Figure 98: Middle East & Africa Radiopharmaceuticals Market Forecast (USD Billion), by Others, 2016-2027
Figure 99: Middle East & Africa Radiopharmaceuticals Market Forecast (USD Billion), by GCC, 2016-2027
Figure 100: Middle East & Africa Radiopharmaceuticals Market Forecast (USD Billion), by South Africa, 2016-2027
Figure 101: Middle East & Africa Radiopharmaceuticals Market Forecast (USD Billion), by Rest of Middle East & Africa, 2016-2027
List of Tables
Table 1: Global Radiopharmaceuticals Market Revenue (USD Billion) Forecast, by Segment 1, 2016-2027
Table 2: Global Radiopharmaceuticals Market Revenue (USD Billion) Forecast, by Segment 2, 2016-2027
Table 3: Global Radiopharmaceuticals Market Revenue (USD Billion) Forecast, by Segment 3, 2016-2027
Table 4: Global Radiopharmaceuticals Market Revenue (USD Billion) Forecast, by Region, 2016-2027
Table 5: North America Radiopharmaceuticals Market Revenue (USD Billion) Forecast, by Segment 1, 2016-2027
Table 6: North America Radiopharmaceuticals Market Revenue (USD Billion) Forecast, by Segment 2, 2016-2027
Table 7: North America Radiopharmaceuticals Market Revenue (USD Billion) Forecast, by Segment 3, 2016-2027
Table 8: North America Radiopharmaceuticals Market Revenue (USD Billion) Forecast, by Country, 2016-2027
Table 9: Europe Radiopharmaceuticals Market Revenue (USD Billion) Forecast, by Segment 1, 2016-2027
Table 10: Europe Radiopharmaceuticals Market Revenue (USD Billion) Forecast, by Segment 2, 2016-2027
Table 11: Europe Radiopharmaceuticals Market Revenue (USD Billion) Forecast, by Segment 3, 2016-2027
Table 12: Europe Radiopharmaceuticals Market Revenue (USD Billion) Forecast, by Country, 2016-2027
Table 13: Latin America Radiopharmaceuticals Market Revenue (USD Billion) Forecast, by Segment 1, 2016-2027
Table 14: Latin America Radiopharmaceuticals Market Revenue (USD Billion) Forecast, by Segment 2, 2016-2027
Table 15: Latin America Radiopharmaceuticals Market Revenue (USD Billion) Forecast, by Segment 3, 2016-2027
Table 16: Latin America Radiopharmaceuticals Market Revenue (USD Billion) Forecast, by Country, 2016-2027
Table 17: Asia Pacific Radiopharmaceuticals Market Revenue (USD Billion) Forecast, by Segment 1, 2016-2027
Table 18: Asia Pacific Radiopharmaceuticals Market Revenue (USD Billion) Forecast, by Segment 2, 2016-2027
Table 19: Asia Pacific Radiopharmaceuticals Market Revenue (USD Billion) Forecast, by Segment 3, 2016-2027
Table 20: Asia Pacific Radiopharmaceuticals Market Revenue (USD Billion) Forecast, by Country, 2016-2027
Table 21: Middle East & Africa Radiopharmaceuticals Market Revenue (USD Billion) Forecast, by Segment 1, 2016-2027
Table 22: Middle East & Africa Radiopharmaceuticals Market Revenue (USD Billion) Forecast, by Segment 2, 2016-2027
Table 23: Middle East & Africa Radiopharmaceuticals Market Revenue (USD Billion) Forecast, by Segment 3, 2016-2027
Table 24: Middle East & Africa Radiopharmaceuticals Market Revenue (USD Billion) Forecast, by Country, 2016-2027
Research Process
Data Library Research are conducted by industry experts who offer insight on
industry structure, market segmentations technology assessment and competitive landscape (CL), and penetration, as well as on emerging trends. Their analysis is based on primary interviews (~ 80%) and secondary research (~ 20%) as well as years of professional expertise in their respective industries. Adding to this, by analysing historical trends and current market positions, our analysts predict where the market will be headed for the next five years. Furthermore, the varying trends of segment & categories geographically presented are also studied and the estimated based on the primary & secondary research.
In this particular report from the supply side Data Library Research has conducted primary surveys (interviews) with the key level executives (VP, CEO’s, Marketing Director, Business Development Manager
and SOFT) of the companies that active & prominent as well as the midsized organization
FIGURE 1: DLR RESEARH PROCESS
![research-methodology1]()
Primary Research
Extensive primary research was conducted to gain a deeper insight of the market and industry performance. The analysis is based on both primary and secondary research as well as years of professional expertise in the respective industries.
In addition to analysing current and historical trends, our analysts predict where the market is headed over the next five years.
It varies by segment for these categories geographically presented in the list of market tables. Speaking about this particular report we have conducted primary surveys (interviews) with the key level executives (VP, CEO’s, Marketing Director, Business Development Manager and many more) of the major players active in the market.
Secondary Research
Secondary research was mainly used to collect and identify information useful for the extensive, technical, market-oriented, and Friend’s study of the Global Extra Neutral Alcohol. It was also used to obtain key information about major players, market classification and segmentation according to the industry trends, geographical markets, and developments related to the market and technology perspectives. For this study, analysts have gathered information from various credible sources, such as annual reports, sec filings, journals, white papers, SOFT presentations, and company web sites.
Market Size Estimation
Both, top-down and bottom-up approaches were used to estimate and validate the size of the Global market and to estimate the size of various other dependent submarkets in the overall Extra Neutral Alcohol. The key players in the market were identified through secondary research and their market contributions in the respective geographies were determined through primary and secondary research.
Forecast Model
![research-methodology2]()