Rare Kidney Diseases Treatment Market Overview and Analysis
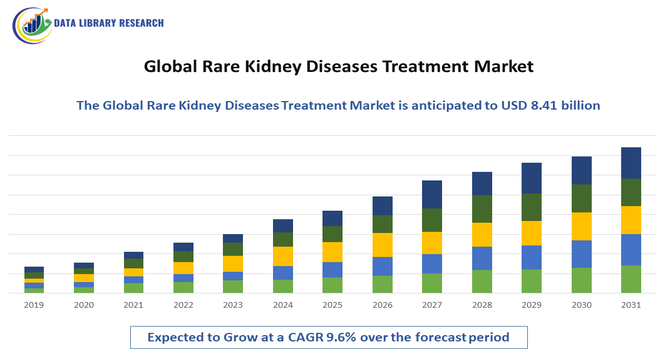
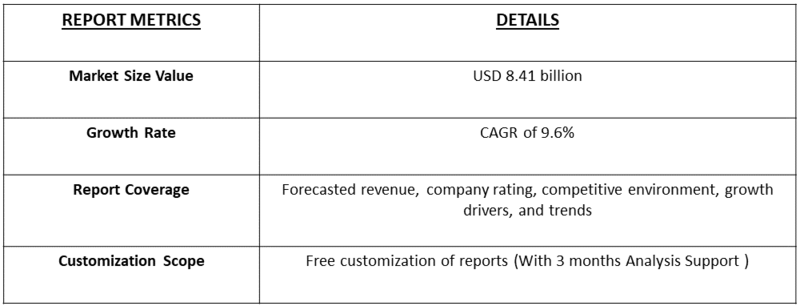
- The rare kidney disease treatment market is a growing and promising sector, valued at around USD 2.76 billion in 2025 and projected to grow at a CAGR of 9.6% 2025 to 2032, to reach USD 8.41 billion by 2032.
Get Complete Analysis Of The Report - Download Updated Free Sample PDF
The Global Rare Kidney Diseases Treatment Market is experiencing robust growth, primarily driven by the increasing prevalence of rare kidney disorders such as Alport syndrome, Fabry disease, and atypical hemolytic uremic syndrome (aHUS). Rising awareness and improved diagnostic capabilities are leading to earlier detection and intervention, fueling demand for targeted therapies and precision medicine. Moreover, advancements in biotechnology, including gene therapy and enzyme replacement therapy, are creating new treatment possibilities for previously untreatable conditions. Supportive government initiatives, orphan drug designations, and growing R&D investments by pharmaceutical companies are further accelerating market expansion.
Rare Kidney Diseases Treatment Market Latest Trends
The Global Rare Kidney Diseases Treatment Market is witnessing several emerging trends that are reshaping its landscape. One of the key trends is the growing shift toward precision medicine and gene-based therapies, enabling personalized treatment approaches tailored to the genetic causes of rare kidney disorders such as Fabry disease and Alport syndrome. There is a surge in orphan drug approvals and a robust R&D pipeline, supported by favorable regulatory frameworks and incentives for rare disease research. Advancements in genomics, biomarker discovery, and molecular diagnostics are improving early detection and enabling more targeted interventions. Pharmaceutical companies are increasingly engaging in strategic collaborations, licensing partnerships, and mergers to accelerate drug development and expand access to innovative therapies.
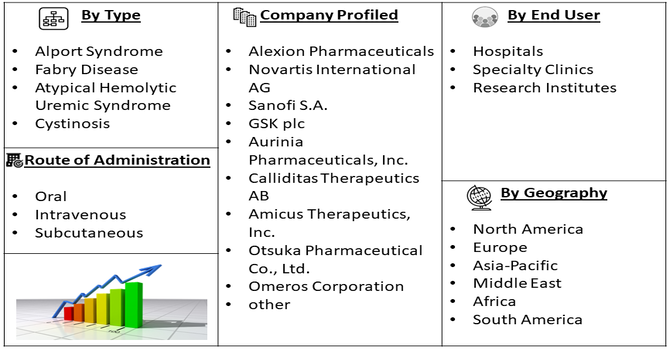
Segmentation: Global Rare Kidney Diseases Treatment Market is segmented By Disease Type (Alport Syndrome, Fabry Disease, Atypical Hemolytic Uremic Syndrome, Cystinosis), Treatment Type (Enzyme Replacement Therapy, Gene Therapy, Supportive Drug Therapy), Route of Administration (Oral, Intravenous, Subcutaneous), End User (Hospitals, Specialty Clinics, Research Institutes), and Geography (North America, Europe, Asia-Pacific, Middle East and Africa, and South America). The report provides the value (in USD million) for the above segments.
For Detailed Market Segmentation - Get a Free Sample PDF
Market Drivers:
- Increasing Prevalence and Early Diagnosis of Rare Kidney Disorders
The rising incidence of rare kidney diseases such as Alport syndrome, Fabry disease, and atypical hemolytic uremic syndrome (aHUS) is a major driver of the global market. Improved awareness among healthcare professionals and patients, coupled with advancements in genetic testing and molecular diagnostics, has significantly enhanced early detection rates. For instance, in July 2025, an article publ;ished by NCBI reported that, Rare kidney diseases affected roughly 60 to 80 people per 100,000 in Europe and the United States and accounted for over 25% of adults and more than 50% of children requiring kidney replacement therapy. This rising prevalence and improved early diagnosis heightened clinical urgency, driving demand for advanced treatments and boosting North America’s rare kidney diseases treatment market by increasing investment, expanding research efforts, and accelerating adoption of targeted therapies.
- Advancements in Biopharmaceutical Research and Availability of Targeted Therapies
Rapid progress in biopharmaceutical R&D is another key driver accelerating the growth of the rare kidney disease treatment market. Breakthroughs in gene therapy, enzyme replacement therapy (ERT), RNA-based therapeutics, and monoclonal antibodies have opened new therapeutic avenues for conditions that were once untreatable. For instance, in April 2024, a new research center co-funded by Kidney Research UK and LifeArc was established to improve diagnostics, treatments, and potential cures for rare kidney diseases. Building on resources like RaDaR, NURTuRE, and clinical guidelines, it united researchers, clinicians, and patients while strengthening research networks across all 13 UK children’s kidney centers. This initiative advanced innovation, collaboration, and therapeutic development, positively impacting the global rare kidney diseases treatment market.
Market Restraints:
- High Cost of Treatment and Limited Affordability
The primary challenges is the high cost of treatment and limited affordability, as therapies such as enzyme replacement therapy (ERT) and gene therapy often cost hundreds of thousands of dollars per patient annually. This makes access difficult in low- and middle-income regions, where healthcare reimbursement systems are less developed. Many patients remain undiagnosed or misdiagnosed for years due to the rarity of these conditions, overlapping symptoms with common renal disorders, and a shortage of specialized diagnostic facilities and genetic testing capabilities—especially in developing nations.
Socio-Economic Impact on Rare Kidney Diseases Treatment Market
The global rare kidney diseases treatment market has had a meaningful socioeconomic impact by improving access to specialized therapies for patients who previously had limited options. Advances in diagnostics and treatment have helped people live longer, healthier lives, reducing the overall burden on families and healthcare systems. The market’s growth has also encouraged investment in research, creating high-skilled jobs and driving medical innovation. However, the high cost of rare disease treatments can strain healthcare budgets and create inequalities in access, especially in low-income regions. Thus, the market has supported better patient outcomes while highlighting the need for affordable, equitable care worldwide.
Segmental Analysis:
- Fabry Disease segment is expected to witness the highest growth over the forecast period
The Fabry disease segment holds a significant share of the market owing to the increasing availability of enzyme replacement therapies (ERTs) and ongoing advancements in gene therapy research. Fabry disease, a rare X-linked lysosomal storage disorder, has gained attention due to the approval of targeted treatments such as agalsidase beta and migalastat. The growth of this segment is further driven by enhanced diagnostic capabilities using genetic screening and biomarker identification. Increasing patient awareness and expanded newborn screening programs in developed countries have contributed to early detection and treatment, thereby accelerating market expansion.
- Gene Therapy segment is expected to witness the highest growth over the forecast period
The gene therapy segment is anticipated to register the fastest growth over the forecast period. This growth is attributed to the rising number of clinical trials and technological advancements in gene-editing tools such as CRISPR-Cas9 and AAV vectors. Gene therapy offers long-term or potentially curative solutions by correcting the underlying genetic mutations responsible for rare kidney disorders. Strong regulatory support for orphan drug development and growing pharmaceutical partnerships are also enhancing this segment’s potential. The ability of gene therapy to reduce dependency on lifelong treatments such as ERT positions it as a major breakthrough in the rare kidney disease treatment landscape.
- Intravenous (IV) segment is expected to witness the highest growth over the forecast period
The intravenous (IV) route dominates the market, primarily due to its effectiveness in delivering biologics, enzyme replacement therapies, and monoclonal antibodies directly into the bloodstream. IV administration ensures rapid and complete bioavailability, which is crucial for managing progressive kidney disorders. Hospitals and specialty clinics commonly use this route for complex treatment protocols requiring professional supervision. Furthermore, continuous improvements in infusion technologies and patient monitoring are making IV treatments more efficient and accessible.
- Hospitals segment is expected to witness the highest growth over the forecast period
The hospital segment accounts for the largest market share due to the availability of advanced diagnostic equipment, specialized nephrology departments, and integrated care infrastructure. Hospitals serve as primary centers for administering enzyme and gene therapies that require close clinical oversight. Additionally, increased funding for hospital-based rare disease centers, especially in North America and Europe, supports better access to innovative treatments. The presence of multidisciplinary teams and patient registry collaborations in hospitals further enhances patient management and research outcomes.
- North America is expected to witness the highest growth over the forecast period
North America dominates the global market and is expected to continue its leadership over the forecast period. The region’s growth is driven by high healthcare expenditure, advanced biotechnology infrastructure, and strong regulatory frameworks supporting orphan drug development.
The United States, in particular, benefits from a large number of FDA-approved therapies for rare kidney disorders and a robust clinical trial network. For instance, in October 2025, Roche announced that the FDA approved Gazyva/Gazyvaro for adults with active lupus nephritis receiving standard therapy, along with a shortened 90-minute infusion time after the first dose. With four initial doses in the first year followed by twice-yearly treatments, it offered a more convenient and effective option than traditional therapies. This approval strengthened the global rare kidney diseases treatment market by expanding advanced therapeutic choices and improving long-term care accessibility.
Furthermore, the presence of major pharmaceutical and biotech players, along with patient advocacy organizations, contributes to better awareness, early diagnosis, and treatment adoption. For instance, in July 2022, Ionis Pharmaceuticals announced that Roche licensed and advanced IONIS-FB-LRx into Phase 3 trials for IgA nephropathy following positive Phase 2 results showing significant reductions in 24-hour urinary protein. Roche’s commitment demonstrated strong involvement from major pharmaceutical and biotech players, reinforcing North America’s rare kidney diseases treatment market by accelerating the development of advanced therapies, increasing investment, and expanding access to innovative treatment options for high-risk kidney conditions.
To Learn More About This Report - Request a Free Sample Copy
Rare Kidney Diseases Treatment Market Competitive Landscape:
The global rare kidney diseases treatment space is increasingly competitive, featuring a diverse mix of large pharmaceutical companies, biotech firms specializing in orphan and ultra-orphan conditions, and emerging gene-therapy players. Competitive dynamics are shaped by orphan drug designations, breakthrough therapy pathways, collaborations between large pharmas and niche biotech, and geographic market expansion into emerging regions. Companies focus on building pipelines for rare nephrology indications such as IgA Nephropathy (IgAN), Fabry Disease, Alport Syndrome and Atypical Hemolytic Uremic Syndrome (aHUS).
Below is a list of 20 companies operating in this market.
- Alexion Pharmaceuticals
- Novartis International AG
- Sanofi S.A.
- GSK plc
- Aurinia Pharmaceuticals, Inc.
- Calliditas Therapeutics AB
- Amicus Therapeutics, Inc.
- Otsuka Pharmaceutical Co., Ltd.
- Reata Pharmaceuticals, Inc.
- Travere Therapeutics, Inc.
- Advicenne Pharma SA
- Apellis Pharmaceuticals, Inc.
- Chinook Therapeutics, Inc.
- Omeros Corporation
- Horizon Therapeutics plc
- Kyowa Kirin Co., Ltd.
- Astellas Pharma Inc.
- Takeda Pharmaceutical Company Limited
- Protalix BioTherapeutics, Inc.
- ENYO Pharma SA
Recent Developments
- In November 2025, Biogen presented new data from its felzartamab clinical programs at Kidney Week 2025. The investigational anti-CD38 antibody was being studied in three Phase 3 trials for multiple kidney conditions, with the first results expected in 2027 from the TRANSCEND study in adults with late antibody-mediated rejection. This progress advanced innovation and investment in the global rare kidney diseases treatment market by highlighting promising targeted therapies and expanding future treatment options.
- In October 2025, Novartis reported positive final Phase III APPLAUSE-IgAN results showing that Fabhalta significantly slowed eGFR decline in adults with IgA nephropathy over two years. As an oral complement pathway inhibitor, it offered meaningful clinical benefits and hope for improved long-term kidney function. These findings strengthened the global rare kidney diseases treatment market by advancing targeted therapies, supporting 2026 regulatory submissions, and expanding Novartis’s broader IgAN treatment portfolio.
Frequently Asked Questions (FAQ) :
Q1. What are the main growth-driving factors for this market?
Key drivers include increasing government funding and support for rare disease research, especially through "orphan drug" designations that offer incentives to drug makers. Better and earlier diagnostic tools are also crucial, leading to higher rates of disease recognition. Furthermore, the global rise in the elderly population contributes to a larger patient pool requiring complex treatments.
Q2. What are the main restraining factors for this market?
The market is held back by the high cost of developing specialized, rare disease drugs, making final treatments very expensive. Limited awareness among general healthcare providers often causes delayed diagnosis. Additionally, the small number of patients makes clinical trials difficult to organize, slowing down the regulatory approval process for new therapies.
Q3. Which segment is expected to witness high growth?
The biologic drugs segment, particularly monoclonal antibodies and emerging gene therapies, is predicted to see the fastest growth. These advanced treatments offer higher precision for complex genetic kidney conditions. By specific disease, indications like Lupus Nephritis and Fabry Disease are also expected to drive high demand due to increased diagnosis and newly approved targeted treatments.
Q4. Who are the top major players for this market?
Major players are often large pharmaceutical companies with strong specialty pipelines. Key companies include Alexion Pharmaceuticals (now AstraZeneca), GlaxoSmithKline (GSK), Novartis, and Travere Therapeutics. These companies focus on developing and commercializing orphan drugs for indications such as Fabry Disease, atypical Hemolytic Uremic Syndrome, and IgA Nephropathy.
Q5. Which country is the largest player?
North America, driven primarily by the United States, holds the largest market share globally. This leadership is due to its advanced healthcare infrastructure, high healthcare spending, and favorable reimbursement policies for expensive specialty drugs. However, the Asia-Pacific region is quickly becoming the fastest-growing market, boosted by rising patient awareness and improving medical facilities.
List of Figures
Figure 1: Global Rare Kidney Diseases Treatment Market Revenue Breakdown (USD Billion, %) by Region, 2022 & 2029
Figure 2: Global Rare Kidney Diseases Treatment Market Value Share (%), By Segment 1, 2022 & 2029
Figure 3: Global Rare Kidney Diseases Treatment Market Forecast (USD Billion), by Sub-Segment 1, 2018-2029
Figure 4: Global Rare Kidney Diseases Treatment Market Forecast (USD Billion), by Sub-Segment 2, 2018-2029
Figure 5: Global Rare Kidney Diseases Treatment Market Value Share (%), By Segment 2, 2022 & 2029
Figure 6: Global Rare Kidney Diseases Treatment Market Forecast (USD Billion), by Sub-Segment 1, 2018-2029
Figure 7: Global Rare Kidney Diseases Treatment Market Forecast (USD Billion), by Sub-Segment 2, 2018-2029
Figure 8: Global Rare Kidney Diseases Treatment Market Forecast (USD Billion), by Sub-Segment 3, 2018-2029
Figure 9: Global Rare Kidney Diseases Treatment Market Forecast (USD Billion), by Others, 2018-2029
Figure 10: Global Rare Kidney Diseases Treatment Market Value Share (%), By Segment 3, 2022 & 2029
Figure 11: Global Rare Kidney Diseases Treatment Market Forecast (USD Billion), by Sub-Segment 1, 2018-2029
Figure 12: Global Rare Kidney Diseases Treatment Market Forecast (USD Billion), by Sub-Segment 2, 2018-2029
Figure 13: Global Rare Kidney Diseases Treatment Market Forecast (USD Billion), by Sub-Segment 3, 2018-2029
Figure 14: Global Rare Kidney Diseases Treatment Market Forecast (USD Billion), by Others, 2018-2029
Figure 15: Global Rare Kidney Diseases Treatment Market Value (USD Billion), by Region, 2022 & 2029
Figure 16: North America Rare Kidney Diseases Treatment Market Value Share (%), By Segment 1, 2022 & 2029
Figure 17: North America Rare Kidney Diseases Treatment Market Forecast (USD Billion), by Sub-Segment 1, 2018-2029
Figure 18: North America Rare Kidney Diseases Treatment Market Forecast (USD Billion), by Sub-Segment 2, 2018-2029
Figure 19: North America Rare Kidney Diseases Treatment Market Value Share (%), By Segment 2, 2022 & 2029
Figure 20: North America Rare Kidney Diseases Treatment Market Forecast (USD Billion), by Sub-Segment 1, 2018-2029
Figure 21: North America Rare Kidney Diseases Treatment Market Forecast (USD Billion), by Sub-Segment 2, 2018-2029
Figure 22: North America Rare Kidney Diseases Treatment Market Forecast (USD Billion), by Sub-Segment 3, 2018-2029
Figure 23: North America Rare Kidney Diseases Treatment Market Forecast (USD Billion), by Others, 2018-2029
Figure 24: North America Rare Kidney Diseases Treatment Market Value Share (%), By Segment 3, 2022 & 2029
Figure 25: North America Rare Kidney Diseases Treatment Market Forecast (USD Billion), by Sub-Segment 1, 2018-2029
Figure 26: North America Rare Kidney Diseases Treatment Market Forecast (USD Billion), by Sub-Segment 2, 2018-2029
Figure 27: North America Rare Kidney Diseases Treatment Market Forecast (USD Billion), by Sub-Segment 3, 2018-2029
Figure 28: North America Rare Kidney Diseases Treatment Market Forecast (USD Billion), by Others, 2018-2029
Figure 29: North America Rare Kidney Diseases Treatment Market Forecast (USD Billion), by U.S., 2018-2029
Figure 30: North America Rare Kidney Diseases Treatment Market Forecast (USD Billion), by Canada, 2018-2029
Figure 31: Latin America Rare Kidney Diseases Treatment Market Value Share (%), By Segment 1, 2022 & 2029
Figure 32: Latin America Rare Kidney Diseases Treatment Market Forecast (USD Billion), by Sub-Segment 1, 2018-2029
Figure 33: Latin America Rare Kidney Diseases Treatment Market Forecast (USD Billion), by Sub-Segment 2, 2018-2029
Figure 34: Latin America Rare Kidney Diseases Treatment Market Value Share (%), By Segment 2, 2022 & 2029
Figure 35: Latin America Rare Kidney Diseases Treatment Market Forecast (USD Billion), by Sub-Segment 1, 2018-2029
Figure 36: Latin America Rare Kidney Diseases Treatment Market Forecast (USD Billion), by Sub-Segment 2, 2018-2029
Figure 37: Latin America Rare Kidney Diseases Treatment Market Forecast (USD Billion), by Sub-Segment 3, 2018-2029
Figure 38: Latin America Rare Kidney Diseases Treatment Market Forecast (USD Billion), by Others, 2018-2029
Figure 39: Latin America Rare Kidney Diseases Treatment Market Value Share (%), By Segment 3, 2022 & 2029
Figure 40: Latin America Rare Kidney Diseases Treatment Market Forecast (USD Billion), by Sub-Segment 1, 2018-2029
Figure 41: Latin America Rare Kidney Diseases Treatment Market Forecast (USD Billion), by Sub-Segment 2, 2018-2029
Figure 42: Latin America Rare Kidney Diseases Treatment Market Forecast (USD Billion), by Sub-Segment 3, 2018-2029
Figure 43: Latin America Rare Kidney Diseases Treatment Market Forecast (USD Billion), by Others, 2018-2029
Figure 44: Latin America Rare Kidney Diseases Treatment Market Forecast (USD Billion), by Brazil, 2018-2029
Figure 45: Latin America Rare Kidney Diseases Treatment Market Forecast (USD Billion), by Mexico, 2018-2029
Figure 46: Latin America Rare Kidney Diseases Treatment Market Forecast (USD Billion), by Rest of Latin America, 2018-2029
Figure 47: Europe Rare Kidney Diseases Treatment Market Value Share (%), By Segment 1, 2022 & 2029
Figure 48: Europe Rare Kidney Diseases Treatment Market Forecast (USD Billion), by Sub-Segment 1, 2018-2029
Figure 49: Europe Rare Kidney Diseases Treatment Market Forecast (USD Billion), by Sub-Segment 2, 2018-2029
Figure 50: Europe Rare Kidney Diseases Treatment Market Value Share (%), By Segment 2, 2022 & 2029
Figure 51: Europe Rare Kidney Diseases Treatment Market Forecast (USD Billion), by Sub-Segment 1, 2018-2029
Figure 52: Europe Rare Kidney Diseases Treatment Market Forecast (USD Billion), by Sub-Segment 2, 2018-2029
Figure 53: Europe Rare Kidney Diseases Treatment Market Forecast (USD Billion), by Sub-Segment 3, 2018-2029
Figure 54: Europe Rare Kidney Diseases Treatment Market Forecast (USD Billion), by Others, 2018-2029
Figure 55: Europe Rare Kidney Diseases Treatment Market Value Share (%), By Segment 3, 2022 & 2029
Figure 56: Europe Rare Kidney Diseases Treatment Market Forecast (USD Billion), by Sub-Segment 1, 2018-2029
Figure 57: Europe Rare Kidney Diseases Treatment Market Forecast (USD Billion), by Sub-Segment 2, 2018-2029
Figure 58: Europe Rare Kidney Diseases Treatment Market Forecast (USD Billion), by Sub-Segment 3, 2018-2029
Figure 59: Europe Rare Kidney Diseases Treatment Market Forecast (USD Billion), by Others, 2018-2029
Figure 60: Europe Rare Kidney Diseases Treatment Market Forecast (USD Billion), by U.K., 2018-2029
Figure 61: Europe Rare Kidney Diseases Treatment Market Forecast (USD Billion), by Germany, 2018-2029
Figure 62: Europe Rare Kidney Diseases Treatment Market Forecast (USD Billion), by France, 2018-2029
Figure 63: Europe Rare Kidney Diseases Treatment Market Forecast (USD Billion), by Italy, 2018-2029
Figure 64: Europe Rare Kidney Diseases Treatment Market Forecast (USD Billion), by Spain, 2018-2029
Figure 65: Europe Rare Kidney Diseases Treatment Market Forecast (USD Billion), by Russia, 2018-2029
Figure 66: Europe Rare Kidney Diseases Treatment Market Forecast (USD Billion), by Rest of Europe, 2018-2029
Figure 67: Asia Pacific Rare Kidney Diseases Treatment Market Value Share (%), By Segment 1, 2022 & 2029
Figure 68: Asia Pacific Rare Kidney Diseases Treatment Market Forecast (USD Billion), by Sub-Segment 1, 2018-2029
Figure 69: Asia Pacific Rare Kidney Diseases Treatment Market Forecast (USD Billion), by Sub-Segment 2, 2018-2029
Figure 70: Asia Pacific Rare Kidney Diseases Treatment Market Value Share (%), By Segment 2, 2022 & 2029
Figure 71: Asia Pacific Rare Kidney Diseases Treatment Market Forecast (USD Billion), by Sub-Segment 1, 2018-2029
Figure 72: Asia Pacific Rare Kidney Diseases Treatment Market Forecast (USD Billion), by Sub-Segment 2, 2018-2029
Figure 73: Asia Pacific Rare Kidney Diseases Treatment Market Forecast (USD Billion), by Sub-Segment 3, 2018-2029
Figure 74: Asia Pacific Rare Kidney Diseases Treatment Market Forecast (USD Billion), by Others, 2018-2029
Figure 75: Asia Pacific Rare Kidney Diseases Treatment Market Value Share (%), By Segment 3, 2022 & 2029
Figure 76: Asia Pacific Rare Kidney Diseases Treatment Market Forecast (USD Billion), by Sub-Segment 1, 2018-2029
Figure 77: Asia Pacific Rare Kidney Diseases Treatment Market Forecast (USD Billion), by Sub-Segment 2, 2018-2029
Figure 78: Asia Pacific Rare Kidney Diseases Treatment Market Forecast (USD Billion), by Sub-Segment 3, 2018-2029
Figure 79: Asia Pacific Rare Kidney Diseases Treatment Market Forecast (USD Billion), by Others, 2018-2029
Figure 80: Asia Pacific Rare Kidney Diseases Treatment Market Forecast (USD Billion), by China, 2018-2029
Figure 81: Asia Pacific Rare Kidney Diseases Treatment Market Forecast (USD Billion), by India, 2018-2029
Figure 82: Asia Pacific Rare Kidney Diseases Treatment Market Forecast (USD Billion), by Japan, 2018-2029
Figure 83: Asia Pacific Rare Kidney Diseases Treatment Market Forecast (USD Billion), by Australia, 2018-2029
Figure 84: Asia Pacific Rare Kidney Diseases Treatment Market Forecast (USD Billion), by Southeast Asia, 2018-2029
Figure 85: Asia Pacific Rare Kidney Diseases Treatment Market Forecast (USD Billion), by Rest of Asia Pacific, 2018-2029
Figure 86: Middle East & Africa Rare Kidney Diseases Treatment Market Value Share (%), By Segment 1, 2022 & 2029
Figure 87: Middle East & Africa Rare Kidney Diseases Treatment Market Forecast (USD Billion), by Sub-Segment 1, 2018-2029
Figure 88: Middle East & Africa Rare Kidney Diseases Treatment Market Forecast (USD Billion), by Sub-Segment 2, 2018-2029
Figure 89: Middle East & Africa Rare Kidney Diseases Treatment Market Value Share (%), By Segment 2, 2022 & 2029
Figure 90: Middle East & Africa Rare Kidney Diseases Treatment Market Forecast (USD Billion), by Sub-Segment 1, 2018-2029
Figure 91: Middle East & Africa Rare Kidney Diseases Treatment Market Forecast (USD Billion), by Sub-Segment 2, 2018-2029
Figure 92: Middle East & Africa Rare Kidney Diseases Treatment Market Forecast (USD Billion), by Sub-Segment 3, 2018-2029
Figure 93: Middle East & Africa Rare Kidney Diseases Treatment Market Forecast (USD Billion), by Others, 2018-2029
Figure 94: Middle East & Africa Rare Kidney Diseases Treatment Market Value Share (%), By Segment 3, 2022 & 2029
Figure 95: Middle East & Africa Rare Kidney Diseases Treatment Market Forecast (USD Billion), by Sub-Segment 1, 2018-2029
Figure 96: Middle East & Africa Rare Kidney Diseases Treatment Market Forecast (USD Billion), by Sub-Segment 2, 2018-2029
Figure 97: Middle East & Africa Rare Kidney Diseases Treatment Market Forecast (USD Billion), by Sub-Segment 3, 2018-2029
Figure 98: Middle East & Africa Rare Kidney Diseases Treatment Market Forecast (USD Billion), by Others, 2018-2029
Figure 99: Middle East & Africa Rare Kidney Diseases Treatment Market Forecast (USD Billion), by GCC, 2018-2029
Figure 100: Middle East & Africa Rare Kidney Diseases Treatment Market Forecast (USD Billion), by South Africa, 2018-2029
Figure 101: Middle East & Africa Rare Kidney Diseases Treatment Market Forecast (USD Billion), by Rest of Middle East & Africa, 2018-2029
List of Tables
Table 1: Global Rare Kidney Diseases Treatment Market Revenue (USD Billion) Forecast, by Segment 1, 2018-2029
Table 2: Global Rare Kidney Diseases Treatment Market Revenue (USD Billion) Forecast, by Segment 2, 2018-2029
Table 3: Global Rare Kidney Diseases Treatment Market Revenue (USD Billion) Forecast, by Segment 3, 2018-2029
Table 4: Global Rare Kidney Diseases Treatment Market Revenue (USD Billion) Forecast, by Region, 2018-2029
Table 5: North America Rare Kidney Diseases Treatment Market Revenue (USD Billion) Forecast, by Segment 1, 2018-2029
Table 6: North America Rare Kidney Diseases Treatment Market Revenue (USD Billion) Forecast, by Segment 2, 2018-2029
Table 7: North America Rare Kidney Diseases Treatment Market Revenue (USD Billion) Forecast, by Segment 3, 2018-2029
Table 8: North America Rare Kidney Diseases Treatment Market Revenue (USD Billion) Forecast, by Country, 2018-2029
Table 9: Europe Rare Kidney Diseases Treatment Market Revenue (USD Billion) Forecast, by Segment 1, 2018-2029
Table 10: Europe Rare Kidney Diseases Treatment Market Revenue (USD Billion) Forecast, by Segment 2, 2018-2029
Table 11: Europe Rare Kidney Diseases Treatment Market Revenue (USD Billion) Forecast, by Segment 3, 2018-2029
Table 12: Europe Rare Kidney Diseases Treatment Market Revenue (USD Billion) Forecast, by Country, 2018-2029
Table 13: Latin America Rare Kidney Diseases Treatment Market Revenue (USD Billion) Forecast, by Segment 1, 2018-2029
Table 14: Latin America Rare Kidney Diseases Treatment Market Revenue (USD Billion) Forecast, by Segment 2, 2018-2029
Table 15: Latin America Rare Kidney Diseases Treatment Market Revenue (USD Billion) Forecast, by Segment 3, 2018-2029
Table 16: Latin America Rare Kidney Diseases Treatment Market Revenue (USD Billion) Forecast, by Country, 2018-2029
Table 17: Asia Pacific Rare Kidney Diseases Treatment Market Revenue (USD Billion) Forecast, by Segment 1, 2018-2029
Table 18: Asia Pacific Rare Kidney Diseases Treatment Market Revenue (USD Billion) Forecast, by Segment 2, 2018-2029
Table 19: Asia Pacific Rare Kidney Diseases Treatment Market Revenue (USD Billion) Forecast, by Segment 3, 2018-2029
Table 20: Asia Pacific Rare Kidney Diseases Treatment Market Revenue (USD Billion) Forecast, by Country, 2018-2029
Table 21: Middle East & Africa Rare Kidney Diseases Treatment Market Revenue (USD Billion) Forecast, by Segment 1, 2018-2029
Table 22: Middle East & Africa Rare Kidney Diseases Treatment Market Revenue (USD Billion) Forecast, by Segment 2, 2018-2029
Table 23: Middle East & Africa Rare Kidney Diseases Treatment Market Revenue (USD Billion) Forecast, by Segment 3, 2018-2029
Table 24: Middle East & Africa Rare Kidney Diseases Treatment Market Revenue (USD Billion) Forecast, by Country, 2018-2029
Research Process
Data Library Research are conducted by industry experts who offer insight on
industry structure, market segmentations technology assessment and competitive landscape (CL), and penetration, as well as on emerging trends. Their analysis is based on primary interviews (~ 80%) and secondary research (~ 20%) as well as years of professional expertise in their respective industries. Adding to this, by analysing historical trends and current market positions, our analysts predict where the market will be headed for the next five years. Furthermore, the varying trends of segment & categories geographically presented are also studied and the estimated based on the primary & secondary research.
In this particular report from the supply side Data Library Research has conducted primary surveys (interviews) with the key level executives (VP, CEO’s, Marketing Director, Business Development Manager
and SOFT) of the companies that active & prominent as well as the midsized organization
FIGURE 1: DLR RESEARH PROCESS
![research-methodology1]()
Primary Research
Extensive primary research was conducted to gain a deeper insight of the market and industry performance. The analysis is based on both primary and secondary research as well as years of professional expertise in the respective industries.
In addition to analysing current and historical trends, our analysts predict where the market is headed over the next five years.
It varies by segment for these categories geographically presented in the list of market tables. Speaking about this particular report we have conducted primary surveys (interviews) with the key level executives (VP, CEO’s, Marketing Director, Business Development Manager and many more) of the major players active in the market.
Secondary Research
Secondary research was mainly used to collect and identify information useful for the extensive, technical, market-oriented, and Friend’s study of the Global Extra Neutral Alcohol. It was also used to obtain key information about major players, market classification and segmentation according to the industry trends, geographical markets, and developments related to the market and technology perspectives. For this study, analysts have gathered information from various credible sources, such as annual reports, sec filings, journals, white papers, SOFT presentations, and company web sites.
Market Size Estimation
Both, top-down and bottom-up approaches were used to estimate and validate the size of the Global market and to estimate the size of various other dependent submarkets in the overall Extra Neutral Alcohol. The key players in the market were identified through secondary research and their market contributions in the respective geographies were determined through primary and secondary research.
Forecast Model
![research-methodology2]()