Retail Fueling Solution Market Overview and Analysis
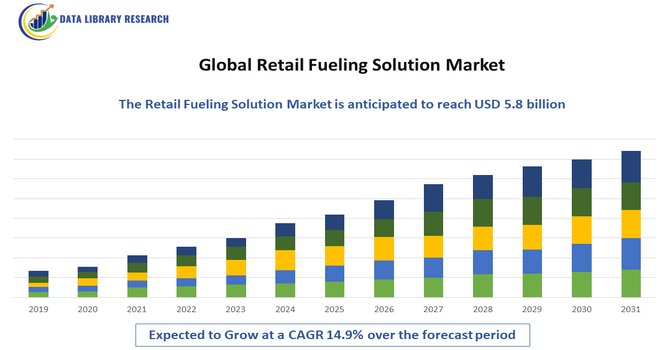
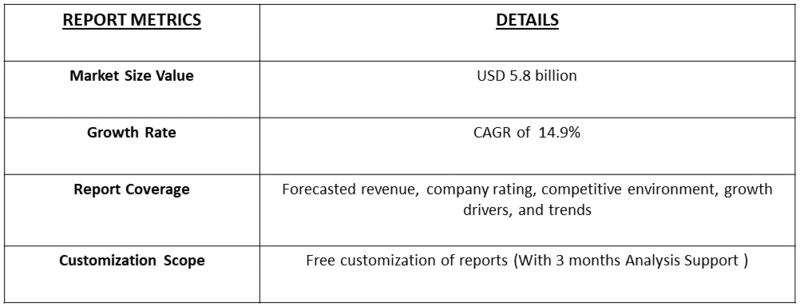
- The market is projected to reach around USD 14.5 billion by 2035, from USD 5.8 billion in 2025. The market is forecast to grow at a steady CAGR of approximately 14.9% over the forecast period, 2025-2032.
Get Complete Analysis Of The Report - Download Updated Free Sample PDF
The Global Retail Fueling Solution Market is experiencing steady growth, driven primarily by the modernization of fuel stations, rising demand for automated and contactless fueling technologies, and the increasing adoption of digital payment and forecourt management systems. Growing vehicle ownership in developing economies, coupled with the need for enhanced operational efficiency, real-time monitoring, and improved customer experience, is further propelling market expansion. Additionally, the integration of IoT-enabled fuel dispensers, cloud-based analytics, and advanced POS systems is accelerating digital transformation across fuel retail networks, contributing to sustained market growth over the forecast period.
Retail Fueling Solution Market Latest Trends:
The latest trends in the Global Retail Fueling Solution Market highlight a rapid shift toward digitalization, automation, and sustainability, with fuel stations increasingly adopting IoT-enabled dispensers, cloud-based forecourt management platforms, and AI-driven analytics to improve operational efficiency and customer engagement. The rise of contactless and mobile payment solutions, along with integrated loyalty programs, is reshaping customer interactions at fuel stations. Additionally, the growing integration of EV charging infrastructure alongside traditional fuel systems is emerging as a key trend as fuel retailers adapt to evolving mobility patterns.
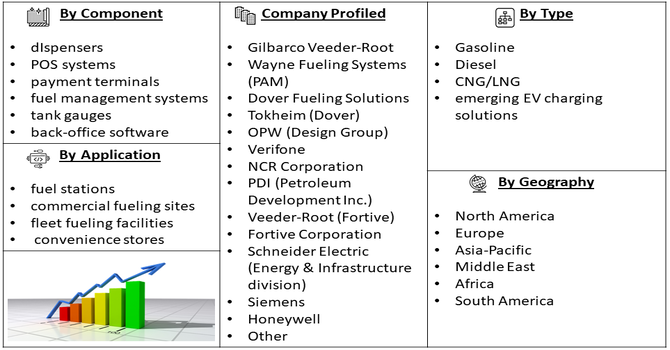
Segmentation: Global Retail Fueling Solution Market is segmented By Component (dispensers, POS systems, payment terminals, fuel management systems, tank gauges, and back-office software), Fuel Type (gasoline, diesel, CNG/LNG, and emerging EV charging solutions), Application (fuel stations, commercial fueling sites, fleet fueling facilities, and convenience stores), and Geography (North America, Europe, Asia-Pacific, Middle East and Africa, and South America). The report provides the value (in USD million) for the above segments.
For Detailed Market Segmentation - Get a Free Sample PDF
Market Drivers:
- Increasing Adoption of Automation and Digitalization in Fuel Stations
One of the primary drivers of the market is the accelerating shift toward automation and digital transformation across retail fuel stations. Fuel retailers are increasingly deploying advanced systems such as automated fuel dispensers, cloud-based management software, RFID-enabled payment solutions, and real-time inventory monitoring to enhance operational efficiency. Digital platforms help reduce manual errors, optimize fuel ordering, improve asset utilization, and streamline overall forecourt operations.
In July 2025, ABB India commissioned its ABB Ability SCADAvantage solution for THINK Gas, fully automating and digitalizing its city gas distribution network across ten states. The platform centralized monitoring, real time control, and data analytics for over 500 CNG stations, 550,000 D PNG connections, and 17,000 inch km of pipeline. This automation slashed operational costs by up to 60% and drove efficiencies, strengthening technology adoption in fueling stations and boosting the global retail fueling solutions market.
- Rising Demand for Energy Diversification and EV-Integrated Fuel Stations
Another major driver is the global transition toward diversified energy sources, including alternative fuels such as CNG/LNG and the rapid penetration of electric vehicles. Fuel retailers are expanding their offerings to include EV charging points alongside traditional fuels, creating hybrid energy stations that cater to evolving mobility needs.
Governments across various regions are implementing supportive policies, subsidies, and emission reduction targets, encouraging the modernization of existing fuel stations. For instance, in May 2025, Ministry of Heavy Industry, reported that Indian that the government launched the PM E Drive scheme with INR 2,000 crore to build around 72,000 public EV charging stations across 50 national highway corridors and high-traffic spots like cities, airports, and fuel outlets. This moves spurred energy diversification by reducing reliance on fossil fuels. It also accelerated the rise of EV-integrated fuel stations, significantly boosting growth in India’s global retail fueling solutions market.
Market Restraints:
- High Initial Investment Cost and Stringent Regulatory Requirements
A major challenge is the high initial investment cost associated with upgrading traditional fuel stations to automated and digitally integrated systems, which often limits adoption among small and independent operators. Additionally, stringent regulatory requirements related to environmental safety, fuel storage, emissions control, and data security create operational complexities and increase compliance costs for fuel retailers. The market also faces constraints due to cybersecurity vulnerabilities, as the growing dependence on connected devices, cloud platforms, and digital payment systems increases the risk of data breaches and system disruptions. Furthermore, the slow modernization of fueling infrastructure in developing regions, combined with inconsistent internet connectivity, restricts the deployment of advanced technologies.
Socio Economic Impact on Retail Fueling Solution Market
The global retail fueling solutions market has had a big social and economic impact. By modernizing fuel stations, it has improved how people refuel — with smarter payment systems, faster service, and more transparency — which boosts customer convenience and trust. The shift has created new jobs in tech, logistics, and station operations, while improving profitability for fuel retailers. As stations evolve into integrated energy hubs (adding EV charging, biofuels, and digital services), the market supports cleaner energy transitions and more resilient local economies.
Segmental Analysis:
- Fuel Management Systems segment is expected to witness the highest growth over the forecast period
Fuel management systems represent one of the most critical components in the market, offering real-time monitoring and control of fuel dispensing, inventory levels, tank conditions, and overall forecourt operations. These systems help fuel station operators improve accuracy, reduce fuel losses, detect leaks early, and enhance operational efficiency. With growing digitalization, advanced fuel management platforms integrate cloud connectivity, IoT sensors, and analytics dashboards, enabling remote monitoring and predictive maintenance. Their ability to streamline complex fuel operations makes them one of the fastest-growing segments.
- Emerging EV Charging Solutions segment is expected to witness the highest growth over the forecast period
Emerging EV charging solutions are gaining significant traction as fuel retailers transition toward mixed-energy stations to accommodate rising electric vehicle adoption. Fuel stations are increasingly integrating Level 2 and DC fast chargers alongside traditional gasoline and diesel pumps to future-proof their infrastructure. Government incentives, stricter emission norms, and growing consumer demand for accessible charging points are driving the rapid expansion of this segment. As a result, EV charging solutions are becoming a strategic investment area for fuel retailers seeking long-term relevance in a transforming mobility landscape.
- Fuel Stations segment is expected to witness the highest growth over the forecast period
Fuel stations remain the dominant application segment, accounting for the majority of demand for retail fueling solutions. These stations require advanced systems for dispensing, payment processing, inventory management, customer engagement, and safety compliance. The ongoing modernization of service stations—especially through automation, contactless payment integration, and remote monitoring—is boosting the adoption of digital fueling technologies. As the global network of fuel stations diversifies to include convenience stores and multi-energy hubs, demand for integrated and scalable fueling solutions continues to grow.
- North America region is expected to witness highest growth over the forecast period
The North America region is expected to witness the highest growth over the forecast period due to the strong pace of fuel station modernization, widespread adoption of advanced digital and automated fueling technologies, and the rapid expansion of EV charging infrastructure across the United States and Canada. For instance, Stellantis adopted the NACS (North American Charging System) for select BEVs, giving them access to more than 28,000 Tesla Superchargers starting in early 2026. This expanded charging access significantly boosted fast charging convenience and made long-distance BEV travel easier. The move accelerated build-out of the EV charging infrastructure and strengthened the U.S. retail fueling solutions market by fusing traditional fueling stations with modern EV charging.
The region’s well-established transportation networks, strict regulatory standards for fuel management, and rising consumer preference for contactless payments and technologically enhanced fueling experiences further support market growth. Additionally, increasing investments by major fuel retailers and technology providers to upgrade forecourt systems and integrate multi-energy solutions position North America as a leading growth contributor in the global retail fueling solution market, in this region.
To Learn More About This Report - Request a Free Sample Copy
Retail Fueling Solution Market Competitive Landscape:
The Global Retail Fueling Solution Market is highly competitive, featuring major systems integrators, fuel management software providers, fueling equipment manufacturers, and technology companies that focus on automation, IoT connectivity, forecourt management, and digital payment solutions.
Key Players:
- Gilbarco Veeder-Root
- Wayne Fueling Systems (PAM)
- Dover Fueling Solutions
- Tokheim (Dover)
- OPW (Design Group)
- Verifone
- NCR Corporation
- PDI (Petroleum Development Inc.)
- Veeder-Root (Fortive)
- Fortive Corporation
- Schneider Electric (Energy & Infrastructure division)
- Siemens
- Honeywell
- Gilbarco (a division of Danaher)
- Envoy Technologies
- Zivion Analytics
- Veefil Technologies
- Tokheim Global
- Orpak Systems (Orpak Tech)
- E-Chek Sensors & Software
Recent Development
- In November 2025, Hyliion successfully showed that its KARNO Power Module could switch dynamically between natural gas and propane while under load, without shutting down or changing hardware. The system kept delivering power uninterrupted, demonstrating real-time adaptability. The module is also designed to run on more than 20 different fuels, greatly enhancing flexibility and resilience in power generation.
- In October 2025, Dover announced that several of its business units would present a broad mix of innovative solutions at the NACS Show and PEI Convention held in Chicago. Its operating companies showcased cutting-edge offerings across clean energy fueling, digital software platforms, refrigeration, food retail, and vehicle wash systems. The display underscored Dover’s commitment to helping convenience-store and fueling operators boost efficiency and adapt to emerging energy and retail trends.
Frequently Asked Questions (FAQ) :
Q1. What are the main growth-driving factors for this market?
The primary driver is the global need for fuel retailers to enhance the customer experience through faster payment methods and integrated loyalty programs. Growth is also fueled by increasingly strict environmental and safety regulations requiring modernization of pumps and underground storage systems. Critically, the need to support electric vehicle (EV) charging alongside traditional fueling is forcing stations to adopt flexible, future-proof digital solutions.
Q2. What are the main restraining factors for this market?
A key constraint is the high initial cost of upgrading legacy fueling dispensers, point-of-sale (POS) systems, and compliance infrastructure to meet the latest security and EMV (chip card) standards. The market also faces uncertainty due to the long-term global shift toward EVs, which requires significant investment in new, non-petrol dispensing technologies. Furthermore, cybersecurity threats to payment systems necessitate constant, expensive software updates.
Q3. Which segment is expected to witness high growth?
The Payment and POS Systems Segment is projected to witness the highest growth. This segment is constantly evolving to integrate mobile payment apps, enhanced loyalty schemes, and advanced fraud detection. Driven by the need for quick, secure chip-and-pin (EMV) compliance and the demand for a seamless, contactless transaction experience, investment in modern digital payment platforms is essential for all fuel retailers to remain competitive.
Q4. Who are the top major players for this market?
The market is dominated by global technology and equipment manufacturers. Top major players include Gilbarco Veeder-Root, Dover Corporation (Wayne Fueling Systems), Tokheim, and Fortive Corporation. Competition focuses heavily on providing end-to-end integrated solutions that cover everything from the physical pump dispenser to the back-office management software. Reliability, payment security, and technical service networks are key competitive differentiators.
Q5. Which country is the largest player?
The United States is the largest country player, primarily due to its vast geographic size, high vehicle ownership, and immense network of independent and chain gas stations. The massive mandate for retailers to upgrade to EMV compliance drove a recent wave of large-scale equipment replacement. The need for continuous security updates and the early adoption of integrated loyalty and digital payment systems ensure consistent market dominance.
List of Figures
Figure 1: Global Retail Fueling Solution Market Revenue Breakdown (USD Billion, %) by Region, 2022 & 2029
Figure 2: Global Retail Fueling Solution Market Value Share (%), By Segment 1, 2022 & 2029
Figure 3: Global Retail Fueling Solution Market Forecast (USD Billion), by Sub-Segment 1, 2018-2029
Figure 4: Global Retail Fueling Solution Market Forecast (USD Billion), by Sub-Segment 2, 2018-2029
Figure 5: Global Retail Fueling Solution Market Value Share (%), By Segment 2, 2022 & 2029
Figure 6: Global Retail Fueling Solution Market Forecast (USD Billion), by Sub-Segment 1, 2018-2029
Figure 7: Global Retail Fueling Solution Market Forecast (USD Billion), by Sub-Segment 2, 2018-2029
Figure 8: Global Retail Fueling Solution Market Forecast (USD Billion), by Sub-Segment 3, 2018-2029
Figure 9: Global Retail Fueling Solution Market Forecast (USD Billion), by Others, 2018-2029
Figure 10: Global Retail Fueling Solution Market Value Share (%), By Segment 3, 2022 & 2029
Figure 11: Global Retail Fueling Solution Market Forecast (USD Billion), by Sub-Segment 1, 2018-2029
Figure 12: Global Retail Fueling Solution Market Forecast (USD Billion), by Sub-Segment 2, 2018-2029
Figure 13: Global Retail Fueling Solution Market Forecast (USD Billion), by Sub-Segment 3, 2018-2029
Figure 14: Global Retail Fueling Solution Market Forecast (USD Billion), by Others, 2018-2029
Figure 15: Global Retail Fueling Solution Market Value (USD Billion), by Region, 2022 & 2029
Figure 16: North America Retail Fueling Solution Market Value Share (%), By Segment 1, 2022 & 2029
Figure 17: North America Retail Fueling Solution Market Forecast (USD Billion), by Sub-Segment 1, 2018-2029
Figure 18: North America Retail Fueling Solution Market Forecast (USD Billion), by Sub-Segment 2, 2018-2029
Figure 19: North America Retail Fueling Solution Market Value Share (%), By Segment 2, 2022 & 2029
Figure 20: North America Retail Fueling Solution Market Forecast (USD Billion), by Sub-Segment 1, 2018-2029
Figure 21: North America Retail Fueling Solution Market Forecast (USD Billion), by Sub-Segment 2, 2018-2029
Figure 22: North America Retail Fueling Solution Market Forecast (USD Billion), by Sub-Segment 3, 2018-2029
Figure 23: North America Retail Fueling Solution Market Forecast (USD Billion), by Others, 2018-2029
Figure 24: North America Retail Fueling Solution Market Value Share (%), By Segment 3, 2022 & 2029
Figure 25: North America Retail Fueling Solution Market Forecast (USD Billion), by Sub-Segment 1, 2018-2029
Figure 26: North America Retail Fueling Solution Market Forecast (USD Billion), by Sub-Segment 2, 2018-2029
Figure 27: North America Retail Fueling Solution Market Forecast (USD Billion), by Sub-Segment 3, 2018-2029
Figure 28: North America Retail Fueling Solution Market Forecast (USD Billion), by Others, 2018-2029
Figure 29: North America Retail Fueling Solution Market Forecast (USD Billion), by U.S., 2018-2029
Figure 30: North America Retail Fueling Solution Market Forecast (USD Billion), by Canada, 2018-2029
Figure 31: Latin America Retail Fueling Solution Market Value Share (%), By Segment 1, 2022 & 2029
Figure 32: Latin America Retail Fueling Solution Market Forecast (USD Billion), by Sub-Segment 1, 2018-2029
Figure 33: Latin America Retail Fueling Solution Market Forecast (USD Billion), by Sub-Segment 2, 2018-2029
Figure 34: Latin America Retail Fueling Solution Market Value Share (%), By Segment 2, 2022 & 2029
Figure 35: Latin America Retail Fueling Solution Market Forecast (USD Billion), by Sub-Segment 1, 2018-2029
Figure 36: Latin America Retail Fueling Solution Market Forecast (USD Billion), by Sub-Segment 2, 2018-2029
Figure 37: Latin America Retail Fueling Solution Market Forecast (USD Billion), by Sub-Segment 3, 2018-2029
Figure 38: Latin America Retail Fueling Solution Market Forecast (USD Billion), by Others, 2018-2029
Figure 39: Latin America Retail Fueling Solution Market Value Share (%), By Segment 3, 2022 & 2029
Figure 40: Latin America Retail Fueling Solution Market Forecast (USD Billion), by Sub-Segment 1, 2018-2029
Figure 41: Latin America Retail Fueling Solution Market Forecast (USD Billion), by Sub-Segment 2, 2018-2029
Figure 42: Latin America Retail Fueling Solution Market Forecast (USD Billion), by Sub-Segment 3, 2018-2029
Figure 43: Latin America Retail Fueling Solution Market Forecast (USD Billion), by Others, 2018-2029
Figure 44: Latin America Retail Fueling Solution Market Forecast (USD Billion), by Brazil, 2018-2029
Figure 45: Latin America Retail Fueling Solution Market Forecast (USD Billion), by Mexico, 2018-2029
Figure 46: Latin America Retail Fueling Solution Market Forecast (USD Billion), by Rest of Latin America, 2018-2029
Figure 47: Europe Retail Fueling Solution Market Value Share (%), By Segment 1, 2022 & 2029
Figure 48: Europe Retail Fueling Solution Market Forecast (USD Billion), by Sub-Segment 1, 2018-2029
Figure 49: Europe Retail Fueling Solution Market Forecast (USD Billion), by Sub-Segment 2, 2018-2029
Figure 50: Europe Retail Fueling Solution Market Value Share (%), By Segment 2, 2022 & 2029
Figure 51: Europe Retail Fueling Solution Market Forecast (USD Billion), by Sub-Segment 1, 2018-2029
Figure 52: Europe Retail Fueling Solution Market Forecast (USD Billion), by Sub-Segment 2, 2018-2029
Figure 53: Europe Retail Fueling Solution Market Forecast (USD Billion), by Sub-Segment 3, 2018-2029
Figure 54: Europe Retail Fueling Solution Market Forecast (USD Billion), by Others, 2018-2029
Figure 55: Europe Retail Fueling Solution Market Value Share (%), By Segment 3, 2022 & 2029
Figure 56: Europe Retail Fueling Solution Market Forecast (USD Billion), by Sub-Segment 1, 2018-2029
Figure 57: Europe Retail Fueling Solution Market Forecast (USD Billion), by Sub-Segment 2, 2018-2029
Figure 58: Europe Retail Fueling Solution Market Forecast (USD Billion), by Sub-Segment 3, 2018-2029
Figure 59: Europe Retail Fueling Solution Market Forecast (USD Billion), by Others, 2018-2029
Figure 60: Europe Retail Fueling Solution Market Forecast (USD Billion), by U.K., 2018-2029
Figure 61: Europe Retail Fueling Solution Market Forecast (USD Billion), by Germany, 2018-2029
Figure 62: Europe Retail Fueling Solution Market Forecast (USD Billion), by France, 2018-2029
Figure 63: Europe Retail Fueling Solution Market Forecast (USD Billion), by Italy, 2018-2029
Figure 64: Europe Retail Fueling Solution Market Forecast (USD Billion), by Spain, 2018-2029
Figure 65: Europe Retail Fueling Solution Market Forecast (USD Billion), by Russia, 2018-2029
Figure 66: Europe Retail Fueling Solution Market Forecast (USD Billion), by Rest of Europe, 2018-2029
Figure 67: Asia Pacific Retail Fueling Solution Market Value Share (%), By Segment 1, 2022 & 2029
Figure 68: Asia Pacific Retail Fueling Solution Market Forecast (USD Billion), by Sub-Segment 1, 2018-2029
Figure 69: Asia Pacific Retail Fueling Solution Market Forecast (USD Billion), by Sub-Segment 2, 2018-2029
Figure 70: Asia Pacific Retail Fueling Solution Market Value Share (%), By Segment 2, 2022 & 2029
Figure 71: Asia Pacific Retail Fueling Solution Market Forecast (USD Billion), by Sub-Segment 1, 2018-2029
Figure 72: Asia Pacific Retail Fueling Solution Market Forecast (USD Billion), by Sub-Segment 2, 2018-2029
Figure 73: Asia Pacific Retail Fueling Solution Market Forecast (USD Billion), by Sub-Segment 3, 2018-2029
Figure 74: Asia Pacific Retail Fueling Solution Market Forecast (USD Billion), by Others, 2018-2029
Figure 75: Asia Pacific Retail Fueling Solution Market Value Share (%), By Segment 3, 2022 & 2029
Figure 76: Asia Pacific Retail Fueling Solution Market Forecast (USD Billion), by Sub-Segment 1, 2018-2029
Figure 77: Asia Pacific Retail Fueling Solution Market Forecast (USD Billion), by Sub-Segment 2, 2018-2029
Figure 78: Asia Pacific Retail Fueling Solution Market Forecast (USD Billion), by Sub-Segment 3, 2018-2029
Figure 79: Asia Pacific Retail Fueling Solution Market Forecast (USD Billion), by Others, 2018-2029
Figure 80: Asia Pacific Retail Fueling Solution Market Forecast (USD Billion), by China, 2018-2029
Figure 81: Asia Pacific Retail Fueling Solution Market Forecast (USD Billion), by India, 2018-2029
Figure 82: Asia Pacific Retail Fueling Solution Market Forecast (USD Billion), by Japan, 2018-2029
Figure 83: Asia Pacific Retail Fueling Solution Market Forecast (USD Billion), by Australia, 2018-2029
Figure 84: Asia Pacific Retail Fueling Solution Market Forecast (USD Billion), by Southeast Asia, 2018-2029
Figure 85: Asia Pacific Retail Fueling Solution Market Forecast (USD Billion), by Rest of Asia Pacific, 2018-2029
Figure 86: Middle East & Africa Retail Fueling Solution Market Value Share (%), By Segment 1, 2022 & 2029
Figure 87: Middle East & Africa Retail Fueling Solution Market Forecast (USD Billion), by Sub-Segment 1, 2018-2029
Figure 88: Middle East & Africa Retail Fueling Solution Market Forecast (USD Billion), by Sub-Segment 2, 2018-2029
Figure 89: Middle East & Africa Retail Fueling Solution Market Value Share (%), By Segment 2, 2022 & 2029
Figure 90: Middle East & Africa Retail Fueling Solution Market Forecast (USD Billion), by Sub-Segment 1, 2018-2029
Figure 91: Middle East & Africa Retail Fueling Solution Market Forecast (USD Billion), by Sub-Segment 2, 2018-2029
Figure 92: Middle East & Africa Retail Fueling Solution Market Forecast (USD Billion), by Sub-Segment 3, 2018-2029
Figure 93: Middle East & Africa Retail Fueling Solution Market Forecast (USD Billion), by Others, 2018-2029
Figure 94: Middle East & Africa Retail Fueling Solution Market Value Share (%), By Segment 3, 2022 & 2029
Figure 95: Middle East & Africa Retail Fueling Solution Market Forecast (USD Billion), by Sub-Segment 1, 2018-2029
Figure 96: Middle East & Africa Retail Fueling Solution Market Forecast (USD Billion), by Sub-Segment 2, 2018-2029
Figure 97: Middle East & Africa Retail Fueling Solution Market Forecast (USD Billion), by Sub-Segment 3, 2018-2029
Figure 98: Middle East & Africa Retail Fueling Solution Market Forecast (USD Billion), by Others, 2018-2029
Figure 99: Middle East & Africa Retail Fueling Solution Market Forecast (USD Billion), by GCC, 2018-2029
Figure 100: Middle East & Africa Retail Fueling Solution Market Forecast (USD Billion), by South Africa, 2018-2029
Figure 101: Middle East & Africa Retail Fueling Solution Market Forecast (USD Billion), by Rest of Middle East & Africa, 2018-2029
List of Tables
Table 1: Global Retail Fueling Solution Market Revenue (USD Billion) Forecast, by Segment 1, 2018-2029
Table 2: Global Retail Fueling Solution Market Revenue (USD Billion) Forecast, by Segment 2, 2018-2029
Table 3: Global Retail Fueling Solution Market Revenue (USD Billion) Forecast, by Segment 3, 2018-2029
Table 4: Global Retail Fueling Solution Market Revenue (USD Billion) Forecast, by Region, 2018-2029
Table 5: North America Retail Fueling Solution Market Revenue (USD Billion) Forecast, by Segment 1, 2018-2029
Table 6: North America Retail Fueling Solution Market Revenue (USD Billion) Forecast, by Segment 2, 2018-2029
Table 7: North America Retail Fueling Solution Market Revenue (USD Billion) Forecast, by Segment 3, 2018-2029
Table 8: North America Retail Fueling Solution Market Revenue (USD Billion) Forecast, by Country, 2018-2029
Table 9: Europe Retail Fueling Solution Market Revenue (USD Billion) Forecast, by Segment 1, 2018-2029
Table 10: Europe Retail Fueling Solution Market Revenue (USD Billion) Forecast, by Segment 2, 2018-2029
Table 11: Europe Retail Fueling Solution Market Revenue (USD Billion) Forecast, by Segment 3, 2018-2029
Table 12: Europe Retail Fueling Solution Market Revenue (USD Billion) Forecast, by Country, 2018-2029
Table 13: Latin America Retail Fueling Solution Market Revenue (USD Billion) Forecast, by Segment 1, 2018-2029
Table 14: Latin America Retail Fueling Solution Market Revenue (USD Billion) Forecast, by Segment 2, 2018-2029
Table 15: Latin America Retail Fueling Solution Market Revenue (USD Billion) Forecast, by Segment 3, 2018-2029
Table 16: Latin America Retail Fueling Solution Market Revenue (USD Billion) Forecast, by Country, 2018-2029
Table 17: Asia Pacific Retail Fueling Solution Market Revenue (USD Billion) Forecast, by Segment 1, 2018-2029
Table 18: Asia Pacific Retail Fueling Solution Market Revenue (USD Billion) Forecast, by Segment 2, 2018-2029
Table 19: Asia Pacific Retail Fueling Solution Market Revenue (USD Billion) Forecast, by Segment 3, 2018-2029
Table 20: Asia Pacific Retail Fueling Solution Market Revenue (USD Billion) Forecast, by Country, 2018-2029
Table 21: Middle East & Africa Retail Fueling Solution Market Revenue (USD Billion) Forecast, by Segment 1, 2018-2029
Table 22: Middle East & Africa Retail Fueling Solution Market Revenue (USD Billion) Forecast, by Segment 2, 2018-2029
Table 23: Middle East & Africa Retail Fueling Solution Market Revenue (USD Billion) Forecast, by Segment 3, 2018-2029
Table 24: Middle East & Africa Retail Fueling Solution Market Revenue (USD Billion) Forecast, by Country, 2018-2029
Research Process
Data Library Research are conducted by industry experts who offer insight on
industry structure, market segmentations technology assessment and competitive landscape (CL), and penetration, as well as on emerging trends. Their analysis is based on primary interviews (~ 80%) and secondary research (~ 20%) as well as years of professional expertise in their respective industries. Adding to this, by analysing historical trends and current market positions, our analysts predict where the market will be headed for the next five years. Furthermore, the varying trends of segment & categories geographically presented are also studied and the estimated based on the primary & secondary research.
In this particular report from the supply side Data Library Research has conducted primary surveys (interviews) with the key level executives (VP, CEO’s, Marketing Director, Business Development Manager
and SOFT) of the companies that active & prominent as well as the midsized organization
FIGURE 1: DLR RESEARH PROCESS
![research-methodology1]()
Primary Research
Extensive primary research was conducted to gain a deeper insight of the market and industry performance. The analysis is based on both primary and secondary research as well as years of professional expertise in the respective industries.
In addition to analysing current and historical trends, our analysts predict where the market is headed over the next five years.
It varies by segment for these categories geographically presented in the list of market tables. Speaking about this particular report we have conducted primary surveys (interviews) with the key level executives (VP, CEO’s, Marketing Director, Business Development Manager and many more) of the major players active in the market.
Secondary Research
Secondary research was mainly used to collect and identify information useful for the extensive, technical, market-oriented, and Friend’s study of the Global Extra Neutral Alcohol. It was also used to obtain key information about major players, market classification and segmentation according to the industry trends, geographical markets, and developments related to the market and technology perspectives. For this study, analysts have gathered information from various credible sources, such as annual reports, sec filings, journals, white papers, SOFT presentations, and company web sites.
Market Size Estimation
Both, top-down and bottom-up approaches were used to estimate and validate the size of the Global market and to estimate the size of various other dependent submarkets in the overall Extra Neutral Alcohol. The key players in the market were identified through secondary research and their market contributions in the respective geographies were determined through primary and secondary research.
Forecast Model
![research-methodology2]()