Robotic Process Automation Market Overview Robotic process automation (RPA) is a software technology that makes it easy to build, deploy, and manage software robots that emulate humans’ actions interacting with digital systems and software. The global Robotic Process Automation market is projected to rise at a significant rate in the forecast period.
Noteworthy factors such as consolidation of robotic process automation with traditional business processes and ease in business processes owing to the installation of RPA are contributing majorly towards the growth of the global Robotic Process Automation market. In addition to this, companies save time and money by utilizing tools such as artificial intelligence, machine learning cognitive abilities, and architectural tools.
On the downside, factors such as data security risk in the financial sector, lack of awareness about RPA, and less potential for RPA in business processes that are knowledge-based are hindering the growth of the global Robotic Process Automation market. Besides this, integration of robotic process automation with new and emerging technologies, expanding demand for RPA in the logistics industry, and rising use of automation processes in the BPO sector are all factors creating various growth opportunities for the development of the market.
Report Metric |
Details |
Market size available for years |
2023–2030 |
Base year considered |
2023 |
Forecast period |
2024–2030 |
Forecast unit |
Value (USD Million) |
Segments covered |
Process, Operations, Type, End-Use Industry, and Region |
Regions covered |
North America (the U.S. and Canada), Europe (UK, Germany, France, Italy, Spain, Russia, Rest of Europe), Asia-Pacific (China, India, Japan, Australia, South East Asia, Rest of Asia Pacific), Latin America and the Middle East and Africa (Brazil, Saudi Arabia, UAE, Rest of LAMEA) |
Companies covered |
Uipath SRL, Nice Systems Ltd., Verint System Inc., Pegasystems Inc., IBM, Automation Anywhere, Thoughtonomy Ltd., Blue Prism PLC, Celaton Ltd., Ipsoft, Inc., Redwood Software, Xerox Corporation, and Arago Us, Inc. |
Covid-19 Impact on Robotic Process Automation Market Like many other industries, COVID-19 badly knocked the electronic and semiconductor industries. This unprecedented event has impacted nearly 230 countries in just a few weeks, resulting in the forced shutdown of manufacturing and transportation activities within and across the countries. This has directly affected the overall sector's growth. It is estimated that COVID-19 to leave more than USD 30 billion impacts on the electronics and semiconductor industry. The sector is majorly affected due to transport restrictions on major electronics and semiconductor raw material providers. However, the emerging need for semiconductors in several industries will offer rapid market recovery over the future period.
Robotic Process Automation Market Segment Overview
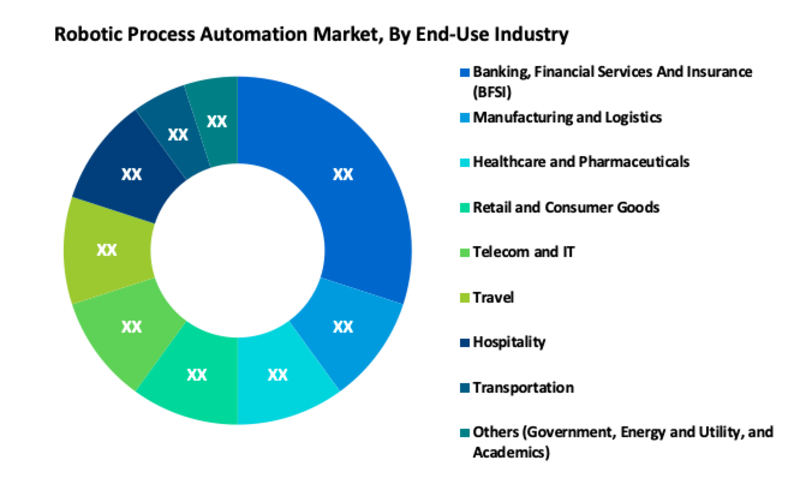
Based on End-Use Industry, Banking, Financial Services and Insurance (BFSI) is the largest segment in the global Robotic Process Automation market. In the BFSI domain, multiple systems are linked together by interfaces to allow the flow of transaction-related data. Robotic process automation (RPA) manages and monitors these interfaces, ensuring that transactions run smoothly and data gaps are filled. In the BFSI industry, robotic process automation (RPA) enhances the accuracy and efficiency of many procedures. These solutions also aid regulatory reporting and balance sheet reconciliation by combining data from numerous systems and performing a slew of validation tests to prepare data for a thorough examination.
Robotic Process Automation Market, By Process
· Automated Solution
· Decision Support and Management Solutions
· Interaction Solutions
Robotic Process Automation Market, By Operations
· Rule-Based
· Knowledge-Based
Robotic Process Automation Market, By Type
· Tools
· Services
Robotic Process Automation Market, By End-Use Industry
· Banking, Financial Services and Insurance (BFSI)
· Manufacturing and Logistics
· Healthcare and Pharmaceuticals
· Retail and Consumer Goods
· Telecom and IT
· Travel
· Hospitality
· Transportation
· Others (Government, Energy and Utility, and Academics)
Robotic Process Automation Market Regional OverviewIn terms of region, North America held the maximum share in the global Robotic Process Automation market in 2020. This might be attributed to the region's significant adoption of process management and automation technologies by businesses and government bodies. Furthermore, due to increased knowledge regarding enhancing different company activities such as accounting/finance, data entry, record keeping, procurement detail, and other HR-related procedures, RPA adoption among SMEs in North America is augmenting the market growth. Similarly, the market of the Asia Pacific is projected to grow at the fastest rate in the coming years. This is because of rising product usage in the pharmaceutical, healthcare, information technology and telecommunications, retail, and manufacturing industries. Furthermore, increased awareness among various industries and SMEs is likely to support market expansion. In addition, the increased demand for automation in the Business Process Outsourcing (BPO) sector is also associated with the region's market growth.
Robotic Process Automation Market, By Geography
· North America (US & Canada)
· Europe (UK, Germany, France, Italy, Spain, Russia & Rest of Europe)
· Asia-Pacific (Japan, China, India, Australia, & South Korea, & Rest of Asia-Pacific)
· LAMEA (Brazil, Saudi Arabia, UAE & Rest of LAMEA)
Robotic Process Automation Market Competitor overviewSome key developments and strategies adopted by manufacturers in Robotic Process Automation are highlighted below.
· In October 2021, SoftwareReviews, a division of IT research and advisory firm Info-Tech Research Group, has published its 2021 Robotic Process Automation Data Quadrant Awards, naming three vendors as gold medalists. The following vendors are winners according to the feedback provided by their end-users via SoftwareReviews’ comprehensive online survey: 1) UiPath 2) Automate from HelpSystems 3) Automation Anywhere - Vendors are rated on product features, vendor capabilities, and the relationship with their software partner.
· In October 2021, IST Networks announced a collaboration with Automation Anywhere, a global leader in Robotic Process Automation (RPA), to provide RPA services in the Middle East. The partnership will enable IST's clients to automate key business processes and enhance customer engagement across their organizations.
· In October 2021, Private equity firm TPG Capital has acquired Nintex, a software company that has robotic process automation (RPA) capabilities. The seller, Thoma Bravo, will make a new equity investment in Nintex and maintain a “significant” minority interest in the business.
Robotic Process Automation Market, Key Players· Uipath SRL
· Nice Systems Ltd.
· Verint System Inc.
· Pegasystems Inc.
· IBM
· Automation Anywhere
· Thoughtonomy Ltd.
· Blue Prism PLC
· Celaton Ltd.
· Ipsoft, Inc.
· Redwood Software
· Xerox Corporation
· Arago Us, Inc.
Frequently Asked Questions (FAQ) :
Q1. What are the driving factors for the Robotic Process Automation market?
A. Factors such as consolidation of robotic process automation with traditional business processes and ease in business processes owing to the installation of RPA are boosting the growth of the Robotic Process Automation market
Q2. What are the restraining factors for the Robotic Process Automation market?
A. Factors such as data security risk in the financial sector, lack of awareness about RPA, and less potential for RPA in knowledge-based business processes are hindering the growth of the global Robotic Process Automation market.
Q3. Which Segments are covered in the Robotic Process Automation market report?
A. Process, Operations, Type, End-Use Industry, and Region, these segments are covered in the Robotic Process Automation market report.
Q4. Which segment is projected to hold the largest share in the Robotic Process Automation Market. ?
A. The Banking, Financial Services and Insurance (BFSI) segment is projected to hold the largest share in the Robotic Process Automation Market.
Q5. Which are the prominent players in the Robotic Process Automation Market?
A. Uipath SRL, Nice Systems Ltd., Verint System Inc., Pegasystems Inc., IBM, Automation Anywhere, Thoughtonomy Ltd., Blue Prism PLC, Celaton Ltd., Ipsoft, Inc., Redwood Software, Xerox Corporation, and Arago Us, Inc. are some key players in the Robotic Process Automation Market.
Robotic Process Automation Market Study Global Market Analysis, Insights and Forecast, 2020-2027
1. Introduction
- 1.1. Research Scope
- 1.2. Market Segmentation
- 1.3. Research Methodology
- 1.4. Definitions and Assumptions
2. Executive Summary
3. Market Dynamics
- 3.1. Market Drivers
- 3.2. Market Restraints
- 3.3. Market Opportunities
4. Key Insights
- 4.1. Key Emerging Trends – For Major Countries
- 4.2. Latest Technological Advancement
- 4.3. Regulatory Landscape
- 4.4. Industry SWOT Analysis
- 4.5. Porters Five Forces Analysis
5. Global Robotic Process Automation Market Analysis (USD Billion), Insights and Forecast, 2020-2027
- 5.1. Key Findings / Summary
- 5.2. Market Analysis, Insights and Forecast – By Process
- 5.2.1. Automated Solution
- 5.2.2. Decision Support and Management Solutions
- 5.2.3. Interaction Solutions
- 5.3. Market Analysis, Insights and Forecast – By Operations
- 5.3.1. Rule-Based
- 5.3.2. Knowledge-Based
- 5.4. Market Analysis, Insights and Forecast – By Type
- 5.4.1. Tools
- 5.4.2. Services
- 5.5. Market Analysis, Insights and Forecast – By End-Use Industry
- 5.5.1. Banking, Financial Services and Insurance (BFSI)
- 5.5.2. Manufacturing and Logistics
- 5.5.3. Healthcare and Pharmaceuticals
- 5.5.4. Retail and Consumer Goods
- 5.5.5. Telecom and IT
- 5.5.6. Travel
- 5.5.7. Hospitality
- 5.5.8. Transportation
- 5.5.9. Others (Government, Energy and Utility, and Academics)
- 5.6. Market Analysis, Insights and Forecast – By Region
- 5.6.1. North America
- 5.6.2. Europe
- 5.6.3. Asia Pacific
- 5.6.4. Latin America, Middle East and Africa
6. North America Robotic Process Automation Market Analysis (USD Billion), Insights and Forecast, 2020-2027
- 6.1. Key Findings / Summary
- 6.2. Market Analysis, Insights and Forecast – By Process
- 6.2.1. Automated Solution
- 6.2.2. Decision Support and Management Solutions
- 6.2.3. Interaction Solutions
- 6.3. Market Analysis, Insights and Forecast – By Operations
- 6.3.1. Rule-Based
- 6.3.2. Knowledge-Based
- 6.4. Market Analysis, Insights and Forecast – By Type
- 6.4.1. Tools
- 6.4.2. Services
- 6.5. Market Analysis, Insights and Forecast – By End-Use Industry
- 6.5.1. Banking, Financial Services and Insurance (BFSI)
- 6.5.2. Manufacturing and Logistics
- 6.5.3. Healthcare and Pharmaceuticals
- 6.5.4. Retail and Consumer Goods
- 6.5.5. Telecom and IT
- 6.5.6. Travel
- 6.5.7. Hospitality
- 6.5.8. Transportation
- 6.5.9. Others (Government, Energy and Utility, and Academics)
- 6.6. Market Analysis, Insights and Forecast – By Country
7. Europe Robotic Process Automation Market Analysis (USD Billion), Insights and Forecast, 2020-2027
- 7.1. Key Findings / Summary
- 7.2. Market Analysis, Insights and Forecast – By Process
- 7.2.1. Automated Solution
- 7.2.2. Decision Support and Management Solutions
- 7.2.3. Interaction Solutions
- 7.3. Market Analysis, Insights and Forecast – By Operations
- 7.3.1. Rule-Based
- 7.3.2. Knowledge-Based
- 7.4. Market Analysis, Insights and Forecast – By Type
- 7.4.1. Tools
- 7.4.2. Services
- 7.5. Market Analysis, Insights and Forecast – By End-Use Industry
- 7.5.1. Banking, Financial Services and Insurance (BFSI)
- 7.5.2. Manufacturing and Logistics
- 7.5.3. Healthcare and Pharmaceuticals
- 7.5.4. Retail and Consumer Goods
- 7.5.5. Telecom and IT
- 7.5.6. Travel
- 7.5.7. Hospitality
- 7.5.8. Transportation
- 7.5.9. Others (Government, Energy and Utility, and Academics)
- 7.6. Market Analysis, Insights and Forecast – By Country
- 7.6.1. UK
- 7.6.2. Germany
- 7.6.3. France
- 7.6.4. Italy
- 7.6.5. Spain
- 7.6.6. Russia
- 7.6.7. Rest of Europe
8. Asia Pacific Robotic Process Automation Market Analysis (USD Billion), Insights and Forecast, 2020-2027
- 8.1. Key Findings / Summary
- 8.2. Market Analysis, Insights and Forecast – By Process
- 8.2.1. Automated Solution
- 8.2.2. Decision Support and Management Solutions
- 8.2.3. Interaction Solutions
- 8.3. Market Analysis, Insights and Forecast – By Operations
- 8.3.1. Rule-Based
- 8.3.2. Knowledge-Based
- 8.4. Market Analysis, Insights and Forecast – By Type
- 8.4.1. Tools
- 8.4.2. Services
- 8.5. Market Analysis, Insights and Forecast – By End-Use Industry
- 8.5.1. Banking, Financial Services and Insurance (BFSI)
- 8.5.2. Manufacturing and Logistics
- 8.5.3. Healthcare and Pharmaceuticals
- 8.5.4. Retail and Consumer Goods
- 8.5.5. Telecom and IT
- 8.5.6. Travel
- 8.5.7. Hospitality
- 8.5.8. Transportation
- 8.5.9. Others (Government, Energy and Utility, and Academics)
- 8.6. Market Analysis, Insights and Forecast – By Country
- 8.6.1. China
- 8.6.2. India
- 8.6.3. Japan
- 8.6.4. Australia
- 8.6.5. South East Asia
- 8.6.6. Rest of Asia Pacific
9. Latin America, Middle East and Africa Robotic Process Automation Market Analysis (USD Billion), Insights and Forecast, 2020-2027
- 9.1. Key Findings / Summary
- 9.2. Market Analysis, Insights and Forecast – By Process
- 9.2.1. Automated Solution
- 9.2.2. Decision Support and Management Solutions
- 9.2.3. Interaction Solutions
- 9.3. Market Analysis, Insights and Forecast – By Operations
- 9.3.1. Rule-Based
- 9.3.2. Knowledge-Based
- 9.4. Market Analysis, Insights and Forecast – By Type
- 9.4.1. Tools
- 9.4.2. Services
- 9.5. Market Analysis, Insights and Forecast – By End-Use Industry
- 9.5.1. Banking, Financial Services and Insurance (BFSI)
- 9.5.2. Manufacturing and Logistics
- 9.5.3. Healthcare and Pharmaceuticals
- 9.5.4. Retail and Consumer Goods
- 9.5.5. Telecom and IT
- 9.5.6. Travel
- 9.5.7. Hospitality
- 9.5.8. Transportation
- 9.5.9. Others (Government, Energy and Utility, and Academics)
- 9.6. Market Analysis, Insights and Forecast – By Country
- 9.6.1. Brazil
- 9.6.2. Saudi Arabia
- 9.6.3. UAE
- 9.6.4. Rest of LAMEA
10. Competitive Analysis
- 10.1. Company Market Share Analysis, 2018
- 10.2. Key Industry Developments
- 10.3. Company Profile
- 10.4. Uipath SRL
- 10.4.1. Business Overview
- 10.4.2. Segment 1 & Service Offering
- 10.4.3. Overall Revenue
- 10.4.4. Geographic Presence
- 10.4.5. Recent Development
*Similar details will be provided for the following companies
- 10.5. Nice Systems Ltd.
- 10.6. Verint System Inc.
- 10.7. Pegasystems Inc.
- 10.8. IBM
- 10.9. Automation Anywhere
- 10.10. Thoughtonomy Ltd.
- 10.11. Blue Prism PLC
- 10.12. Celaton Ltd.
- 10.13. Ipsoft, Inc.
- 10.14. Redwood Software
- 10.15. Xerox Corporation
List of Figures
Figure 1: Global Robotic Process Automation Market Revenue Breakdown (USD Billion, %) by Region, 2019 & 2027
Figure 2: Global Market Value Share (%), By Segment 1, 2019 & 2027
Figure 3: Global Market Forecast (USD Billion), by Sub-Segment 1, 2016-2027
Figure 4: Global Market Forecast (USD Billion), by Sub-Segment 2, 2016-2027
Figure 5: Global Market Value Share (%), By Segment 2, 2019 & 2027
Figure 6: Global Market Forecast (USD Billion), by Sub-Segment 1, 2016-2027
Figure 7: Global Market Forecast (USD Billion), by Sub-Segment 2, 2016-2027
Figure 8: Global Market Forecast (USD Billion), by Sub-Segment 3, 2016-2027
Figure 9: Global Robotic Process Automation Market Forecast (USD Billion), by Others, 2016-2027
Figure 10: Global Market Value Share (%), By Segment 3, 2019 & 2027
Figure 11: Global Market Forecast (USD Billion), by Sub-Segment 1, 2016-2027
Figure 12: Global Market Forecast (USD Billion), by Sub-Segment 2, 2016-2027
Figure 13: Global Market Forecast (USD Billion), by Sub-Segment 3, 2016-2027
Figure 14: Global Market Forecast (USD Billion), by Others, 2016-2027
Figure 15: Global Market Value (USD Billion), by Region, 2019 & 2027
Figure 16: North America Robotic Process Automation Market Value Share (%), By Segment 1, 2019 & 2027
Figure 17: North America Market Forecast (USD Billion), by Sub-Segment 1, 2016-2027
Figure 18: North America Market Forecast (USD Billion), by Sub-Segment 2, 2016-2027
Figure 19: North America Market Value Share (%), By Segment 2, 2019 & 2027
Figure 20: North America Market Forecast (USD Billion), by Sub-Segment 1, 2016-2027
Figure 21: North America Market Forecast (USD Billion), by Sub-Segment 2, 2016-2027
Figure 22: North America Market Forecast (USD Billion), by Sub-Segment 3, 2016-2027
Figure 23: North America Market Forecast (USD Billion), by Others, 2016-2027
Figure 24: North America Market Value Share (%), By Segment 3, 2019 & 2027
Figure 25: North America Market Forecast (USD Billion), by Sub-Segment 1, 2016-2027
Figure 26: North America Market Forecast (USD Billion), by Sub-Segment 2, 2016-2027
Figure 27: North America Market Forecast (USD Billion), by Sub-Segment 3, 2016-2027
Figure 28: North America Market Forecast (USD Billion), by Others, 2016-2027
Figure 29: North America Market Forecast (USD Billion), by U.S., 2016-2027
Figure 30: North America Market Forecast (USD Billion), by Canada, 2016-2027
Figure 31: Latin America Robotic Process Automation Market Value Share (%), By Segment 1, 2019 & 2027
Figure 32: Latin America Market Forecast (USD Billion), by Sub-Segment 1, 2016-2027
Figure 33: Latin America Market Forecast (USD Billion), by Sub-Segment 2, 2016-2027
Figure 34: Latin America Market Value Share (%), By Segment 2, 2019 & 2027
Figure 35: Latin America Market Forecast (USD Billion), by Sub-Segment 1, 2016-2027
Figure 36: Latin America Market Forecast (USD Billion), by Sub-Segment 2, 2016-2027
Figure 37: Latin America Market Forecast (USD Billion), by Sub-Segment 3, 2016-2027
Figure 38: Latin America Market Forecast (USD Billion), by Others, 2016-2027
Figure 39: Latin America Market Value Share (%), By Segment 3, 2019 & 2027
Figure 40: Latin America Market Forecast (USD Billion), by Sub-Segment 1, 2016-2027
Figure 41: Latin America Market Forecast (USD Billion), by Sub-Segment 2, 2016-2027
Figure 42: Latin America Market Forecast (USD Billion), by Sub-Segment 3, 2016-2027
Figure 43: Latin America Market Forecast (USD Billion), by Others, 2016-2027
Figure 44: Latin America Market Forecast (USD Billion), by Brazil, 2016-2027
Figure 45: Latin America Market Forecast (USD Billion), by Mexico, 2016-2027
Figure 46: Latin America Market Forecast (USD Billion), by Rest of Latin America, 2016-2027
Figure 47: Europe Robotic Process Automation Market Value Share (%), By Segment 1, 2019 & 2027
Figure 48: Europe Market Forecast (USD Billion), by Sub-Segment 1, 2016-2027
Figure 49: Europe Market Forecast (USD Billion), by Sub-Segment 2, 2016-2027
Figure 50: Europe Market Value Share (%), By Segment 2, 2019 & 2027
Figure 51: Europe Market Forecast (USD Billion), by Sub-Segment 1, 2016-2027
Figure 52: Europe Market Forecast (USD Billion), by Sub-Segment 2, 2016-2027
Figure 53: Europe Market Forecast (USD Billion), by Sub-Segment 3, 2016-2027
Figure 54: Europe Market Forecast (USD Billion), by Others, 2016-2027
Figure 55: Europe Market Value Share (%), By Segment 3, 2019 & 2027
Figure 56: Europe Market Forecast (USD Billion), by Sub-Segment 1, 2016-2027
Figure 57: Europe Market Forecast (USD Billion), by Sub-Segment 2, 2016-2027
Figure 58: Europe Market Forecast (USD Billion), by Sub-Segment 3, 2016-2027
Figure 59: Europe Market Forecast (USD Billion), by Others, 2016-2027
Figure 60: Europe Market Forecast (USD Billion), by U.K., 2016-2027
Figure 61: Europe Market Forecast (USD Billion), by Germany, 2016-2027
Figure 62: Europe Market Forecast (USD Billion), by France, 2016-2027
Figure 63: Europe Market Forecast (USD Billion), by Italy, 2016-2027
Figure 64: Europe Market Forecast (USD Billion), by Spain, 2016-2027
Figure 65: Europe Market Forecast (USD Billion), by Russia, 2016-2027
Figure 66: Europe Market Forecast (USD Billion), by Rest of Europe, 2016-2027
Figure 67: Asia Pacific Robotic Process Automation Market Value Share (%), By Segment 1, 2019 & 2027
Figure 68: Asia Pacific Market Forecast (USD Billion), by Sub-Segment 1, 2016-2027
Figure 69: Asia Pacific Market Forecast (USD Billion), by Sub-Segment 2, 2016-2027
Figure 70: Asia Pacific Market Value Share (%), By Segment 2, 2019 & 2027
Figure 71: Asia Pacific Market Forecast (USD Billion), by Sub-Segment 1, 2016-2027
Figure 72: Asia Pacific Market Forecast (USD Billion), by Sub-Segment 2, 2016-2027
Figure 73: Asia Pacific Market Forecast (USD Billion), by Sub-Segment 3, 2016-2027
Figure 74: Asia Pacific Market Forecast (USD Billion), by Others, 2016-2027
Figure 75: Asia Pacific Market Value Share (%), By Segment 3, 2019 & 2027
Figure 76: Asia Pacific Market Forecast (USD Billion), by Sub-Segment 1, 2016-2027
Figure 77: Asia Pacific Market Forecast (USD Billion), by Sub-Segment 2, 2016-2027
Figure 78: Asia Pacific Market Forecast (USD Billion), by Sub-Segment 3, 2016-2027
Figure 79: Asia Pacific Market Forecast (USD Billion), by Others, 2016-2027
Figure 80: Asia Pacific Market Forecast (USD Billion), by China, 2016-2027
Figure 81: Asia Pacific Market Forecast (USD Billion), by India, 2016-2027
Figure 82: Asia Pacific Market Forecast (USD Billion), by Japan, 2016-2027
Figure 83: Asia Pacific Market Forecast (USD Billion), by Australia, 2016-2027
Figure 84: Asia Pacific Market Forecast (USD Billion), by Southeast Asia, 2016-2027
Figure 85: Asia Pacific Market Forecast (USD Billion), by Rest of Asia Pacific, 2016-2027
Figure 86: Middle East & Africa Robotic Process Automation Market Value Share (%), By Segment 1, 2019 & 2027
Figure 87: Middle East & Africa Market Forecast (USD Billion), by Sub-Segment 1, 2016-2027
Figure 88: Middle East & Africa Market Forecast (USD Billion), by Sub-Segment 2, 2016-2027
Figure 89: Middle East & Africa Market Value Share (%), By Segment 2, 2019 & 2027
Figure 90: Middle East & Africa Market Forecast (USD Billion), by Sub-Segment 1, 2016-2027
Figure 91: Middle East & Africa Market Forecast (USD Billion), by Sub-Segment 2, 2016-2027
Figure 92: Middle East & Africa Market Forecast (USD Billion), by Sub-Segment 3, 2016-2027
Figure 93: Middle East & Africa Market Forecast (USD Billion), by Others, 2016-2027
Figure 94: Middle East & Africa Market Value Share (%), By Segment 3, 2019 & 2027
Figure 95: Middle East & Africa Market Forecast (USD Billion), by Sub-Segment 1, 2016-2027
Figure 96: Middle East & Africa Market Forecast (USD Billion), by Sub-Segment 2, 2016-2027
Figure 97: Middle East & Africa Market Forecast (USD Billion), by Sub-Segment 3, 2016-2027
Figure 98: Middle East & Africa Market Forecast (USD Billion), by Others, 2016-2027
Figure 99: Middle East & Africa Market Forecast (USD Billion), by GCC, 2016-2027
Figure 100: Middle East & Africa Market Forecast (USD Billion), by South Africa, 2016-2027
Figure 101: Middle East & Africa Market Forecast (USD Billion), by Rest of Middle East & Africa, 2016-2027
List of Tables
Table 1: Global Robotic Process Automation Market Revenue (USD Billion) Forecast, by Segment 1, 2016-2027
Table 2: Global Market Revenue (USD Billion) Forecast, by Segment 2, 2016-2027
Table 3: Global Market Revenue (USD Billion) Forecast, by Segment 3, 2016-2027
Table 4: Global Market Revenue (USD Billion) Forecast, by Region, 2016-2027
Table 5: North America Robotic Process Automation Market Revenue (USD Billion) Forecast, by Segment 1, 2016-2027
Table 6: North America Market Revenue (USD Billion) Forecast, by Segment 2, 2016-2027
Table 7: North America Market Revenue (USD Billion) Forecast, by Segment 3, 2016-2027
Table 8: North America Market Revenue (USD Billion) Forecast, by Country, 2016-2027
Table 9: Europe Robotic Process Automation Market Revenue (USD Billion) Forecast, by Segment 1, 2016-2027
Table 10: Europe Market Revenue (USD Billion) Forecast, by Segment 2, 2016-2027
Table 11: Europe Market Revenue (USD Billion) Forecast, by Segment 3, 2016-2027
Table 12: Europe Market Revenue (USD Billion) Forecast, by Country, 2016-2027
Table 13: Latin America Robotic Process Automation Market Revenue (USD Billion) Forecast, by Segment 1, 2016-2027
Table 14: Latin America Market Revenue (USD Billion) Forecast, by Segment 2, 2016-2027
Table 15: Latin America Market Revenue (USD Billion) Forecast, by Segment 3, 2016-2027
Table 16: Latin America Market Revenue (USD Billion) Forecast, by Country, 2016-2027
Table 17: Asia Pacific Robotic Process Automation Market Revenue (USD Billion) Forecast, by Segment 1, 2016-2027
Table 18: Asia Pacific Market Revenue (USD Billion) Forecast, by Segment 2, 2016-2027
Table 19: Asia Pacific Market Revenue (USD Billion) Forecast, by Segment 3, 2016-2027
Table 20: Asia Pacific Market Revenue (USD Billion) Forecast, by Country, 2016-2027
Table 21: Middle East & Africa Robotic Process Automation Market Revenue (USD Billion) Forecast, by Segment 1, 2016-2027
Table 22: Middle East & Africa Market Revenue (USD Billion) Forecast, by Segment 2, 2016-2027
Table 23: Middle East & Africa Market Revenue (USD Billion) Forecast, by Segment 3, 2016-2027
Table 24: Middle East & Africa Market Revenue (USD Billion) Forecast, by Country, 2016-2027
Research Process
Data Library Research are conducted by industry experts who offer insight on
industry structure, market segmentations technology assessment and competitive landscape (CL), and penetration, as well as on emerging trends. Their analysis is based on primary interviews (~ 80%) and secondary research (~ 20%) as well as years of professional expertise in their respective industries. Adding to this, by analysing historical trends and current market positions, our analysts predict where the market will be headed for the next five years. Furthermore, the varying trends of segment & categories geographically presented are also studied and the estimated based on the primary & secondary research.
In this particular report from the supply side Data Library Research has conducted primary surveys (interviews) with the key level executives (VP, CEO’s, Marketing Director, Business Development Manager
and SOFT) of the companies that active & prominent as well as the midsized organization
FIGURE 1: DLR RESEARH PROCESS
Primary Research
Extensive primary research was conducted to gain a deeper insight of the market and industry performance. The analysis is based on both primary and secondary research as well as years of professional expertise in the respective industries.
In addition to analysing current and historical trends, our analysts predict where the market is headed over the next five years.
It varies by segment for these categories geographically presented in the list of market tables. Speaking about this particular report we have conducted primary surveys (interviews) with the key level executives (VP, CEO’s, Marketing Director, Business Development Manager and many more) of the major players active in the market.
Secondary Research
Secondary research was mainly used to collect and identify information useful for the extensive, technical, market-oriented, and Friend’s study of the Global Extra Neutral Alcohol. It was also used to obtain key information about major players, market classification and segmentation according to the industry trends, geographical markets, and developments related to the market and technology perspectives. For this study, analysts have gathered information from various credible sources, such as annual reports, sec filings, journals, white papers, SOFT presentations, and company web sites.
Market Size Estimation
Both, top-down and bottom-up approaches were used to estimate and validate the size of the Global market and to estimate the size of various other dependent submarkets in the overall Extra Neutral Alcohol. The key players in the market were identified through secondary research and their market contributions in the respective geographies were determined through primary and secondary research.
Forecast Model