Satellite Solar Panel Market Overview and Analysis

The Global Satellite Solar Panel Market size was estimated at USD 687.9 million in 2025 and is expected to grow at a CAGR of 8.5% from 2025 to 2032, reaching USD 900.9 million in the year 2032.

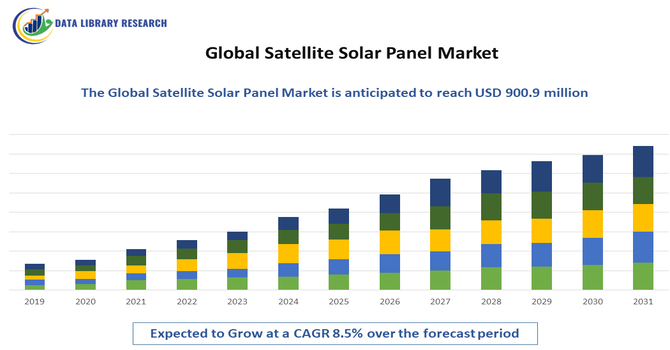
The Global Satellite Solar Panel Market is witnessing robust growth, driven by the rising number of satellite launches for communication, earth observation, navigation, and defense applications. Satellite solar panels play a crucial role in providing a continuous and reliable power source in space, making them a fundamental component of satellite systems. The increasing investments in space exploration missions by government agencies such as NASA, ESA, ISRO, and private players like SpaceX, Blue Origin, and OneWeb are significantly propelling market expansion. Moreover, the growing demand for high-efficiency and lightweight solar panels, particularly those made from advanced materials such as gallium arsenide (GaAs) and multi-junction solar cells, is fueling technological advancements in this domain.

Satellite Solar Panel Market Latest Trends

The global satellite solar panel market is rapidly evolving, with several key trends reshaping the landscape. One major trend is the emergence of ultra-lightweight and deployable/fold-out solar array technologies, which reduce launch mass and stowage volume while expanding power-generating surface area in orbit. Another important trend is the drive toward higher efficiency solar cells including multi-junction and thin-film materials that can deliver greater power output for a given area, meeting the demanding energy budgets of mega-constellations and extended missions. The proliferation of small satellites and LEO constellations has also spurred demand for compact, high-power-density solar panels tailored to limited payloads, enabling new commercial opportunities and business models.

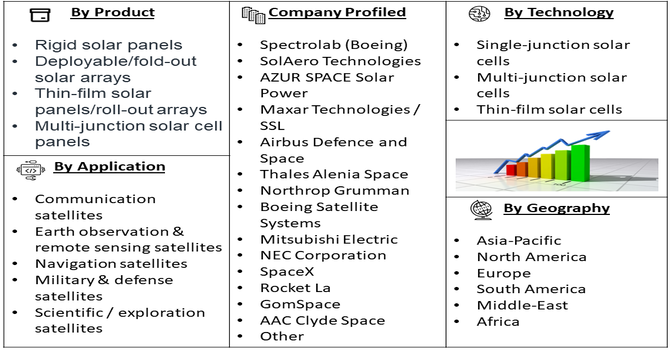
Segmentation: Global Satellite Solar Panel Market is segmented By Product (Rigid solar panels, Deployable/fold-out solar arrays, Thin-film solar panels/roll-out arrays, Multi-junction solar cell panels), Technology (Single-junction solar cells, Multi-junction solar cells, Thin-film solar cells), Application (Communication satellites, Earth observation & remote sensing satellites, Navigation satellites, Military & defense satellites, Scientific / exploration satellites), and Geography (North America, Europe, Asia-Pacific, Middle East and Africa, and South America). The report provides the value (in USD million) for the above segments.

Market Drivers:

  • Surge in Satellite Deployments & Mega-Constellations

One of the primary growth drivers for the global satellite solar panel market is the sharp increase in satellite launches—particularly in the areas of communications (broadband internet), Earth observation, remote sensing and navigation. For example, the expansion of low Earth orbit (LEO) mega-constellations by companies such as SpaceX, OneWeb and others means that hundreds to thousands of satellites are being launched, each requiring reliable, lightweight, high-efficiency solar power sources.

These solar panels must deliver consistent power under harsh space conditions (radiation, temperature extremes, eclipse periods) and must often be compact and mass-efficient. As more satellites are deployed for new applications (global connectivity, IoT, Earth monitoring), the demand for specialized solar panel arrays tailored for these satellite systems rises accordingly.

  • Technological Advancements & Efficiency Gains in Solar Panel Systems

A second major driver is the continual advancement in solar cell and array technology for space applications—this includes higher conversion efficiencies (multi-junction cells, GaAs substrates), lighter materials, deployable/fold-out array designs, radiation-hardened composites and integrated power management systems. These improvements make solar panels more attractive to satellite OEMs because they can deliver more power for a given size and mass, extend mission lifetime and improve performance in space. As material science, manufacturing processes and space-qualified design mature, the cost per watt of space solar panels gradually declines and new satellite architectures (smallsats, cubesats, flexible arrays) become feasible—driving further adoption of advanced solar panels in the satellite market.

Market Restraints:

  • High Development, Manufacturing & Launch Costs

The production of space-qualified solar panels demands advanced materials (multi-junction photovoltaic cells, radiation-hardened substrates, lightweight composite structures) and rigorous testing to survive extreme conditions in orbit. These factors elevate unit costs significantly compared to terrestrial solar systems. Moreover, the cost of launching the satellite payload (including solar arrays) remains substantial and adds to project economics pressure.

Socio Economic Impact on Satellite Solar Panel Market

The Global Satellite Solar Panel Market has significant socioeconomic impacts, driving advancements in space technology and renewable energy sectors. The expansion of satellite solar panels enhances the efficiency and reliability of satellites, which support critical services like global communications, weather forecasting, and navigation. This market fosters high-tech job creation in engineering, manufacturing, and research, contributing to economic growth in both developed and emerging regions. Additionally, improved satellite capabilities enable better environmental monitoring and disaster management, benefiting societies worldwide. The market also encourages investments in sustainable energy solutions, aligning with global efforts to reduce carbon emissions. By enabling broader access to satellite technology, the market promotes digital inclusion and connectivity, helping bridge socioeconomic gaps and supporting global development goals.

Segmental Analysis:

  • Deployable/Fold-Out Solar Arrays segment is expected to witness highest growth over the forecast period

The deployable/fold-out solar arrays segment is expected to dominate the market over the forecast period due to their high power output and compact design, which are crucial for space missions with limited payload capacity. These arrays can be stowed efficiently during launch and deployed in orbit to maximize surface area for energy generation. Their use in large communication satellites, as well as deep-space exploration missions, makes them a preferred choice among satellite manufacturers. The advancement in lightweight composite materials and flexible structures further enhances their durability and performance in harsh space environments, supporting their widespread adoption.

  • Multi-Junction Solar Cells segment is expected to witness highest growth over the forecast period

The multi-junction solar cells segment holds a significant share and is projected to witness the fastest growth during the forecast period. These cells are known for their superior efficiency often exceeding 30% by using multiple semiconductor layers that capture different wavelengths of sunlight. This technology is particularly advantageous in maximizing power output for high-performance satellites, such as those in geostationary or deep-space missions. The increasing demand for higher power density, longer satellite lifespans, and resistance to radiation degradation is driving the adoption of multi-junction cells, especially those made from gallium arsenide (GaAs) and indium gallium phosphide (InGaP).

  • Communication Satellites segment is expected to witness highest growth over the forecast period

The communication satellites segment accounts for the largest share of the market and continues to grow rapidly due to the surge in global broadband demand and the proliferation of Low Earth Orbit (LEO) constellations. Companies such as SpaceX (Starlink), OneWeb, and Amazon (Project Kuiper) are launching hundreds of satellites equipped with high-efficiency solar panels to power advanced transponders and antennas. The need for continuous, reliable power in orbit makes solar panels indispensable in ensuring uninterrupted data transmission and connectivity. This segment benefits from ongoing developments in modular satellite designs and automated panel integration.

  • North America region is expected to witness highest growth over the forecast period

The North America region is expected to witness the highest growth over the forecast period in the Global Satellite Solar Panel Market. This growth is primarily driven by the rapid expansion of satellite deployment programs and strong investments in space exploration and communication infrastructure. The United States, in particular, remains a global leader in satellite manufacturing and launches, supported by major agencies such as NASA, the Department of Defense (DoD), and commercial space companies like SpaceX, Blue Origin, and Northrop Grumman. Increasing demand for high-performance solar arrays for Low Earth Orbit (LEO) constellations, deep-space missions, and defense applications is fueling market expansion.

Additionally, the presence of leading solar panel technology developers, advanced R&D facilities, and supportive government initiatives aimed at enhancing space capabilities further strengthen the regional market. The growing trend toward reusable rockets and cost-efficient launch systems also enhances accessibility for small satellite operators, ensuring sustained demand for efficient, lightweight, and radiation-resistant satellite solar panels in North America.

Satellite Solar Panel Market Competitive Landscape

The market is highly consolidated and intensely competitive, dominated by a few specialized, high-tech manufacturers with proven space heritage and proprietary technology. Key players like Spectrolab (Boeing subsidiary), AZUR SPACE, and SolAero (now Maxar) lead in the core technology of high-efficiency multi-junction solar cells, which have extremely high barriers to entry. Competition focuses less on cost and more on maximum power-to-mass ratio, radiation hardness, and long-term reliability. Large defense contractors and aerospace integrators such as Airbus and Northrop Grumman are also major forces, leveraging their ability to integrate complete, complex solar array systems for government and commercial satellite programs. The Global Satellite Solar Panel Market is highly competitive and characterized by the presence of established aerospace corporations and specialized solar technology providers.

Leading players such as:

  • Spectrolab (Boeing)
  • SolAero Technologies
  • AZUR SPACE Solar Power
  • Maxar Technologies / SSL
  • Airbus Defence and Space
  • Thales Alenia Space
  • Northrop Grumman
  • Boeing Satellite Systems
  • Mitsubishi Electric
  • NEC Corporation
  • SpaceX
  • Rocket La
  • GomSpace
  • AAC Clyde Space
  • Surrey Satellite Technology Ltd (SSTL)
  • EnduroSat
  • Honeywell Aerospace
  • Ball Aerospace
  • Sierra Nevada Corporation
  • L3Harris Technologies

Recent Development

  • In May 2025, Solestial, Inc., a solar energy company focused on space applications, announced the successful closing of its USD 17 million Series A funding round led by AE Ventures. The round also included new investors such as Crosscut Ventures, Zeon Ventures, and Mitsubishi Electric Corporation's ME Innovation Fund, alongside participation from existing backers including Airbus Ventures, General Purpose Venture Capital, Industrious Ventures, Stellar Ventures, and Techstars. This funding milestone is expected to accelerate Solestial’s innovation and production capabilities, positively impacting the Global Satellite Solar Panel Market by driving technological advancements, expanding market capacity, and enhancing the deployment of efficient solar power solutions for satellites and space infrastructure.


  • In July 2025, Atomic-6, a leading manufacturer of premium composite solutions, secured a USD 2 million Tactical Funding Increase (TACFI) from the United States Space Force Space Systems Command to advance and flight-qualify its Light Wing™ solar array for both commercial and defense applications. This funding boost is set to accelerate the development and deployment of innovative solar panel technology for satellites, strengthening Atomic-6’s position in the market. The advancement is expected to positively impact the Global Satellite Solar Panel Market by enhancing the performance and reliability of satellite power systems, driving demand across defense and commercial sectors, and promoting the adoption of cutting-edge solar solutions in space technologies worldwide.


Frequently Asked Questions (FAQ) :

Q1. What are the main growth driving factors for this market?

The market is rapidly driven by the massive deployment of small satellite constellations for communication (like Starlink) and Earth observation, which requires thousands of lightweight, high-power-density solar panels. Coupled with this is the continuous global expansion of space exploration initiatives by government agencies and private entities. Advances in material science, particularly in developing highly efficient, radiation-hardened multi-junction solar cells, are also crucial for ensuring long-term mission reliability and maximizing power output in space. (98 words)

Q2. What are the main restraining factors for this market?

The main constraints are the harsh, unforgiving space environment, where solar panels face extreme temperature fluctuations and damaging radiation that cause long-term degradation, requiring specialized, expensive components. Furthermore, the market relies on a limited number of highly specialized manufacturers capable of producing space-grade solar cells and arrays that meet stringent regulatory and performance standards. This specialization translates to high initial manufacturing costs compared to terrestrial solar panels, creating financial barriers.

Q3. Which segment is expected to witness high growth?

The Small Satellite (SmallSat) application segment is expected to witness the highest growth, driven by the shift towards deploying large-scale, low-Earth orbit (LEO) constellations. These small satellites require highly efficient, lightweight, and often flexible solar panels to reduce launch mass and optimize power generation within a compact design. By technology, multi-junction solar cells (especially triple-junction) will continue to dominate this growth due to their superior efficiency in converting sunlight into electricity in space. (98 words)

Q4. Who are the top major players for this market?

The market is dominated by companies that specialize in high-efficiency, space-grade solar cell technology and large defense contractors who integrate these systems. Top major players include Spectrolab, Inc. (a subsidiary of Boeing, known for multi-junction cells), AZUR SPACE Solar Power GmbH, and SolAero Technologies Corp. (now part of Maxar Technologies). Large aerospace and defense companies like Airbus Defence and Space and Northrop Grumman are also key integrators and manufacturers of full solar arrays for satellites. (97 words)

Q5. Which country is the largest player?

North America, primarily the United States, is typically cited as the largest market player by revenue share. This is due to the presence of major space agencies (NASA), pioneering commercial space companies (like SpaceX), leading defense contractors, and highly specialized solar cell manufacturers. The immense private and public investment in both large and small satellite programs, coupled with established infrastructure, supports the continuous demand and technological leadership in this highly specialized segment. (96 words)

Satellite Solar Panel MARKET STUDY GLOBAL MARKET ANALYSIS, INSIGHTS AND FORECAST, 2022-2029

    1. Introduction

    • 1.1. Research Scope
    • 1.2. Market Segmentation
    • 1.3. Research Methodology
    • 1.4. Definitions and Assumptions

    2. Executive Summary

      3. Market Dynamics

      • 3.1. Market Drivers
      • 3.2. Market Restraints
      • 3.3. Market Opportunities

      4. Key Insights

      • 4.1. Key Emerging Trends – For Major Countries
      • 4.2. Latest Technological Advancement
      • 4.3. Regulatory Landscape
      • 4.4. Industry SWOT Analysis
      • 4.5. Porters Five Forces Analysis

      5. Global Satellite Solar Panel Market Analysis (USD Billion), Insights and Forecast, 2018-2029

      • 5.1. Key Findings / Summary
      • 5.2. Market Analysis, Insights and Forecast – By Segment 1
        • 5.2.1. Sub-Segment 1
        • 5.2.2. Sub-Segment 2
      • 5.3. Market Analysis, Insights and Forecast – By Segment 2
        • 5.3.1. Sub-Segment 1
        • 5.3.2. Sub-Segment 2
        • 5.3.3. Sub-Segment 3
        • 5.3.4. Others
      • 5.4. Market Analysis, Insights and Forecast – By Segment 3
        • 5.4.1. Sub-Segment 1
        • 5.4.2. Sub-Segment 2
        • 5.4.3. Sub-Segment 3
        • 5.4.4. Others
      • 5.5. Market Analysis, Insights and Forecast – By Region
        • 5.5.1. North America
        • 5.5.2. Latin America
        • 5.5.3. Europe
        • 5.5.4. Asia Pacific
        • 5.5.5. Middle East and Africa

      6. North America Satellite Solar Panel Market Analysis (USD Billion), Insights and Forecast, 2018-2029

      • 6.1. Key Findings / Summary
      • 6.2. Market Analysis, Insights and Forecast – By Segment 1
        • 6.2.1. Sub-Segment 1
        • 6.2.2. Sub-Segment 2
      • 6.3. Market Analysis, Insights and Forecast – By Segment 2
        • 6.3.1. Sub-Segment 1
        • 6.3.2. Sub-Segment 2
        • 6.3.3. Sub-Segment 3
        • 6.3.4. Others
      • 6.4. Market Analysis, Insights and Forecast – By Segment 3
        • 6.4.1. Sub-Segment 1
        • 6.4.2. Sub-Segment 2
        • 6.4.3. Sub-Segment 3
        • 6.4.4. Others
      • 6.5. Market Analysis, Insights and Forecast – By Country
        • 6.5.1. U.S.
        • 6.5.2. Canada

      7. Latin America Satellite Solar Panel Market Analysis (USD Billion), Insights and Forecast, 2018-2029

      • 7.1. Key Findings / Summary
      • 7.2. Market Analysis, Insights and Forecast – By Segment 1
        • 7.2.1. Sub-Segment 1
        • 7.2.2. Sub-Segment 2
      • 7.3. Market Analysis, Insights and Forecast – By Segment 2
        • 7.3.1. Sub-Segment 1
        • 7.3.2. Sub-Segment 2
        • 7.3.3. Sub-Segment 3
        • 7.3.4. Others
      • 7.4. Market Analysis, Insights and Forecast – By Segment 3
        • 7.4.1. Sub-Segment 1
        • 7.4.2. Sub-Segment 2
        • 7.4.3. Sub-Segment 3
        • 7.4.4. Others
      • 7.5. Insights and Forecast – By Country
        • 7.5.1. Brazil
        • 7.5.2. Mexico
        • 7.5.3. Rest of Latin America

      8. Europe Satellite Solar Panel Market Analysis (USD Billion), Insights and Forecast, 2018-2029

      • 8.1. Key Findings / Summary
      • 8.2. Market Analysis, Insights and Forecast – By Segment 1
        • 8.2.1. Sub-Segment 1
        • 8.2.2. Sub-Segment 2
      • 8.3. Market Analysis, Insights and Forecast – By Segment 2
        • 8.3.1. Sub-Segment 1
        • 8.3.2. Sub-Segment 2
        • 8.3.3. Sub-Segment 3
        • 8.3.4. Others
      • 8.4. Market Analysis, Insights and Forecast – By Segment 3
        • 8.4.1. Sub-Segment 1
        • 8.4.2. Sub-Segment 2
        • 8.4.3. Sub-Segment 3
        • 8.4.4. Others
      • 8.5. Market Analysis, Insights and Forecast – By Country
        • 8.5.1. UK
        • 8.5.2. Germany
        • 8.5.3. France
        • 8.5.4. Italy
        • 8.5.5. Spain
        • 8.5.6. Russia
        • 8.5.7. Rest of Europe

      9. Asia Pacific Satellite Solar Panel Market Analysis (USD Billion), Insights and Forecast, 2018-2029

      • 9.1. Key Findings / Summary
      • 9.2. Market Analysis, Insights and Forecast – By Segment 1
        • 9.2.1. Sub-Segment 1
        • 9.2.2. Sub-Segment 2
      • 9.3. Market Analysis, Insights and Forecast – By Segment 2
        • 9.3.1. Sub-Segment 1
        • 9.3.2. Sub-Segment 2
        • 9.3.3. Sub-Segment 3
        • 9.3.4. Others
      • 9.4. Market Analysis, Insights and Forecast – By Segment 3
        • 9.4.1. Sub-Segment 1
        • 9.4.2. Sub-Segment 2
        • 9.4.3. Sub-Segment 3
        • 9.4.4. Others
      • 9.5. Market Analysis, Insights and Forecast – By Country
        • 9.5.1. China
        • 9.5.2. India
        • 9.5.3. Japan
        • 9.5.4. Australia
        • 9.5.5. South East Asia
        • 9.5.6. Rest of Asia Pacific

      10. Middle East & Africa Satellite Solar Panel Market Analysis (USD Billion), Insights and Forecast, 2018-2029

      • 10.1. Key Findings / Summary
      • 10.2. Market Analysis, Insights and Forecast – By Segment 1
        • 10.2.1. Sub-Segment 1
        • 10.2.2. Sub-Segment 2
      • 10.3. Market Analysis, Insights and Forecast – By Segment 2
        • 10.3.1. Sub-Segment 1
        • 10.3.2. Sub-Segment 2
        • 10.3.3. Sub-Segment 3
        • 10.3.4. Others
      • 10.4. Market Analysis, Insights and Forecast – By Segment 3
        • 10.4.1. Sub-Segment 1
        • 10.4.2. Sub-Segment 2
        • 10.4.3. Sub-Segment 3
        • 10.4.4. Others
      • 10.5. Market Analysis, Insights and Forecast – By Country
        • 10.5.1. GCC
        • 10.5.2. South Africa
        • 10.5.3. Rest of Middle East & Africa

      11. Competitive Analysis

      • 11.1. Company Market Share Analysis, 2018
      • 11.2. Key Industry Developments
      • 11.3. Company Profile
        • 11.3.1. Company 1
          • 11.3.1.1. Business Overview
          • 11.3.1.2. Segment 1 & Service Offering
          • 11.3.1.3. Overall Revenue
          • 11.3.1.4. Geographic Presence
          • 11.3.1.5. Recent Development
        *Similar details will be provided for the following companies
        • 11.3.2. Company 2
        • 11.3.3. Company 3
        • 11.3.4. Company 4
        • 11.3.5. Company 5
        • 11.3.6. Company 6
        • 11.3.7. Company 7
        • 11.3.8. Company 8
        • 11.3.9. Company 9
        • 11.3.10. Company 10
        • 11.3.11. Company 11
        • 11.3.12. Company 12
      List of Figures

      Figure 1: Global Satellite Solar Panel Market Revenue Breakdown (USD Billion, %) by Region, 2022 & 2029
      Figure 2: Global Satellite Solar Panel Market Value Share (%), By Segment 1, 2022 & 2029
      Figure 3: Global Satellite Solar Panel Market Forecast (USD Billion), by Sub-Segment 1, 2018-2029
      Figure 4: Global Satellite Solar Panel Market Forecast (USD Billion), by Sub-Segment 2, 2018-2029
      Figure 5: Global Satellite Solar Panel Market Value Share (%), By Segment 2, 2022 & 2029
      Figure 6: Global Satellite Solar Panel Market Forecast (USD Billion), by Sub-Segment 1, 2018-2029
      Figure 7: Global Satellite Solar Panel Market Forecast (USD Billion), by Sub-Segment 2, 2018-2029
      Figure 8: Global Satellite Solar Panel Market Forecast (USD Billion), by Sub-Segment 3, 2018-2029
      Figure 9: Global Satellite Solar Panel Market Forecast (USD Billion), by Others, 2018-2029
      Figure 10: Global Satellite Solar Panel Market Value Share (%), By Segment 3, 2022 & 2029
      Figure 11: Global Satellite Solar Panel Market Forecast (USD Billion), by Sub-Segment 1, 2018-2029
      Figure 12: Global Satellite Solar Panel Market Forecast (USD Billion), by Sub-Segment 2, 2018-2029
      Figure 13: Global Satellite Solar Panel Market Forecast (USD Billion), by Sub-Segment 3, 2018-2029
      Figure 14: Global Satellite Solar Panel Market Forecast (USD Billion), by Others, 2018-2029
      Figure 15: Global Satellite Solar Panel Market Value (USD Billion), by Region, 2022 & 2029
      Figure 16: North America Satellite Solar Panel Market Value Share (%), By Segment 1, 2022 & 2029
      Figure 17: North America Satellite Solar Panel Market Forecast (USD Billion), by Sub-Segment 1, 2018-2029
      Figure 18: North America Satellite Solar Panel Market Forecast (USD Billion), by Sub-Segment 2, 2018-2029
      Figure 19: North America Satellite Solar Panel Market Value Share (%), By Segment 2, 2022 & 2029
      Figure 20: North America Satellite Solar Panel Market Forecast (USD Billion), by Sub-Segment 1, 2018-2029
      Figure 21: North America Satellite Solar Panel Market Forecast (USD Billion), by Sub-Segment 2, 2018-2029
      Figure 22: North America Satellite Solar Panel Market Forecast (USD Billion), by Sub-Segment 3, 2018-2029
      Figure 23: North America Satellite Solar Panel Market Forecast (USD Billion), by Others, 2018-2029
      Figure 24: North America Satellite Solar Panel Market Value Share (%), By Segment 3, 2022 & 2029
      Figure 25: North America Satellite Solar Panel Market Forecast (USD Billion), by Sub-Segment 1, 2018-2029
      Figure 26: North America Satellite Solar Panel Market Forecast (USD Billion), by Sub-Segment 2, 2018-2029
      Figure 27: North America Satellite Solar Panel Market Forecast (USD Billion), by Sub-Segment 3, 2018-2029
      Figure 28: North America Satellite Solar Panel Market Forecast (USD Billion), by Others, 2018-2029
      Figure 29: North America Satellite Solar Panel Market Forecast (USD Billion), by U.S., 2018-2029
      Figure 30: North America Satellite Solar Panel Market Forecast (USD Billion), by Canada, 2018-2029
      Figure 31: Latin America Satellite Solar Panel Market Value Share (%), By Segment 1, 2022 & 2029
      Figure 32: Latin America Satellite Solar Panel Market Forecast (USD Billion), by Sub-Segment 1, 2018-2029
      Figure 33: Latin America Satellite Solar Panel Market Forecast (USD Billion), by Sub-Segment 2, 2018-2029
      Figure 34: Latin America Satellite Solar Panel Market Value Share (%), By Segment 2, 2022 & 2029
      Figure 35: Latin America Satellite Solar Panel Market Forecast (USD Billion), by Sub-Segment 1, 2018-2029
      Figure 36: Latin America Satellite Solar Panel Market Forecast (USD Billion), by Sub-Segment 2, 2018-2029
      Figure 37: Latin America Satellite Solar Panel Market Forecast (USD Billion), by Sub-Segment 3, 2018-2029
      Figure 38: Latin America Satellite Solar Panel Market Forecast (USD Billion), by Others, 2018-2029
      Figure 39: Latin America Satellite Solar Panel Market Value Share (%), By Segment 3, 2022 & 2029
      Figure 40: Latin America Satellite Solar Panel Market Forecast (USD Billion), by Sub-Segment 1, 2018-2029
      Figure 41: Latin America Satellite Solar Panel Market Forecast (USD Billion), by Sub-Segment 2, 2018-2029
      Figure 42: Latin America Satellite Solar Panel Market Forecast (USD Billion), by Sub-Segment 3, 2018-2029
      Figure 43: Latin America Satellite Solar Panel Market Forecast (USD Billion), by Others, 2018-2029
      Figure 44: Latin America Satellite Solar Panel Market Forecast (USD Billion), by Brazil, 2018-2029
      Figure 45: Latin America Satellite Solar Panel Market Forecast (USD Billion), by Mexico, 2018-2029
      Figure 46: Latin America Satellite Solar Panel Market Forecast (USD Billion), by Rest of Latin America, 2018-2029
      Figure 47: Europe Satellite Solar Panel Market Value Share (%), By Segment 1, 2022 & 2029
      Figure 48: Europe Satellite Solar Panel Market Forecast (USD Billion), by Sub-Segment 1, 2018-2029
      Figure 49: Europe Satellite Solar Panel Market Forecast (USD Billion), by Sub-Segment 2, 2018-2029
      Figure 50: Europe Satellite Solar Panel Market Value Share (%), By Segment 2, 2022 & 2029
      Figure 51: Europe Satellite Solar Panel Market Forecast (USD Billion), by Sub-Segment 1, 2018-2029
      Figure 52: Europe Satellite Solar Panel Market Forecast (USD Billion), by Sub-Segment 2, 2018-2029
      Figure 53: Europe Satellite Solar Panel Market Forecast (USD Billion), by Sub-Segment 3, 2018-2029
      Figure 54: Europe Satellite Solar Panel Market Forecast (USD Billion), by Others, 2018-2029
      Figure 55: Europe Satellite Solar Panel Market Value Share (%), By Segment 3, 2022 & 2029
      Figure 56: Europe Satellite Solar Panel Market Forecast (USD Billion), by Sub-Segment 1, 2018-2029
      Figure 57: Europe Satellite Solar Panel Market Forecast (USD Billion), by Sub-Segment 2, 2018-2029
      Figure 58: Europe Satellite Solar Panel Market Forecast (USD Billion), by Sub-Segment 3, 2018-2029
      Figure 59: Europe Satellite Solar Panel Market Forecast (USD Billion), by Others, 2018-2029
      Figure 60: Europe Satellite Solar Panel Market Forecast (USD Billion), by U.K., 2018-2029
      Figure 61: Europe Satellite Solar Panel Market Forecast (USD Billion), by Germany, 2018-2029
      Figure 62: Europe Satellite Solar Panel Market Forecast (USD Billion), by France, 2018-2029
      Figure 63: Europe Satellite Solar Panel Market Forecast (USD Billion), by Italy, 2018-2029
      Figure 64: Europe Satellite Solar Panel Market Forecast (USD Billion), by Spain, 2018-2029
      Figure 65: Europe Satellite Solar Panel Market Forecast (USD Billion), by Russia, 2018-2029
      Figure 66: Europe Satellite Solar Panel Market Forecast (USD Billion), by Rest of Europe, 2018-2029
      Figure 67: Asia Pacific Satellite Solar Panel Market Value Share (%), By Segment 1, 2022 & 2029
      Figure 68: Asia Pacific Satellite Solar Panel Market Forecast (USD Billion), by Sub-Segment 1, 2018-2029
      Figure 69: Asia Pacific Satellite Solar Panel Market Forecast (USD Billion), by Sub-Segment 2, 2018-2029
      Figure 70: Asia Pacific Satellite Solar Panel Market Value Share (%), By Segment 2, 2022 & 2029
      Figure 71: Asia Pacific Satellite Solar Panel Market Forecast (USD Billion), by Sub-Segment 1, 2018-2029
      Figure 72: Asia Pacific Satellite Solar Panel Market Forecast (USD Billion), by Sub-Segment 2, 2018-2029
      Figure 73: Asia Pacific Satellite Solar Panel Market Forecast (USD Billion), by Sub-Segment 3, 2018-2029
      Figure 74: Asia Pacific Satellite Solar Panel Market Forecast (USD Billion), by Others, 2018-2029
      Figure 75: Asia Pacific Satellite Solar Panel Market Value Share (%), By Segment 3, 2022 & 2029
      Figure 76: Asia Pacific Satellite Solar Panel Market Forecast (USD Billion), by Sub-Segment 1, 2018-2029
      Figure 77: Asia Pacific Satellite Solar Panel Market Forecast (USD Billion), by Sub-Segment 2, 2018-2029
      Figure 78: Asia Pacific Satellite Solar Panel Market Forecast (USD Billion), by Sub-Segment 3, 2018-2029
      Figure 79: Asia Pacific Satellite Solar Panel Market Forecast (USD Billion), by Others, 2018-2029
      Figure 80: Asia Pacific Satellite Solar Panel Market Forecast (USD Billion), by China, 2018-2029
      Figure 81: Asia Pacific Satellite Solar Panel Market Forecast (USD Billion), by India, 2018-2029
      Figure 82: Asia Pacific Satellite Solar Panel Market Forecast (USD Billion), by Japan, 2018-2029
      Figure 83: Asia Pacific Satellite Solar Panel Market Forecast (USD Billion), by Australia, 2018-2029
      Figure 84: Asia Pacific Satellite Solar Panel Market Forecast (USD Billion), by Southeast Asia, 2018-2029
      Figure 85: Asia Pacific Satellite Solar Panel Market Forecast (USD Billion), by Rest of Asia Pacific, 2018-2029
      Figure 86: Middle East & Africa Satellite Solar Panel Market Value Share (%), By Segment 1, 2022 & 2029
      Figure 87: Middle East & Africa Satellite Solar Panel Market Forecast (USD Billion), by Sub-Segment 1, 2018-2029
      Figure 88: Middle East & Africa Satellite Solar Panel Market Forecast (USD Billion), by Sub-Segment 2, 2018-2029
      Figure 89: Middle East & Africa Satellite Solar Panel Market Value Share (%), By Segment 2, 2022 & 2029
      Figure 90: Middle East & Africa Satellite Solar Panel Market Forecast (USD Billion), by Sub-Segment 1, 2018-2029
      Figure 91: Middle East & Africa Satellite Solar Panel Market Forecast (USD Billion), by Sub-Segment 2, 2018-2029
      Figure 92: Middle East & Africa Satellite Solar Panel Market Forecast (USD Billion), by Sub-Segment 3, 2018-2029
      Figure 93: Middle East & Africa Satellite Solar Panel Market Forecast (USD Billion), by Others, 2018-2029
      Figure 94: Middle East & Africa Satellite Solar Panel Market Value Share (%), By Segment 3, 2022 & 2029
      Figure 95: Middle East & Africa Satellite Solar Panel Market Forecast (USD Billion), by Sub-Segment 1, 2018-2029
      Figure 96: Middle East & Africa Satellite Solar Panel Market Forecast (USD Billion), by Sub-Segment 2, 2018-2029
      Figure 97: Middle East & Africa Satellite Solar Panel Market Forecast (USD Billion), by Sub-Segment 3, 2018-2029
      Figure 98: Middle East & Africa Satellite Solar Panel Market Forecast (USD Billion), by Others, 2018-2029
      Figure 99: Middle East & Africa Satellite Solar Panel Market Forecast (USD Billion), by GCC, 2018-2029
      Figure 100: Middle East & Africa Satellite Solar Panel Market Forecast (USD Billion), by South Africa, 2018-2029
      Figure 101: Middle East & Africa Satellite Solar Panel Market Forecast (USD Billion), by Rest of Middle East & Africa, 2018-2029 
      List of Tables
      Table 1: Global Satellite Solar Panel Market Revenue (USD Billion) Forecast, by Segment 1, 2018-2029
      Table 2: Global Satellite Solar Panel Market Revenue (USD Billion) Forecast, by Segment 2, 2018-2029
      Table 3: Global Satellite Solar Panel Market Revenue (USD Billion) Forecast, by Segment 3, 2018-2029
      Table 4: Global Satellite Solar Panel Market Revenue (USD Billion) Forecast, by Region, 2018-2029
      Table 5: North America Satellite Solar Panel Market Revenue (USD Billion) Forecast, by Segment 1, 2018-2029
      Table 6: North America Satellite Solar Panel Market Revenue (USD Billion) Forecast, by Segment 2, 2018-2029
      Table 7: North America Satellite Solar Panel Market Revenue (USD Billion) Forecast, by Segment 3, 2018-2029
      Table 8: North America Satellite Solar Panel Market Revenue (USD Billion) Forecast, by Country, 2018-2029
      Table 9: Europe Satellite Solar Panel Market Revenue (USD Billion) Forecast, by Segment 1, 2018-2029
      Table 10: Europe Satellite Solar Panel Market Revenue (USD Billion) Forecast, by Segment 2, 2018-2029
      Table 11: Europe Satellite Solar Panel Market Revenue (USD Billion) Forecast, by Segment 3, 2018-2029
      Table 12: Europe Satellite Solar Panel Market Revenue (USD Billion) Forecast, by Country, 2018-2029
      Table 13: Latin America Satellite Solar Panel Market Revenue (USD Billion) Forecast, by Segment 1, 2018-2029
      Table 14: Latin America Satellite Solar Panel Market Revenue (USD Billion) Forecast, by Segment 2, 2018-2029
      Table 15: Latin America Satellite Solar Panel Market Revenue (USD Billion) Forecast, by Segment 3, 2018-2029
      Table 16: Latin America Satellite Solar Panel Market Revenue (USD Billion) Forecast, by Country, 2018-2029
      Table 17: Asia Pacific Satellite Solar Panel Market Revenue (USD Billion) Forecast, by Segment 1, 2018-2029
      Table 18: Asia Pacific Satellite Solar Panel Market Revenue (USD Billion) Forecast, by Segment 2, 2018-2029
      Table 19: Asia Pacific Satellite Solar Panel Market Revenue (USD Billion) Forecast, by Segment 3, 2018-2029
      Table 20: Asia Pacific Satellite Solar Panel Market Revenue (USD Billion) Forecast, by Country, 2018-2029
      Table 21: Middle East & Africa Satellite Solar Panel Market Revenue (USD Billion) Forecast, by Segment 1, 2018-2029
      Table 22: Middle East & Africa Satellite Solar Panel Market Revenue (USD Billion) Forecast, by Segment 2, 2018-2029
      Table 23: Middle East & Africa Satellite Solar Panel Market Revenue (USD Billion) Forecast, by Segment 3, 2018-2029
      Table 24: Middle East & Africa Satellite Solar Panel Market Revenue (USD Billion) Forecast, by Country, 2018-2029
      Research Process

      Data Library Research are conducted by industry experts who offer insight on industry structure, market segmentations technology assessment and competitive landscape (CL), and penetration, as well as on emerging trends. Their analysis is based on primary interviews (~ 80%) and secondary research (~ 20%) as well as years of professional expertise in their respective industries. Adding to this, by analysing historical trends and current market positions, our analysts predict where the market will be headed for the next five years. Furthermore, the varying trends of segment & categories geographically presented are also studied and the estimated based on the primary & secondary research.

      In this particular report from the supply side Data Library Research has conducted primary surveys (interviews) with the key level executives (VP, CEO’s, Marketing Director, Business Development Manager and SOFT) of the companies that active & prominent as well as the midsized organization

      FIGURE 1: DLR RESEARH PROCESS

      research-methodology1

      Primary Research

      Extensive primary research was conducted to gain a deeper insight of the market and industry performance. The analysis is based on both primary and secondary research as well as years of professional expertise in the respective industries.

      In addition to analysing current and historical trends, our analysts predict where the market is headed over the next five years.

      It varies by segment for these categories geographically presented in the list of market tables. Speaking about this particular report we have conducted primary surveys (interviews) with the key level executives (VP, CEO’s, Marketing Director, Business Development Manager and many more) of the major players active in the market.

      Secondary Research

      Secondary research was mainly used to collect and identify information useful for the extensive, technical, market-oriented, and Friend’s study of the Global Extra Neutral Alcohol. It was also used to obtain key information about major players, market classification and segmentation according to the industry trends, geographical markets, and developments related to the market and technology perspectives. For this study, analysts have gathered information from various credible sources, such as annual reports, sec filings, journals, white papers, SOFT presentations, and company web sites.

      Market Size Estimation

      Both, top-down and bottom-up approaches were used to estimate and validate the size of the Global market and to estimate the size of various other dependent submarkets in the overall Extra Neutral Alcohol. The key players in the market were identified through secondary research and their market contributions in the respective geographies were determined through primary and secondary research.

      Forecast Model

      research-methodology2

      Happy to Assist You

      If you have a question?

      info@datalibraryresearch.com

      IND : +91 955 279 0357

      Browse Related Reports