Smart Positionable Safety Helmet Market Overview and Analysis
The Smart Positionable Safety Helmet Market size was valued at USD 1.87 billion in 2025 and is poised to grow from USD 3.04 billion in 2032, growing with a CAGR of 11.23% from 2025-2032.
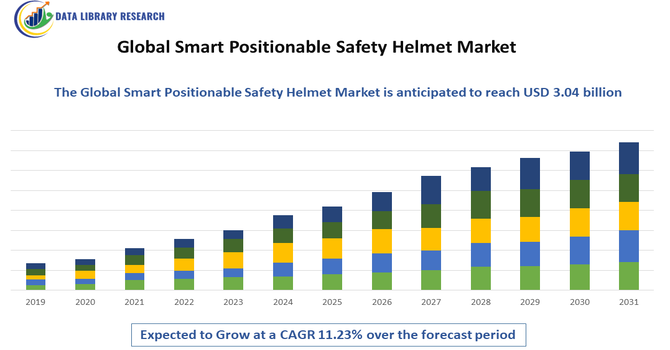
The Smart Positionable Safety Helmet Market refers to the global industry focused on helmets equipped with advanced features like sensors, positioning systems, connectivity, and impact detection. These helmets enhance worker safety in construction, mining, and industrial environments by monitoring location, detecting hazards, and providing real-time alerts to prevent accidents.
Growth of the Global Smart Positionable Safety Helmet Market is driven by increasing workplace safety regulations, rising adoption of wearable safety technologies, and growing awareness of occupational hazards in construction, mining, and industrial sectors. Technological advancements, such as IoT-enabled sensors, real-time monitoring, and GPS positioning, are enhancing worker protection and operational efficiency.
Smart Positionable Safety Helmet Market Latest Trends
The global smart positionable safety helmet market is witnessing rapid growth, driven by increasing awareness of workplace safety and the rising adoption of wearable technology. Modern helmets now integrate features such as IoT connectivity, heads-up displays, environmental sensors, real-time hazard detection, and communication systems, transforming traditional safety equipment into multifunctional tools. Industries such as construction, manufacturing, transportation, and mining are rapidly adopting these helmets to enhance operational safety.
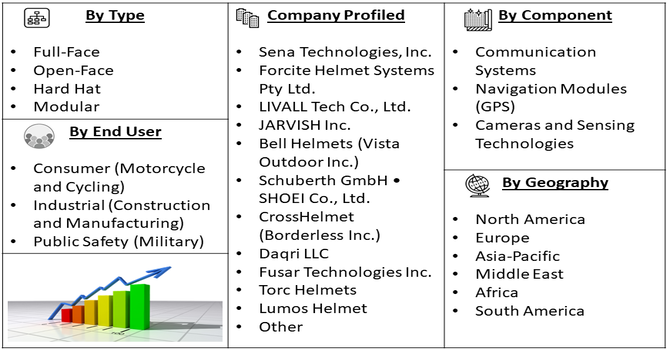
Segmentation: The Global Smart Positionable Safety Helmet Market is segmented primarily based on Product Type (Full-Face, Open-Face, Hard Hat, and Modular), Component (Communication Systems, Navigation Modules (GPS), Cameras, and Sensing Technologies), End User (Consumer (Motorcycle and Cycling), Industrial (Construction and Manufacturing), and Public Safety (Military)), and Geography (North America, Europe, Asia-Pacific, Middle East and Africa, and South America). The report provides the value (in USD million) for the above segments.
Market Drivers:
- Rising Workplace Safety Awareness
The global smart positionable safety helmet market is being strongly driven by increasing awareness of occupational safety across industries such as construction, mining, manufacturing, and energy. Governments and regulatory bodies are enforcing stricter safety standards, encouraging organizations to adopt advanced protective equipment. For instance, Department of Electrical Engineering, Malaysia in June 2025, reported that, the IoT-enabled smart safety helmet monitors environmental hazards in real time, triggering alerts to enhance worker protection. Its adoption boosts rising workplace safety awareness and drives growth in the global smart, positionable safety helmet market.
mart helmets, equipped with features like real-time hazard detection, environmental sensors, and communication systems, help mitigate risks and prevent workplace accidents. Companies are increasingly investing in these high-tech helmets to safeguard employees, reduce insurance claims, and comply with international safety regulations. Rising incidents of occupational injuries in emerging economies further accelerate demand, as employers prioritize technology-driven safety solutions to protect workers and enhance operational efficiency.
- Technological Advancements and Integration
Technological innovation is a significant driver propelling the growth of the smart helmet market. Integration of IoT, augmented reality (AR), artificial intelligence (AI), GPS navigation, and wireless communication systems has transformed traditional helmets into multifunctional devices. For instance, in November 2025, Nolan Helmets partnered with Minnesota-based Quin to launch the X-904 UC intelligent helmet, featuring the Quin Pod device that detected crashes and severe impacts. The Pod automatically alerted emergency contacts and, in select markets, emergency services, enhancing rider safety through real-time incident response technology. @@@@ Continuous R&D investments by leading manufacturers have also improved ergonomics, battery life, and data analytics capabilities. These innovations not only increase adoption across industrial and consumer segments but also position smart helmets as essential wearable safety technology for the future.
Market Restraints
- High Cost and Affordability Issues
The primary restraints limiting market growth is the high cost of smart positionable helmets compared to conventional safety helmets. Advanced features such as IoT connectivity, AR displays, environmental sensors, and impact monitoring significantly increase manufacturing expenses. This high price point poses affordability challenges for small and medium-sized enterprises, particularly in developing economies. Budget-conscious organizations may hesitate to replace traditional helmets with expensive smart alternatives, slowing adoption rates. Additionally, maintenance and software updates add recurring costs, further discouraging widespread deployment.
Socio Economic Impact on Smart Positionable Safety Helmet Market
The adoption of smart safety helmets has significant socioeconomic implications. By reducing workplace accidents, injuries, and fatalities, these helmets help lower healthcare costs and minimize economic losses associated with labor disruptions. Safer work environments improve employee morale, productivity, and efficiency, fostering a culture of occupational well-being. In emerging economies, where industrialization and infrastructure development are accelerating, smart helmets can play a crucial role in supporting safer construction and manufacturing practices.
Segmental Analysis
- Hard Hat segment is expected to witness highest growth over the forecast period
The “hard hat” segment of the smart helmet market is expected to witness the highest growth over the coming years. As construction, mining, manufacturing and infrastructure industries expand globally, demand for smart hard hats—equipped with IoT sensors, hazard detection, environmental monitoring and connectivity—has surged. Smart hard hats allow real-time tracking of worker location, detection of gas leaks or unsafe ambient conditions, and remote monitoring of worker health and safety. Increasing regulatory pressure on workplace safety and employers’ focus on reducing accidents and liability drive adoption of such helmets. As a result, companies in heavy industry sectors are increasingly shifting from conventional hard hats to smart variants, fueling robust segment growth.
- Navigation Modules (GPS) segment is expected to witness highest growth over the forecast period
The navigation (GPS and positioning ) module segment of the smart helmet market is poised for the fastest growth during the forecast period. As smart helmets evolve beyond protective gear into fully connected devices, the inclusion of GPS/navigation, tracking, and route guidance features becomes increasingly valuable — both for motorcyclists, outdoor workers, and logistics or delivery personnel. This demand is amplified by rising two wheeler and e bike usage globally, and by industrial applications where location tracking and route mapping in complex worksites help improve safety and efficiency. Consequently, navigation enabled helmets—offering positioning, heads up directions, and location awareness—are gaining traction, marking this segment as one of the most dynamic growth areas in the market.
- Public Safety (Military) segment is expected to witness highest growth over the forecast period
The public safety / military / defense oriented segment of smart helmets is expected to see substantial growth as militaries and law enforcement agencies increasingly seek advanced headgear with integrated communication, situational awareness, sensory data, and protection features.
Smart helmets in this domain can combine ballistic or impact protection with GPS navigation, real time communication, environmental sensors, and potentially augmented reality displays to assist in operations. As global security concerns rise and defense budgets expand, demand for technologically advanced protective helmets grows accordingly. This shift toward digital, connected protective gear in public safety and defense sectors is positioning the military segment as one of the fastest growing applications for smart helmets worldwide.
- North America Region segment is expected to witness highest growth over the forecast period
North America is expected to maintain the highest market share in the global smart helmet market over the forecast period. The region benefits from stringent occupational and road safety regulations, high awareness of safety standards, strong adoption of wearable and IoT technologies, and substantial investments in infrastructure, construction, manufacturing, and defense. For instance, in August 2025, Insta360’s strategic partnership with Helmet House expanded its U.S. presence by offering advanced 360-degree cameras, mounts, and AI-powered editing tools through a nationwide dealer network. This collaboration boosted the North American smart helmet market by integrating immersive camera technology into powersports helmets, enhancing user experience and safety. It accelerated adoption of smart helmets with advanced imaging features, strengthening the region’s position as a key growth driver in the global smart positionable safety helmet market.
High disposable incomes, corporate safety compliance norms, and presence of major safety gear manufacturers and tech driven helmet providers further support rapid uptake. As a result, North America remains the leading region for smart helmet adoption globally, combining regulatory push, technological readiness, and broad end use demand across industrial, consumer, and public safety segments.
Smart Positionable Safety Helmet Market Competitive Landscape:
The competitive landscape of the smart helmet market is diverse, featuring established safety equipment manufacturers alongside technology-driven startups. Companies compete primarily through innovation, integrating features such as augmented reality, AI-assisted hazard detection, and IoT connectivity. Strategic partnerships, product diversification, and expansion into industrial, construction, and consumer segments are key tactics. Market leaders are focusing on enhancing design, durability, and user experience to differentiate themselves.
The major players for above market:
- Sena Technologies, Inc.
- Forcite Helmet Systems Pty Ltd.
- LIVALL Tech Co., Ltd.
- JARVISH Inc.
- Bell Helmets (Vista Outdoor Inc.)
- Schuberth GmbH • SHOEI Co., Ltd.
- CrossHelmet (Borderless Inc.)
- Daqri LLC
- Fusar Technologies Inc.
- Torc Helmets
- Lumos Helmet
- Steelbird Hi Tech India Ltd.
- Reevu Worldwide Ltd.
- 360fly Inc.
- Safe Tec
- Vega Helmets
- 3M Company
- Honeywell International Inc.
- RealWear, Inc.
Recent Development
- In January 2025, Exeger, the Swedish deep-tech firm behind the innovative Powerfoyle solar technology, partnered with consumer electronics manufacturer Cosonic to unveil a solar-powered, self-charging smart helmet aimed at China’s urban motorcyclists and millions of delivery riders, marking a significant step in wearable solar-powered safety solutions.
- In January 2025, Proxgy, after its Series A funding, launched the Hat+ Band and ProHat Band, transforming standard industrial helmets into advanced AC and smart helmets, enhancing worker comfort, connectivity, and safety in harsh industrial environments globally. This innovation strengthened the industrial segment of the smart helmet market by accelerating adoption of wearable safety technology, highlighting demand for connected, comfort-focused helmets.
Frequently Asked Questions (FAQ) :
Q1. What are the main growth-driving factors for this market?
The market is primarily propelled by increasingly stringent government safety regulations and occupational health standards across major industries like construction and manufacturing. Additionally, technological advancements, such as integrating IoT, AI, and connectivity features (GPS, real-time communication) into helmets, significantly enhance worker safety and productivity. Growing awareness of workplace hazards also pushes demand for these sophisticated protective devices.
Q2. What are the main restraining factors for this market?
The major constraint is the high initial cost of smart helmets compared to conventional safety gear, making mass adoption difficult, especially in price-sensitive emerging economies. Other factors include the limited battery life of integrated electronic components and potential resistance from workers due to discomfort or concerns over continuous surveillance and data privacy associated with connected devices.
Q3. Which segment is expected to witness high growth?
By end-use, the Construction and Manufacturing segment is anticipated to witness substantial growth, driven by rapid industrialization and large-scale infrastructure projects worldwide. Furthermore, the segment focused on Integrated Communication Systems (within the helmet components) is expanding quickly, as clear, hands-free worker-to-supervisor communication is critical for safety and efficiency on high-risk sites.
Q4. Who are the top major players for this market?
The market features a blend of established industrial safety leaders and specialized technology firms. Key players include 3M, Honeywell International Inc., Sena Technologies, Inc., and Livall. These companies compete by focusing heavily on R&D to enhance features like impact detection, real-time vital monitoring, and seamless integration with existing industrial safety platforms.
Q5. Which country is the largest player?
North America currently dominates the global market in terms of revenue share, primarily driven by the United States. This dominance is due to well-established, strict occupational safety laws and high technology adoption rates across industries. However, the Asia-Pacific region, fueled by the massive manufacturing and construction sectors in countries like China and India, is projected to be the fastest-growing regional market.
List of Figures
Figure 1: Global Smart Positionable Safety Helmet Market Revenue Breakdown (USD Billion, %) by Region, 2022 & 2029
Figure 2: Global Smart Positionable Safety Helmet Market Value Share (%), By Segment 1, 2022 & 2029
Figure 3: Global Smart Positionable Safety Helmet Market Forecast (USD Billion), by Sub-Segment 1, 2018-2029
Figure 4: Global Smart Positionable Safety Helmet Market Forecast (USD Billion), by Sub-Segment 2, 2018-2029
Figure 5: Global Smart Positionable Safety Helmet Market Value Share (%), By Segment 2, 2022 & 2029
Figure 6: Global Smart Positionable Safety Helmet Market Forecast (USD Billion), by Sub-Segment 1, 2018-2029
Figure 7: Global Smart Positionable Safety Helmet Market Forecast (USD Billion), by Sub-Segment 2, 2018-2029
Figure 8: Global Smart Positionable Safety Helmet Market Forecast (USD Billion), by Sub-Segment 3, 2018-2029
Figure 9: Global Smart Positionable Safety Helmet Market Forecast (USD Billion), by Others, 2018-2029
Figure 10: Global Smart Positionable Safety Helmet Market Value Share (%), By Segment 3, 2022 & 2029
Figure 11: Global Smart Positionable Safety Helmet Market Forecast (USD Billion), by Sub-Segment 1, 2018-2029
Figure 12: Global Smart Positionable Safety Helmet Market Forecast (USD Billion), by Sub-Segment 2, 2018-2029
Figure 13: Global Smart Positionable Safety Helmet Market Forecast (USD Billion), by Sub-Segment 3, 2018-2029
Figure 14: Global Smart Positionable Safety Helmet Market Forecast (USD Billion), by Others, 2018-2029
Figure 15: Global Smart Positionable Safety Helmet Market Value (USD Billion), by Region, 2022 & 2029
Figure 16: North America Smart Positionable Safety Helmet Market Value Share (%), By Segment 1, 2022 & 2029
Figure 17: North America Smart Positionable Safety Helmet Market Forecast (USD Billion), by Sub-Segment 1, 2018-2029
Figure 18: North America Smart Positionable Safety Helmet Market Forecast (USD Billion), by Sub-Segment 2, 2018-2029
Figure 19: North America Smart Positionable Safety Helmet Market Value Share (%), By Segment 2, 2022 & 2029
Figure 20: North America Smart Positionable Safety Helmet Market Forecast (USD Billion), by Sub-Segment 1, 2018-2029
Figure 21: North America Smart Positionable Safety Helmet Market Forecast (USD Billion), by Sub-Segment 2, 2018-2029
Figure 22: North America Smart Positionable Safety Helmet Market Forecast (USD Billion), by Sub-Segment 3, 2018-2029
Figure 23: North America Smart Positionable Safety Helmet Market Forecast (USD Billion), by Others, 2018-2029
Figure 24: North America Smart Positionable Safety Helmet Market Value Share (%), By Segment 3, 2022 & 2029
Figure 25: North America Smart Positionable Safety Helmet Market Forecast (USD Billion), by Sub-Segment 1, 2018-2029
Figure 26: North America Smart Positionable Safety Helmet Market Forecast (USD Billion), by Sub-Segment 2, 2018-2029
Figure 27: North America Smart Positionable Safety Helmet Market Forecast (USD Billion), by Sub-Segment 3, 2018-2029
Figure 28: North America Smart Positionable Safety Helmet Market Forecast (USD Billion), by Others, 2018-2029
Figure 29: North America Smart Positionable Safety Helmet Market Forecast (USD Billion), by U.S., 2018-2029
Figure 30: North America Smart Positionable Safety Helmet Market Forecast (USD Billion), by Canada, 2018-2029
Figure 31: Latin America Smart Positionable Safety Helmet Market Value Share (%), By Segment 1, 2022 & 2029
Figure 32: Latin America Smart Positionable Safety Helmet Market Forecast (USD Billion), by Sub-Segment 1, 2018-2029
Figure 33: Latin America Smart Positionable Safety Helmet Market Forecast (USD Billion), by Sub-Segment 2, 2018-2029
Figure 34: Latin America Smart Positionable Safety Helmet Market Value Share (%), By Segment 2, 2022 & 2029
Figure 35: Latin America Smart Positionable Safety Helmet Market Forecast (USD Billion), by Sub-Segment 1, 2018-2029
Figure 36: Latin America Smart Positionable Safety Helmet Market Forecast (USD Billion), by Sub-Segment 2, 2018-2029
Figure 37: Latin America Smart Positionable Safety Helmet Market Forecast (USD Billion), by Sub-Segment 3, 2018-2029
Figure 38: Latin America Smart Positionable Safety Helmet Market Forecast (USD Billion), by Others, 2018-2029
Figure 39: Latin America Smart Positionable Safety Helmet Market Value Share (%), By Segment 3, 2022 & 2029
Figure 40: Latin America Smart Positionable Safety Helmet Market Forecast (USD Billion), by Sub-Segment 1, 2018-2029
Figure 41: Latin America Smart Positionable Safety Helmet Market Forecast (USD Billion), by Sub-Segment 2, 2018-2029
Figure 42: Latin America Smart Positionable Safety Helmet Market Forecast (USD Billion), by Sub-Segment 3, 2018-2029
Figure 43: Latin America Smart Positionable Safety Helmet Market Forecast (USD Billion), by Others, 2018-2029
Figure 44: Latin America Smart Positionable Safety Helmet Market Forecast (USD Billion), by Brazil, 2018-2029
Figure 45: Latin America Smart Positionable Safety Helmet Market Forecast (USD Billion), by Mexico, 2018-2029
Figure 46: Latin America Smart Positionable Safety Helmet Market Forecast (USD Billion), by Rest of Latin America, 2018-2029
Figure 47: Europe Smart Positionable Safety Helmet Market Value Share (%), By Segment 1, 2022 & 2029
Figure 48: Europe Smart Positionable Safety Helmet Market Forecast (USD Billion), by Sub-Segment 1, 2018-2029
Figure 49: Europe Smart Positionable Safety Helmet Market Forecast (USD Billion), by Sub-Segment 2, 2018-2029
Figure 50: Europe Smart Positionable Safety Helmet Market Value Share (%), By Segment 2, 2022 & 2029
Figure 51: Europe Smart Positionable Safety Helmet Market Forecast (USD Billion), by Sub-Segment 1, 2018-2029
Figure 52: Europe Smart Positionable Safety Helmet Market Forecast (USD Billion), by Sub-Segment 2, 2018-2029
Figure 53: Europe Smart Positionable Safety Helmet Market Forecast (USD Billion), by Sub-Segment 3, 2018-2029
Figure 54: Europe Smart Positionable Safety Helmet Market Forecast (USD Billion), by Others, 2018-2029
Figure 55: Europe Smart Positionable Safety Helmet Market Value Share (%), By Segment 3, 2022 & 2029
Figure 56: Europe Smart Positionable Safety Helmet Market Forecast (USD Billion), by Sub-Segment 1, 2018-2029
Figure 57: Europe Smart Positionable Safety Helmet Market Forecast (USD Billion), by Sub-Segment 2, 2018-2029
Figure 58: Europe Smart Positionable Safety Helmet Market Forecast (USD Billion), by Sub-Segment 3, 2018-2029
Figure 59: Europe Smart Positionable Safety Helmet Market Forecast (USD Billion), by Others, 2018-2029
Figure 60: Europe Smart Positionable Safety Helmet Market Forecast (USD Billion), by U.K., 2018-2029
Figure 61: Europe Smart Positionable Safety Helmet Market Forecast (USD Billion), by Germany, 2018-2029
Figure 62: Europe Smart Positionable Safety Helmet Market Forecast (USD Billion), by France, 2018-2029
Figure 63: Europe Smart Positionable Safety Helmet Market Forecast (USD Billion), by Italy, 2018-2029
Figure 64: Europe Smart Positionable Safety Helmet Market Forecast (USD Billion), by Spain, 2018-2029
Figure 65: Europe Smart Positionable Safety Helmet Market Forecast (USD Billion), by Russia, 2018-2029
Figure 66: Europe Smart Positionable Safety Helmet Market Forecast (USD Billion), by Rest of Europe, 2018-2029
Figure 67: Asia Pacific Smart Positionable Safety Helmet Market Value Share (%), By Segment 1, 2022 & 2029
Figure 68: Asia Pacific Smart Positionable Safety Helmet Market Forecast (USD Billion), by Sub-Segment 1, 2018-2029
Figure 69: Asia Pacific Smart Positionable Safety Helmet Market Forecast (USD Billion), by Sub-Segment 2, 2018-2029
Figure 70: Asia Pacific Smart Positionable Safety Helmet Market Value Share (%), By Segment 2, 2022 & 2029
Figure 71: Asia Pacific Smart Positionable Safety Helmet Market Forecast (USD Billion), by Sub-Segment 1, 2018-2029
Figure 72: Asia Pacific Smart Positionable Safety Helmet Market Forecast (USD Billion), by Sub-Segment 2, 2018-2029
Figure 73: Asia Pacific Smart Positionable Safety Helmet Market Forecast (USD Billion), by Sub-Segment 3, 2018-2029
Figure 74: Asia Pacific Smart Positionable Safety Helmet Market Forecast (USD Billion), by Others, 2018-2029
Figure 75: Asia Pacific Smart Positionable Safety Helmet Market Value Share (%), By Segment 3, 2022 & 2029
Figure 76: Asia Pacific Smart Positionable Safety Helmet Market Forecast (USD Billion), by Sub-Segment 1, 2018-2029
Figure 77: Asia Pacific Smart Positionable Safety Helmet Market Forecast (USD Billion), by Sub-Segment 2, 2018-2029
Figure 78: Asia Pacific Smart Positionable Safety Helmet Market Forecast (USD Billion), by Sub-Segment 3, 2018-2029
Figure 79: Asia Pacific Smart Positionable Safety Helmet Market Forecast (USD Billion), by Others, 2018-2029
Figure 80: Asia Pacific Smart Positionable Safety Helmet Market Forecast (USD Billion), by China, 2018-2029
Figure 81: Asia Pacific Smart Positionable Safety Helmet Market Forecast (USD Billion), by India, 2018-2029
Figure 82: Asia Pacific Smart Positionable Safety Helmet Market Forecast (USD Billion), by Japan, 2018-2029
Figure 83: Asia Pacific Smart Positionable Safety Helmet Market Forecast (USD Billion), by Australia, 2018-2029
Figure 84: Asia Pacific Smart Positionable Safety Helmet Market Forecast (USD Billion), by Southeast Asia, 2018-2029
Figure 85: Asia Pacific Smart Positionable Safety Helmet Market Forecast (USD Billion), by Rest of Asia Pacific, 2018-2029
Figure 86: Middle East & Africa Smart Positionable Safety Helmet Market Value Share (%), By Segment 1, 2022 & 2029
Figure 87: Middle East & Africa Smart Positionable Safety Helmet Market Forecast (USD Billion), by Sub-Segment 1, 2018-2029
Figure 88: Middle East & Africa Smart Positionable Safety Helmet Market Forecast (USD Billion), by Sub-Segment 2, 2018-2029
Figure 89: Middle East & Africa Smart Positionable Safety Helmet Market Value Share (%), By Segment 2, 2022 & 2029
Figure 90: Middle East & Africa Smart Positionable Safety Helmet Market Forecast (USD Billion), by Sub-Segment 1, 2018-2029
Figure 91: Middle East & Africa Smart Positionable Safety Helmet Market Forecast (USD Billion), by Sub-Segment 2, 2018-2029
Figure 92: Middle East & Africa Smart Positionable Safety Helmet Market Forecast (USD Billion), by Sub-Segment 3, 2018-2029
Figure 93: Middle East & Africa Smart Positionable Safety Helmet Market Forecast (USD Billion), by Others, 2018-2029
Figure 94: Middle East & Africa Smart Positionable Safety Helmet Market Value Share (%), By Segment 3, 2022 & 2029
Figure 95: Middle East & Africa Smart Positionable Safety Helmet Market Forecast (USD Billion), by Sub-Segment 1, 2018-2029
Figure 96: Middle East & Africa Smart Positionable Safety Helmet Market Forecast (USD Billion), by Sub-Segment 2, 2018-2029
Figure 97: Middle East & Africa Smart Positionable Safety Helmet Market Forecast (USD Billion), by Sub-Segment 3, 2018-2029
Figure 98: Middle East & Africa Smart Positionable Safety Helmet Market Forecast (USD Billion), by Others, 2018-2029
Figure 99: Middle East & Africa Smart Positionable Safety Helmet Market Forecast (USD Billion), by GCC, 2018-2029
Figure 100: Middle East & Africa Smart Positionable Safety Helmet Market Forecast (USD Billion), by South Africa, 2018-2029
Figure 101: Middle East & Africa Smart Positionable Safety Helmet Market Forecast (USD Billion), by Rest of Middle East & Africa, 2018-2029
List of Tables
Table 1: Global Smart Positionable Safety Helmet Market Revenue (USD Billion) Forecast, by Segment 1, 2018-2029
Table 2: Global Smart Positionable Safety Helmet Market Revenue (USD Billion) Forecast, by Segment 2, 2018-2029
Table 3: Global Smart Positionable Safety Helmet Market Revenue (USD Billion) Forecast, by Segment 3, 2018-2029
Table 4: Global Smart Positionable Safety Helmet Market Revenue (USD Billion) Forecast, by Region, 2018-2029
Table 5: North America Smart Positionable Safety Helmet Market Revenue (USD Billion) Forecast, by Segment 1, 2018-2029
Table 6: North America Smart Positionable Safety Helmet Market Revenue (USD Billion) Forecast, by Segment 2, 2018-2029
Table 7: North America Smart Positionable Safety Helmet Market Revenue (USD Billion) Forecast, by Segment 3, 2018-2029
Table 8: North America Smart Positionable Safety Helmet Market Revenue (USD Billion) Forecast, by Country, 2018-2029
Table 9: Europe Smart Positionable Safety Helmet Market Revenue (USD Billion) Forecast, by Segment 1, 2018-2029
Table 10: Europe Smart Positionable Safety Helmet Market Revenue (USD Billion) Forecast, by Segment 2, 2018-2029
Table 11: Europe Smart Positionable Safety Helmet Market Revenue (USD Billion) Forecast, by Segment 3, 2018-2029
Table 12: Europe Smart Positionable Safety Helmet Market Revenue (USD Billion) Forecast, by Country, 2018-2029
Table 13: Latin America Smart Positionable Safety Helmet Market Revenue (USD Billion) Forecast, by Segment 1, 2018-2029
Table 14: Latin America Smart Positionable Safety Helmet Market Revenue (USD Billion) Forecast, by Segment 2, 2018-2029
Table 15: Latin America Smart Positionable Safety Helmet Market Revenue (USD Billion) Forecast, by Segment 3, 2018-2029
Table 16: Latin America Smart Positionable Safety Helmet Market Revenue (USD Billion) Forecast, by Country, 2018-2029
Table 17: Asia Pacific Smart Positionable Safety Helmet Market Revenue (USD Billion) Forecast, by Segment 1, 2018-2029
Table 18: Asia Pacific Smart Positionable Safety Helmet Market Revenue (USD Billion) Forecast, by Segment 2, 2018-2029
Table 19: Asia Pacific Smart Positionable Safety Helmet Market Revenue (USD Billion) Forecast, by Segment 3, 2018-2029
Table 20: Asia Pacific Smart Positionable Safety Helmet Market Revenue (USD Billion) Forecast, by Country, 2018-2029
Table 21: Middle East & Africa Smart Positionable Safety Helmet Market Revenue (USD Billion) Forecast, by Segment 1, 2018-2029
Table 22: Middle East & Africa Smart Positionable Safety Helmet Market Revenue (USD Billion) Forecast, by Segment 2, 2018-2029
Table 23: Middle East & Africa Smart Positionable Safety Helmet Market Revenue (USD Billion) Forecast, by Segment 3, 2018-2029
Table 24: Middle East & Africa Smart Positionable Safety Helmet Market Revenue (USD Billion) Forecast, by Country, 2018-2029
Research Process
Data Library Research are conducted by industry experts who offer insight on
industry structure, market segmentations technology assessment and competitive landscape (CL), and penetration, as well as on emerging trends. Their analysis is based on primary interviews (~ 80%) and secondary research (~ 20%) as well as years of professional expertise in their respective industries. Adding to this, by analysing historical trends and current market positions, our analysts predict where the market will be headed for the next five years. Furthermore, the varying trends of segment & categories geographically presented are also studied and the estimated based on the primary & secondary research.
In this particular report from the supply side Data Library Research has conducted primary surveys (interviews) with the key level executives (VP, CEO’s, Marketing Director, Business Development Manager
and SOFT) of the companies that active & prominent as well as the midsized organization
FIGURE 1: DLR RESEARH PROCESS
Primary Research
Extensive primary research was conducted to gain a deeper insight of the market and industry performance. The analysis is based on both primary and secondary research as well as years of professional expertise in the respective industries.
In addition to analysing current and historical trends, our analysts predict where the market is headed over the next five years.
It varies by segment for these categories geographically presented in the list of market tables. Speaking about this particular report we have conducted primary surveys (interviews) with the key level executives (VP, CEO’s, Marketing Director, Business Development Manager and many more) of the major players active in the market.
Secondary Research
Secondary research was mainly used to collect and identify information useful for the extensive, technical, market-oriented, and Friend’s study of the Global Extra Neutral Alcohol. It was also used to obtain key information about major players, market classification and segmentation according to the industry trends, geographical markets, and developments related to the market and technology perspectives. For this study, analysts have gathered information from various credible sources, such as annual reports, sec filings, journals, white papers, SOFT presentations, and company web sites.
Market Size Estimation
Both, top-down and bottom-up approaches were used to estimate and validate the size of the Global market and to estimate the size of various other dependent submarkets in the overall Extra Neutral Alcohol. The key players in the market were identified through secondary research and their market contributions in the respective geographies were determined through primary and secondary research.
Forecast Model