Military Smart Textiles Market Overview
The global Military Smart Textiles market is projected to grow at a significant rate in the coming years. Smart textiles are textile structures or fabrics that can detect and respond to a variety of environmental stimuli, including mechanical, thermal, chemical, biological, and magnetic stimuli. Army officials use smart textiles extensively throughout the world. Textiles combining nanotechnology and electronics play an important part in the development of technologically superior military outfits and materials. Active and intelligent fabrics, when combined with electronics, have the potential to increase a soldier's performance by sensing and adapting to a preset state, as well as responding to a situational necessity. Armed forces will be able to accomplish more with fewer gadgets and loads thanks to smart technologies. Uniforms with smart fabrics have a single, central power source. This allows soldiers to carry only one battery instead of multiple batteries, reducing the number of wires needed in their equipment. All aforementioned factors are majorly contributing towards the growth of the global Military Smart Textiles market.
| Report Metric |
Details |
| Market size available for years |
2023–2030 |
| Base year considered |
2023 |
| Forecast period |
2024–2030 |
| Forecast unit |
Value (USD Million) |
| Segments covered |
Type, Application, and Region. |
| Regions covered |
North America (the U.S. and Canada), Europe (UK, Germany, France, Italy, Spain, Russia, Rest of Europe), Asia-Pacific (China, India, Japan, Australia, South East Asia, Rest of Asia Pacific), Latin America and the Middle East and Africa (Brazil, Saudi Arabia, UAE, Rest of LAMEA) |
| Companies covered |
Advanced Fabric Technology LLC, BAE Systems plc, BeBop Sensors, TenCate Fabrics - EU., Mide Technology Corporation, Outlast Technologies LLC, WL Gore & Associates Inc. |
Covid-19 Impact on Military Smart Textiles Market
The ongoing COVID-19 pandemic conditions have severely affected every sector around the world. Whereas, the chemicals and materials sectors were moderately affected during the pandemic. This is primarily due to the uncut demand for chemicals for healthcare, life science, and cleaning agents. However, other elements of chemical and material sectors such as paints, industrial oil, construction materials are facing diminution in demand. Strict lockdown resulted in a nearly 50-60% reduction in supply for raw materials, which directly affected the manufacturing process. Further, halt on many end-use industries directly affected the chemical demand all around the world.
Military Smart Textiles Market Segment Overview
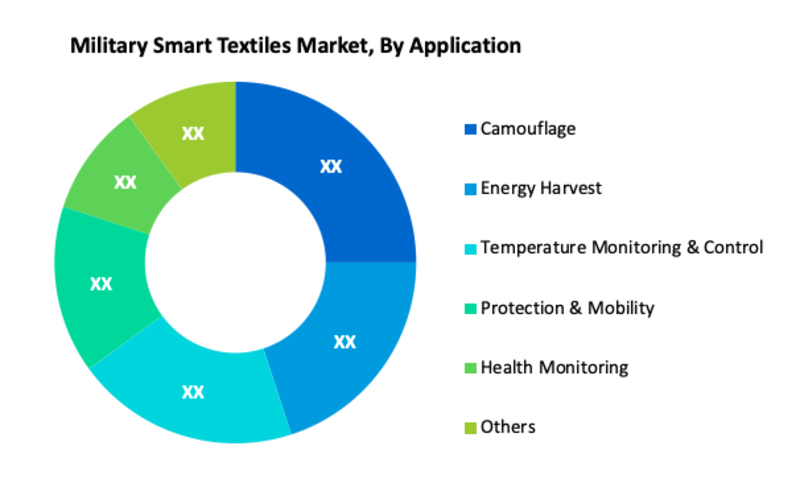
In terms of application, the global military smart textiles market is divided into camouflage, energy harvest, temperature monitoring & control, protection & mobility, health monitoring, and others. The camouflage segment is expected to hold a major share of the global military smart textiles market. Increasing at a healthy growth rate, energy harvest, temperature monitoring & control, and health monitoring segments are anticipated to create noteworthy incremental opportunities in the forecast period.
Military Smart Textiles Market, By Type
· Passive Smart Textiles
· Active Smart Textiles
· Ultra-smart Textiles
Military Smart Textiles Market, By Application
· Camouflage
· Energy Harvest
· Temperature Monitoring & Control
· Protection & Mobility
· Health Monitoring
· Others
Military Smart Textiles Market Regional Overview
Geographically, Asia Pacific is one of the most prominent regions for the global military smart textiles market. Government regulations in China and India that encourage investment in their respective textile manufacturing sectors are projected to increase the Asia Pacific market. In addition to this, in the near future, the expansion of the textile industry in the Asia Pacific, particularly in China and India, is expected to boost the military smart textiles market in the region. Moreover, North America is another major region for the market. Canada's textile industry is well-established. The military smart textiles market in North America is expected to grow as the country's textile industry expands. The military smart textiles market in Europe is expected to grow as the textile industry in Europe expands.
Military Smart Textiles Market, By Geography
· North America (US & Canada)
· Europe (UK, Germany, France, Italy, Spain, Russia & Rest of Europe)
· Asia-Pacific (Japan, China, India, Australia, & South Korea, & Rest of Asia-Pacific)
· LAMEA (Brazil, Saudi Arabia, UAE & Rest of LAMEA)
Military Smart Textiles Market, Key Players
· Advanced Fabric Technology LLC
· BAE Systems plc
· BeBop Sensors
· TenCate Fabrics - EU.
· Mide Technology Corporation
· Outlast Technologies LLC
· WL Gore & Associates Inc
Frequently Asked Questions (FAQ) :
Q1. Which Segments are covered in the Military Smart Textiles Market report?
Type, Application, and Region. these segments are covered in the Military Smart Textiles market report.
Q2. Which are the parts of the Type segment in the Military Smart Textiles market?
Passive Smart Textiles, Active Smart Textiles, Ultra-smart Textiles are parts of the Type segment in the Military Smart Textiles market.
Q3. Which segment is projected to hold the largest share in the Military Smart Textiles Market.?
The camouflage segment is projected to hold the largest share in the Military Smart Textiles Market.
Q4. Which region holds the largest share in the Military Smart Textiles market?
the Asia Pacific held the largest share in the global Military Smart Textiles market.
Q5. Which are the prominent players in the Military Smart Textiles Market?
Advanced Fabric Technology LLC, BAE Systems plc, BeBop Sensors, TenCate Fabrics - EU., Mide Technology Corporation, Outlast Technologies LLC, WL Gore & Associates Inc. are some key players in the Military Smart Textiles Market.
List of Figures
Figure 1: Global Smart Textiles for the Military Market Revenue Breakdown (USD Billion, %) by Region, 2019 & 2027
Figure 2: Global Smart Textiles for the Military Market Value Share (%), By Segment 1, 2019 & 2027
Figure 3: Global Smart Textiles for the Military Market Forecast (USD Billion), by Sub-Segment 1, 2016-2027
Figure 4: Global Smart Textiles for the Military Market Forecast (USD Billion), by Sub-Segment 2, 2016-2027
Figure 5: Global Smart Textiles for the Military Market Value Share (%), By Segment 2, 2019 & 2027
Figure 6: Global Smart Textiles for the Military Market Forecast (USD Billion), by Sub-Segment 1, 2016-2027
Figure 7: Global Smart Textiles for the Military Market Forecast (USD Billion), by Sub-Segment 2, 2016-2027
Figure 8: Global Smart Textiles for the Military Market Forecast (USD Billion), by Sub-Segment 3, 2016-2027
Figure 9: Global Smart Textiles for the Military Market Forecast (USD Billion), by Others, 2016-2027
Figure 10: Global Smart Textiles for the Military Market Value Share (%), By Segment 3, 2019 & 2027
Figure 11: Global Smart Textiles for the Military Market Forecast (USD Billion), by Sub-Segment 1, 2016-2027
Figure 12: Global Smart Textiles for the Military Market Forecast (USD Billion), by Sub-Segment 2, 2016-2027
Figure 13: Global Smart Textiles for the Military Market Forecast (USD Billion), by Sub-Segment 3, 2016-2027
Figure 14: Global Smart Textiles for the Military Market Forecast (USD Billion), by Others, 2016-2027
Figure 15: Global Smart Textiles for the Military Market Value (USD Billion), by Region, 2019 & 2027
Figure 16: North America Smart Textiles for the Military Market Value Share (%), By Segment 1, 2019 & 2027
Figure 17: North America Smart Textiles for the Military Market Forecast (USD Billion), by Sub-Segment 1, 2016-2027
Figure 18: North America Smart Textiles for the Military Market Forecast (USD Billion), by Sub-Segment 2, 2016-2027
Figure 19: North America Smart Textiles for the Military Market Value Share (%), By Segment 2, 2019 & 2027
Figure 20: North America Smart Textiles for the Military Market Forecast (USD Billion), by Sub-Segment 1, 2016-2027
Figure 21: North America Smart Textiles for the Military Market Forecast (USD Billion), by Sub-Segment 2, 2016-2027
Figure 22: North America Smart Textiles for the Military Market Forecast (USD Billion), by Sub-Segment 3, 2016-2027
Figure 23: North America Smart Textiles for the Military Market Forecast (USD Billion), by Others, 2016-2027
Figure 24: North America Smart Textiles for the Military Market Value Share (%), By Segment 3, 2019 & 2027
Figure 25: North America Smart Textiles for the Military Market Forecast (USD Billion), by Sub-Segment 1, 2016-2027
Figure 26: North America Smart Textiles for the Military Market Forecast (USD Billion), by Sub-Segment 2, 2016-2027
Figure 27: North America Smart Textiles for the Military Market Forecast (USD Billion), by Sub-Segment 3, 2016-2027
Figure 28: North America Smart Textiles for the Military Market Forecast (USD Billion), by Others, 2016-2027
Figure 29: North America Smart Textiles for the Military Market Forecast (USD Billion), by U.S., 2016-2027
Figure 30: North America Smart Textiles for the Military Market Forecast (USD Billion), by Canada, 2016-2027
Figure 31: Latin America Smart Textiles for the Military Market Value Share (%), By Segment 1, 2019 & 2027
Figure 32: Latin America Smart Textiles for the Military Market Forecast (USD Billion), by Sub-Segment 1, 2016-2027
Figure 33: Latin America Smart Textiles for the Military Market Forecast (USD Billion), by Sub-Segment 2, 2016-2027
Figure 34: Latin America Smart Textiles for the Military Market Value Share (%), By Segment 2, 2019 & 2027
Figure 35: Latin America Smart Textiles for the Military Market Forecast (USD Billion), by Sub-Segment 1, 2016-2027
Figure 36: Latin America Smart Textiles for the Military Market Forecast (USD Billion), by Sub-Segment 2, 2016-2027
Figure 37: Latin America Smart Textiles for the Military Market Forecast (USD Billion), by Sub-Segment 3, 2016-2027
Figure 38: Latin America Smart Textiles for the Military Market Forecast (USD Billion), by Others, 2016-2027
Figure 39: Latin America Smart Textiles for the Military Market Value Share (%), By Segment 3, 2019 & 2027
Figure 40: Latin America Smart Textiles for the Military Market Forecast (USD Billion), by Sub-Segment 1, 2016-2027
Figure 41: Latin America Smart Textiles for the Military Market Forecast (USD Billion), by Sub-Segment 2, 2016-2027
Figure 42: Latin America Smart Textiles for the Military Market Forecast (USD Billion), by Sub-Segment 3, 2016-2027
Figure 43: Latin America Smart Textiles for the Military Market Forecast (USD Billion), by Others, 2016-2027
Figure 44: Latin America Smart Textiles for the Military Market Forecast (USD Billion), by Brazil, 2016-2027
Figure 45: Latin America Smart Textiles for the Military Market Forecast (USD Billion), by Mexico, 2016-2027
Figure 46: Latin America Smart Textiles for the Military Market Forecast (USD Billion), by Rest of Latin America, 2016-2027
Figure 47: Europe Smart Textiles for the Military Market Value Share (%), By Segment 1, 2019 & 2027
Figure 48: Europe Smart Textiles for the Military Market Forecast (USD Billion), by Sub-Segment 1, 2016-2027
Figure 49: Europe Smart Textiles for the Military Market Forecast (USD Billion), by Sub-Segment 2, 2016-2027
Figure 50: Europe Smart Textiles for the Military Market Value Share (%), By Segment 2, 2019 & 2027
Figure 51: Europe Smart Textiles for the Military Market Forecast (USD Billion), by Sub-Segment 1, 2016-2027
Figure 52: Europe Smart Textiles for the Military Market Forecast (USD Billion), by Sub-Segment 2, 2016-2027
Figure 53: Europe Smart Textiles for the Military Market Forecast (USD Billion), by Sub-Segment 3, 2016-2027
Figure 54: Europe Smart Textiles for the Military Market Forecast (USD Billion), by Others, 2016-2027
Figure 55: Europe Smart Textiles for the Military Market Value Share (%), By Segment 3, 2019 & 2027
Figure 56: Europe Smart Textiles for the Military Market Forecast (USD Billion), by Sub-Segment 1, 2016-2027
Figure 57: Europe Smart Textiles for the Military Market Forecast (USD Billion), by Sub-Segment 2, 2016-2027
Figure 58: Europe Smart Textiles for the Military Market Forecast (USD Billion), by Sub-Segment 3, 2016-2027
Figure 59: Europe Smart Textiles for the Military Market Forecast (USD Billion), by Others, 2016-2027
Figure 60: Europe Smart Textiles for the Military Market Forecast (USD Billion), by U.K., 2016-2027
Figure 61: Europe Smart Textiles for the Military Market Forecast (USD Billion), by Germany, 2016-2027
Figure 62: Europe Smart Textiles for the Military Market Forecast (USD Billion), by France, 2016-2027
Figure 63: Europe Smart Textiles for the Military Market Forecast (USD Billion), by Italy, 2016-2027
Figure 64: Europe Smart Textiles for the Military Market Forecast (USD Billion), by Spain, 2016-2027
Figure 65: Europe Smart Textiles for the Military Market Forecast (USD Billion), by Russia, 2016-2027
Figure 66: Europe Smart Textiles for the Military Market Forecast (USD Billion), by Rest of Europe, 2016-2027
Figure 67: Asia Pacific Smart Textiles for the Military Market Value Share (%), By Segment 1, 2019 & 2027
Figure 68: Asia Pacific Smart Textiles for the Military Market Forecast (USD Billion), by Sub-Segment 1, 2016-2027
Figure 69: Asia Pacific Smart Textiles for the Military Market Forecast (USD Billion), by Sub-Segment 2, 2016-2027
Figure 70: Asia Pacific Smart Textiles for the Military Market Value Share (%), By Segment 2, 2019 & 2027
Figure 71: Asia Pacific Smart Textiles for the Military Market Forecast (USD Billion), by Sub-Segment 1, 2016-2027
Figure 72: Asia Pacific Smart Textiles for the Military Market Forecast (USD Billion), by Sub-Segment 2, 2016-2027
Figure 73: Asia Pacific Smart Textiles for the Military Market Forecast (USD Billion), by Sub-Segment 3, 2016-2027
Figure 74: Asia Pacific Smart Textiles for the Military Market Forecast (USD Billion), by Others, 2016-2027
Figure 75: Asia Pacific Smart Textiles for the Military Market Value Share (%), By Segment 3, 2019 & 2027
Figure 76: Asia Pacific Smart Textiles for the Military Market Forecast (USD Billion), by Sub-Segment 1, 2016-2027
Figure 77: Asia Pacific Smart Textiles for the Military Market Forecast (USD Billion), by Sub-Segment 2, 2016-2027
Figure 78: Asia Pacific Smart Textiles for the Military Market Forecast (USD Billion), by Sub-Segment 3, 2016-2027
Figure 79: Asia Pacific Smart Textiles for the Military Market Forecast (USD Billion), by Others, 2016-2027
Figure 80: Asia Pacific Smart Textiles for the Military Market Forecast (USD Billion), by China, 2016-2027
Figure 81: Asia Pacific Smart Textiles for the Military Market Forecast (USD Billion), by India, 2016-2027
Figure 82: Asia Pacific Smart Textiles for the Military Market Forecast (USD Billion), by Japan, 2016-2027
Figure 83: Asia Pacific Smart Textiles for the Military Market Forecast (USD Billion), by Australia, 2016-2027
Figure 84: Asia Pacific Smart Textiles for the Military Market Forecast (USD Billion), by Southeast Asia, 2016-2027
Figure 85: Asia Pacific Smart Textiles for the Military Market Forecast (USD Billion), by Rest of Asia Pacific, 2016-2027
Figure 86: Middle East & Africa Smart Textiles for the Military Market Value Share (%), By Segment 1, 2019 & 2027
Figure 87: Middle East & Africa Smart Textiles for the Military Market Forecast (USD Billion), by Sub-Segment 1, 2016-2027
Figure 88: Middle East & Africa Smart Textiles for the Military Market Forecast (USD Billion), by Sub-Segment 2, 2016-2027
Figure 89: Middle East & Africa Smart Textiles for the Military Market Value Share (%), By Segment 2, 2019 & 2027
Figure 90: Middle East & Africa Smart Textiles for the Military Market Forecast (USD Billion), by Sub-Segment 1, 2016-2027
Figure 91: Middle East & Africa Smart Textiles for the Military Market Forecast (USD Billion), by Sub-Segment 2, 2016-2027
Figure 92: Middle East & Africa Smart Textiles for the Military Market Forecast (USD Billion), by Sub-Segment 3, 2016-2027
Figure 93: Middle East & Africa Smart Textiles for the Military Market Forecast (USD Billion), by Others, 2016-2027
Figure 94: Middle East & Africa Smart Textiles for the Military Market Value Share (%), By Segment 3, 2019 & 2027
Figure 95: Middle East & Africa Smart Textiles for the Military Market Forecast (USD Billion), by Sub-Segment 1, 2016-2027
Figure 96: Middle East & Africa Smart Textiles for the Military Market Forecast (USD Billion), by Sub-Segment 2, 2016-2027
Figure 97: Middle East & Africa Smart Textiles for the Military Market Forecast (USD Billion), by Sub-Segment 3, 2016-2027
Figure 98: Middle East & Africa Smart Textiles for the Military Market Forecast (USD Billion), by Others, 2016-2027
Figure 99: Middle East & Africa Smart Textiles for the Military Market Forecast (USD Billion), by GCC, 2016-2027
Figure 100: Middle East & Africa Smart Textiles for the Military Market Forecast (USD Billion), by South Africa, 2016-2027
Figure 101: Middle East & Africa Smart Textiles for the Military Market Forecast (USD Billion), by Rest of Middle East & Africa, 2016-2027
List of Tables
Table 1: Global Smart Textiles for the Military Market Revenue (USD Billion) Forecast, by Segment 1, 2016-2027
Table 2: Global Smart Textiles for the Military Market Revenue (USD Billion) Forecast, by Segment 2, 2016-2027
Table 3: Global Smart Textiles for the Military Market Revenue (USD Billion) Forecast, by Segment 3, 2016-2027
Table 4: Global Smart Textiles for the Military Market Revenue (USD Billion) Forecast, by Region, 2016-2027
Table 5: North America Smart Textiles for the Military Market Revenue (USD Billion) Forecast, by Segment 1, 2016-2027
Table 6: North America Smart Textiles for the Military Market Revenue (USD Billion) Forecast, by Segment 2, 2016-2027
Table 7: North America Smart Textiles for the Military Market Revenue (USD Billion) Forecast, by Segment 3, 2016-2027
Table 8: North America Smart Textiles for the Military Market Revenue (USD Billion) Forecast, by Country, 2016-2027
Table 9: Europe Smart Textiles for the Military Market Revenue (USD Billion) Forecast, by Segment 1, 2016-2027
Table 10: Europe Smart Textiles for the Military Market Revenue (USD Billion) Forecast, by Segment 2, 2016-2027
Table 11: Europe Smart Textiles for the Military Market Revenue (USD Billion) Forecast, by Segment 3, 2016-2027
Table 12: Europe Smart Textiles for the Military Market Revenue (USD Billion) Forecast, by Country, 2016-2027
Table 13: Latin America Smart Textiles for the Military Market Revenue (USD Billion) Forecast, by Segment 1, 2016-2027
Table 14: Latin America Smart Textiles for the Military Market Revenue (USD Billion) Forecast, by Segment 2, 2016-2027
Table 15: Latin America Smart Textiles for the Military Market Revenue (USD Billion) Forecast, by Segment 3, 2016-2027
Table 16: Latin America Smart Textiles for the Military Market Revenue (USD Billion) Forecast, by Country, 2016-2027
Table 17: Asia Pacific Smart Textiles for the Military Market Revenue (USD Billion) Forecast, by Segment 1, 2016-2027
Table 18: Asia Pacific Smart Textiles for the Military Market Revenue (USD Billion) Forecast, by Segment 2, 2016-2027
Table 19: Asia Pacific Smart Textiles for the Military Market Revenue (USD Billion) Forecast, by Segment 3, 2016-2027
Table 20: Asia Pacific Smart Textiles for the Military Market Revenue (USD Billion) Forecast, by Country, 2016-2027
Table 21: Middle East & Africa Smart Textiles for the Military Market Revenue (USD Billion) Forecast, by Segment 1, 2016-2027
Table 22: Middle East & Africa Smart Textiles for the Military Market Revenue (USD Billion) Forecast, by Segment 2, 2016-2027
Table 23: Middle East & Africa Smart Textiles for the Military Market Revenue (USD Billion) Forecast, by Segment 3, 2016-2027
Table 24: Middle East & Africa Smart Textiles for the Military Market Revenue (USD Billion) Forecast, by Country, 2016-2027
Research Process
Data Library Research are conducted by industry experts who offer insight on
industry structure, market segmentations technology assessment and competitive landscape (CL), and penetration, as well as on emerging trends. Their analysis is based on primary interviews (~ 80%) and secondary research (~ 20%) as well as years of professional expertise in their respective industries. Adding to this, by analysing historical trends and current market positions, our analysts predict where the market will be headed for the next five years. Furthermore, the varying trends of segment & categories geographically presented are also studied and the estimated based on the primary & secondary research.
In this particular report from the supply side Data Library Research has conducted primary surveys (interviews) with the key level executives (VP, CEO’s, Marketing Director, Business Development Manager
and SOFT) of the companies that active & prominent as well as the midsized organization
FIGURE 1: DLR RESEARH PROCESS
![research-methodology1]()
Primary Research
Extensive primary research was conducted to gain a deeper insight of the market and industry performance. The analysis is based on both primary and secondary research as well as years of professional expertise in the respective industries.
In addition to analysing current and historical trends, our analysts predict where the market is headed over the next five years.
It varies by segment for these categories geographically presented in the list of market tables. Speaking about this particular report we have conducted primary surveys (interviews) with the key level executives (VP, CEO’s, Marketing Director, Business Development Manager and many more) of the major players active in the market.
Secondary Research
Secondary research was mainly used to collect and identify information useful for the extensive, technical, market-oriented, and Friend’s study of the Global Extra Neutral Alcohol. It was also used to obtain key information about major players, market classification and segmentation according to the industry trends, geographical markets, and developments related to the market and technology perspectives. For this study, analysts have gathered information from various credible sources, such as annual reports, sec filings, journals, white papers, SOFT presentations, and company web sites.
Market Size Estimation
Both, top-down and bottom-up approaches were used to estimate and validate the size of the Global market and to estimate the size of various other dependent submarkets in the overall Extra Neutral Alcohol. The key players in the market were identified through secondary research and their market contributions in the respective geographies were determined through primary and secondary research.
Forecast Model
![research-methodology2]()