Spectral Computed Tomography (CT) Market Overview
Spectral computed tomography (CT), also known as dual-energy computed tomography (DECT), is a unique type of computed tomography that is widely utilized in x-ray scanning. Rather than using a single large x-ray energy band, it divides the energy into two or more narrow energy bands. Different body tissues respond to energy bands in different ways.
Increased technical improvements in diagnostic imaging technologies are driving the global spectral computed tomography (CT) market. Hospitals utilize a variety of medical imaging systems for x-ray scanning, including computed tomography, radiography, and fluoroscopy. The increasing use of IT in medical equipment to improve product quality is a significant step forward in the medical imaging market.
Medical image management is closely linked to diagnosis services and is an important part of the healthcare IT industry. Aside from the widespread availability of traditional x-ray imaging devices and their low cost, spectral tomography is gaining popularity, and adoption is expected to accelerate in the near future. Furthermore, disorders with a high prevalence rate, especially chronic noncommunicable diseases, are expected to drive the Spectral Computed Tomography (CT) Market.
However, expensive imaging costs, contrasting agent reactions, high installation costs, a scarcity of qualified staff, technology in its early stages, and a lack of awareness are projected to hamper market expansion throughout the projection period. Nonetheless, throughout the projected period, increased technical breakthroughs in diagnostic imaging devices are expected to provide attractive growth opportunities for the market.
| Report Metric | Details |
| Market size available for years | 2023–2030 |
| Base year considered | 2023 |
| Forecast period | 2024–2030 |
| Forecast unit | Value (USD Million) |
| Segments covered | Product, Application, and Region. |
| Regions covered | North America (the U.S. and Canada), Europe (UK, Germany, France, Italy, Spain, Russia, Rest of Europe), Asia-Pacific (China, India, Japan, Australia, South East Asia, Rest of Asia Pacific), Latin America and the Middle East and Africa (Brazil, Saudi Arabia, UAE, Rest of LAMEA) |
| Companies covered | Fisher Scientific, Agilent Technologies, Koninklijke Philips, Neusoft Medical Systems, General Electric, Pall, Hitachi medical, Xoran Technologies, Varian Medical Systems, Trivitron Healthcare, Siemens Healthcare Private, PerkinElmer, Bio-Rad Laboratories, Cleaver Scientific, NeuroLogica. |
Covid-19 Impact on Spectral Computed Tomography (CT) Market
In addition, the current Spectral Computed Tomography (CT) Market study offers a detailed analysis of the current COVID-19 pandemic impact on the market growth and its influence on the future growth of the Spectral Computed Tomography (CT) Market. The recently published report demonstrates the elevation in the demand for the healthcare sector. The healthcare manufacturers have experienced long term as well as short term effect which includes supply shortages, panic buying, and stocking, regulation changes as short-term whereas approval delays and possible trend variations in consumption could be perceived as long-term impacts of COVID-19 on the health and pharmaceutical market.
The increasing need for a cure has pushed vaccine research and manufacturers to the limit. In addition to this, panic conditions have already spurred the demand for many healthcare products and services which are discussed in detail in this report. Moreover, the impact of COVID-19 on overall market revenue for the base year 2020 and its projection up to 2027 is provided in detail in this report.
Spectral Computed Tomography (CT) Market Segment Overview
According to Product, the Electron Beam Tomography segment is expected to grow at the fastest rate for the forecast period. Electron beam computed tomography (EBCT) is a relatively new technology that has primarily been utilized in adult patients to diagnose coronary artery calcification. Moreover, by Application, the Hospitals segment is expected to have the greatest CAGR during the forecast period. The increase in the number of emergency admissions in hospitals and surgeries is attributable to the segment's expansion. Computed tomography is a vital tool for pre-operative and post-operative diagnosis, as well as determining the effectiveness of treatment.
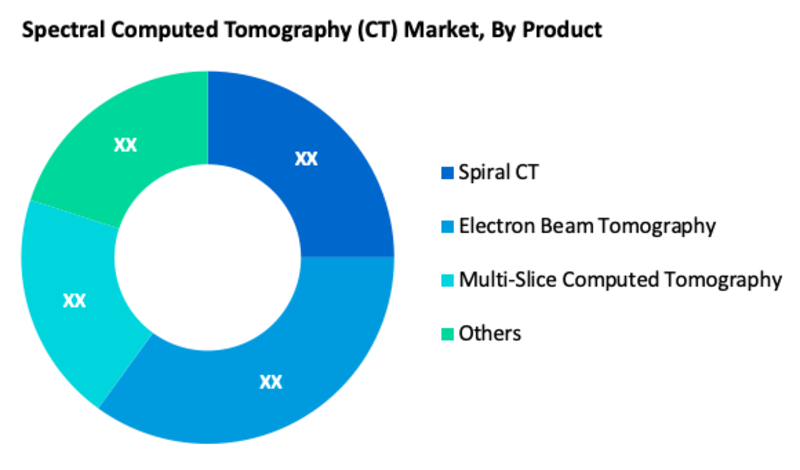
Spectral Computed Tomography (CT) Market, By Product
· Spiral CT
· Electron Beam Tomography
· Multi-Slice Computed Tomography
· Others
Spectral Computed Tomography (CT) Market, By Application
· Pharmaceutical Industries
· Hospitals
· Research and Development
· Others
Spectral Computed Tomography (CT) Market Regional Overview
The global Spectral Computed Tomography (CT) market is divided into North America, Europe, Asia Pacific, Latin America, and the Middle East & Africa. Due to an increase in the ageing population and a high rate of adoption of innovative technologies, North America dominated the global Spectral Computed Tomography (CT) market, followed by Western and Eastern Europe. Due to rising economies and average healthcare spending, Asia Pacific is expected to see a modest increase in growth.
Spectral Computed Tomography (CT) Market, By Geography
· North America (US & Canada)
· Europe (UK, Germany, France, Italy, Spain, Russia & Rest of Europe)
· Asia-Pacific (Japan, China, India, Australia, & South Korea, & Rest of Asia-Pacific)
· LAMEA (Brazil, Saudi Arabia, UAE & Rest of LAMEA)
Spectral Computed Tomography (CT) Market Competitor overview
Some key developments and strategies adopted by manufacturers in Spectral Computed Tomography (CT) are highlighted below.
· In March 2021, FUJIFILM Corporation has completed the process to acquire the Diagnostic Imaging-related Business of Hitachi, Ltd. Accordingly, FUJIFILM Healthcare Corporation, established by Hitachi to absorb the Business, starts to operate as Fujifilm’s wholly-owned subsidiary.
· In November 2020, GE Healthcare announced its acquisition of Prismatic Sensors AB, a Swedish start-up specializing in photon counting detectors, signifying the company’s continued investment in photon counting CT technology. This technology has the potential to significantly increase clinical performance for oncology, cardiology, neurology, and many other clinical CT applications.
· In February 2020, GE Healthcare recently launched its new GE Healthcare Rehovot engineering and laboratories department. The company's site in Rehovot is already a global center for GE in research, development, and exports of digital nuclear medicine systems, and development of GE's PET/CT systems - positron imaging of cell activity, which is more advanced and expensive than other imaging technologies.
Spectral Computed Tomography (CT) Market, Key Players
· Fisher Scientific
· Agilent Technologies
· Koninklijke Philips
· Neusoft Medical Systems
· General Electric
· Pall
· Hitachi medical
· Xoran Technologies
· Varian Medical Systems
· Trivitron Healthcare
· Siemens Healthcare Private
· PerkinElmer
· Bio-Rad Laboratories
· Cleaver Scientific
· NeuroLogica
Q1. What are the driving factors for the global Spectral Computed Tomography (CT) market?
Increased technical improvements in diagnostic imaging technologies are driving the global spectral computed tomography (CT) market.
Q2. What are the restraining factors for the global Spectral Computed Tomography (CT) market?
Expensive imaging costs, contrasting agent reactions, high installation costs, a scarcity of qualified staff, technology in its early stages, and a lack of awareness are projected to hamper market expansion throughout the projection period.
Q3. Which segment is projected to hold the largest share in the global Spectral Computed Tomography (CT) market?
Electron Beam Tomography segment is projected to hold the largest share in the global Spectral Computed Tomography (CT) market
Q4. Which region holds the largest share in the global Spectral Computed Tomography (CT) market?
North America holds the largest share in the global Spectral Computed Tomography (CT) market
Q5. Which are the prominent players in the global Spectral Computed Tomography (CT) market?
Fisher Scientific, Agilent Technologies, Koninklijke Philips, Neusoft Medical Systems, General Electric, Pall, Hitachi medical, Xoran Technologies, Varian Medical Systems, Trivitron Healthcare, Siemens Healthcare Private, PerkinElmer, Bio-Rad Laboratories, Cleaver Scientific, NeuroLogica. are some key players in the global Spectral Computed Tomography (CT) market
Data Library Research are conducted by industry experts who offer insight on industry structure, market segmentations technology assessment and competitive landscape (CL), and penetration, as well as on emerging trends. Their analysis is based on primary interviews (~ 80%) and secondary research (~ 20%) as well as years of professional expertise in their respective industries. Adding to this, by analysing historical trends and current market positions, our analysts predict where the market will be headed for the next five years. Furthermore, the varying trends of segment & categories geographically presented are also studied and the estimated based on the primary & secondary research.
In this particular report from the supply side Data Library Research has conducted primary surveys (interviews) with the key level executives (VP, CEO’s, Marketing Director, Business Development Manager and SOFT) of the companies that active & prominent as well as the midsized organization
FIGURE 1: DLR RESEARH PROCESS
Extensive primary research was conducted to gain a deeper insight of the market and industry performance. The analysis is based on both primary and secondary research as well as years of professional expertise in the respective industries.
In addition to analysing current and historical trends, our analysts predict where the market is headed over the next five years.
It varies by segment for these categories geographically presented in the list of market tables. Speaking about this particular report we have conducted primary surveys (interviews) with the key level executives (VP, CEO’s, Marketing Director, Business Development Manager and many more) of the major players active in the market.
Secondary ResearchSecondary research was mainly used to collect and identify information useful for the extensive, technical, market-oriented, and Friend’s study of the Global Extra Neutral Alcohol. It was also used to obtain key information about major players, market classification and segmentation according to the industry trends, geographical markets, and developments related to the market and technology perspectives. For this study, analysts have gathered information from various credible sources, such as annual reports, sec filings, journals, white papers, SOFT presentations, and company web sites.
Market Size EstimationBoth, top-down and bottom-up approaches were used to estimate and validate the size of the Global market and to estimate the size of various other dependent submarkets in the overall Extra Neutral Alcohol. The key players in the market were identified through secondary research and their market contributions in the respective geographies were determined through primary and secondary research.
Forecast Model