Stolen Vehicle Recovery (SVR) Tracking Service Market Overview and Analysis
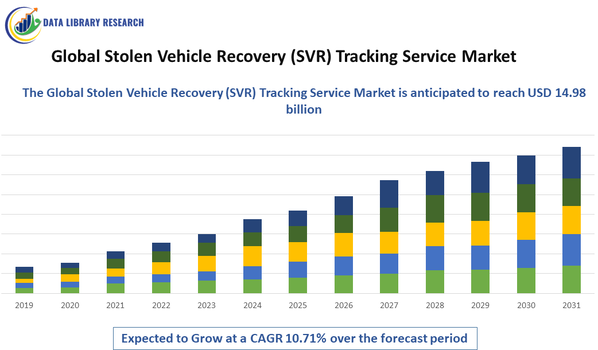
The Global Stolen Vehicle Recovery (SVR) Tracking Service Market size was estimated at USD 9.02 billion in 2026 and is expected to grow at a CAGR of 10.71% between 2026 and 2033, reaching USD 14.98 billion in 2033.
Get Complete Analysis Of The Report - Download Updated Free Sample PDF
The Global Stolen Vehicle Recovery (SVR) Tracking Service Market involves systems and services designed to locate and recover stolen vehicles using GPS, cellular, and IoT technologies. SVR solutions are typically integrated into vehicle telematics or offered as standalone subscription services, enabling real-time tracking, geo-fencing, and alert notifications. Law enforcement agencies and private recovery teams use these tools to quickly pinpoint vehicle locations, improving recovery rates and reducing losses. Market growth is driven by rising vehicle theft rates, increasing adoption of connected car technologies, and greater demand for insurance-linked tracking services.
Stolen Vehicle Recovery (SVR) Tracking Service Market Latest Trends
The global Stolen Vehicle Recovery (SVR) tracking service market is expanding due to increasing vehicle thefts and rising demand for connected car security solutions. Telematics and IoT integration has made real-time tracking and geo-fencing more reliable, while AI-powered analytics enhance theft prediction and recovery efficiency. Insurance companies are increasingly offering SVR services as part of policy packages, boosting adoption. Additionally, OEMs are incorporating SVR features directly into vehicles, shifting the market toward factory-installed solutions.
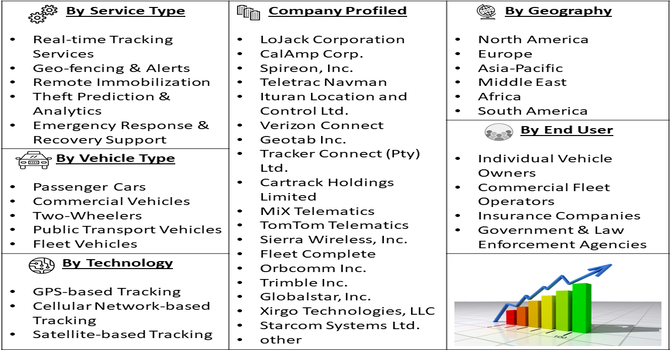
Segmentation: The Global Stolen Vehicle Recovery (SVR) Tracking Service Market is segmented by Service Type (Real-time Tracking Services, Geo-fencing & Alerts, Remote Immobilization, Theft Prediction & Analytics and Emergency Response & Recovery Support), Technology (GPS-based Tracking, Cellular Network-based Tracking, Satellite-based Tracking, Hybrid Tracking Systems and IoT & Telematics-based Tracking), Vehicle Type (Passenger Cars, Commercial Vehicles, Two-Wheelers, Public Transport Vehicles and Fleet Vehicles (Taxi, Rental, Logistics, etc.)), Installation Type (OEM Installed and Aftermarket Installed), End User (Individual Vehicle Owners, Commercial Fleet Operators, Insurance Companies and Government & Law Enforcement Agencies), and Geography (North America, Europe, Asia-Pacific, Middle East and Africa, and South America). The report provides the value (in USD million) for the above segments.
For Detailed Market Segmentation - Get a Free Sample PDF
Market Drivers:
- Rising Vehicle Theft Rates
The major driver of the SVR tracking service market is the rising incidence of vehicle theft worldwide. As organized theft and opportunistic car theft increase, consumers and fleet operators are seeking reliable recovery solutions. SVR tracking services offer real-time location monitoring, geo-fencing alerts, and rapid response capabilities, which improve recovery chances and reduce financial losses.
In 2024, Semtech and Traxmate partnered to develop AI-enabled hybrid LoRa asset trackers, combining low-power wide-area connectivity with smart analytics. These trackers were designed to provide long-range, reliable tracking for vehicles and assets while optimizing battery life and improving real-time monitoring. The collaboration aimed to expand IoT tracking solutions across logistics and mobility industries. This demand is especially strong in urban areas and regions with high crime rates. The threat of theft also encourages insurance companies to promote SVR services as value-added features, further driving market growth as more vehicle owners prioritize security and peace of mind.
- Growing Connected Vehicle Adoption
The growing adoption of connected vehicles and telematics systems is a key driver for SVR tracking services. Modern vehicles increasingly feature built-in GPS, cellular connectivity, and advanced sensors, enabling seamless integration of SVR solutions. OEMs are incorporating tracking features directly into new models, while aftermarket devices provide options for older vehicles. The rise of fleet management and ride-hailing services also boosts demand for SVR tracking to safeguard assets. As vehicles become more digitally connected, the market for SVR services expands through enhanced functionality, such as remote immobilization, AI-based tracking, and integration with smart city infrastructure and law enforcement systems.
Market Restraints
- Privacy and Data Security Concerns
A major restraint for the SVR tracking service market is growing consumer concern over privacy and data security. Tracking systems collect sensitive location and behavioral data, which can be vulnerable to hacking or misuse if not properly protected. High-profile data breaches and weak regulatory frameworks in some regions can erode trust in SVR providers. Consumers may hesitate to adopt tracking services due to fears of constant surveillance or unauthorized access to their vehicle data. To overcome this restraint, companies must invest in strong encryption, transparent data policies, and compliance with privacy regulations. Failure to address these concerns can slow market adoption and limit growth.
Socioeconomic Impact on Stolen Vehicle Recovery (SVR) Tracking Service Market
SVR tracking services contribute to public safety by improving vehicle recovery rates and reducing losses from theft, which benefits consumers and insurance providers. Faster recoveries lower financial burdens on victims and can reduce insurance premiums over time. The market also drives employment and innovation in telematics, cybersecurity, and data analytics. As more vehicles become connected, SVR services support broader smart mobility initiatives and contribute to safer urban environments. However, privacy concerns and data security risks can create societal challenges, requiring strict regulations and transparent data handling practices.
Segmental Analysis
- Remote Immobilization segment is expected to witness highest growth over the forecast period
The remote immobilization segment is expected to witness the highest growth over the forecast period due to increasing demand for enhanced vehicle security and theft prevention. This feature allows owners or fleet operators to remotely disable the vehicle after theft detection, significantly improving recovery chances and reducing financial losses. With rising vehicle theft incidents and greater awareness of security technologies, more users are opting for systems that provide active intervention capabilities. Remote immobilization is particularly valued by insurance providers and commercial fleets, as it minimizes risks and supports faster recovery. Consequently, the segment is projected to expand rapidly as demand for advanced SVR features grows.
- Cellular Network-based Tracking segment is expected to witness highest growth over the forecast period
The cellular network-based tracking segment is expected to witness the highest growth over the forecast period due to the widespread availability and reliability of cellular networks. These systems enable real-time vehicle tracking, instant alerts, and seamless communication between the vehicle and monitoring centers. Cellular tracking is especially useful in urban and suburban areas where network coverage is strong, supporting efficient recovery operations. Additionally, advancements in 4G and 5G technologies have improved tracking accuracy and response time. As connected vehicle adoption increases, cellular-based SVR solutions offer a cost-effective and scalable option, driving strong market growth across regions.
- Commercial Vehicles segment is expected to witness highest growth over the forecast period
The commercial vehicles segment is expected to witness the highest growth over the forecast period due to growing demand for secure logistics and transportation operations. Commercial fleets, including trucks, buses, and delivery vehicles, face high risks of theft and cargo loss, making SVR tracking essential. Fleet operators prioritize real-time tracking, theft alerts, and recovery support to safeguard valuable assets and reduce downtime. As e-commerce and last-mile delivery services expand globally, the need for robust security solutions in commercial vehicles has intensified. This has led to greater adoption of SVR systems in the commercial segment, driving significant market growth.
- Aftermarket Installed segment is expected to witness highest growth over the forecast period
The aftermarket installed segment is expected to witness the highest growth over the forecast period as vehicle owners and fleet operators increasingly retrofit SVR solutions into existing vehicles. Many older models lack built-in tracking systems, creating demand for aftermarket devices that offer enhanced security and recovery features. Aftermarket installations are also favored for their flexibility and cost-effectiveness, allowing users to choose customized tracking packages based on specific needs. Additionally, growing awareness and availability of plug-and-play SVR devices have made retrofitting easier. As the used vehicle market expands, aftermarket SVR adoption is expected to rise, supporting strong segment growth.
- Commercial Fleet Operators segment is expected to witness highest growth over the forecast period
The commercial fleet operators segment is expected to witness the highest growth over the forecast period due to increasing fleet sizes and higher security risks in logistics and transportation industries. Fleet operators require comprehensive tracking and recovery solutions to protect assets, prevent theft, and minimize operational disruptions. SVR services help improve route visibility, manage vehicle utilization, and ensure quick recovery in case of theft. Insurance companies also offer incentives for fleets using SVR systems, further encouraging adoption. As e-commerce and delivery services continue to grow, fleet operators are investing heavily in vehicle security, driving strong demand for SVR tracking services.
- North American Region is expected to witness highest growth over the forecast period
The North American region is expected to witness the highest growth over the forecast period due to high vehicle ownership rates and strong adoption of connected car technologies. Rising vehicle theft rates in several cities have increased demand for SVR tracking services, particularly among commercial fleets and individual owners.
In February 2025, Bosch acquired Roadside Protect, adding a network of 12,000 towing partners across the United States and Canada. The acquisition aimed to enhance AI-enabled breakdown response by improving service speed and geographic coverage. This move strengthened Bosch’s mobility services portfolio, enabling faster, more efficient roadside support and improved customer experience across North America. The acquisition boosted the SVR market by integrating vehicle tracking with rapid recovery support, enhancing the value of tracking services through faster intervention and strengthening partnerships between tracking providers and roadside assistance networks.
Advanced cellular network infrastructure and widespread telematics adoption support efficient tracking and real-time monitoring. Insurance providers in North America also promote SVR solutions through policy incentives and partnerships. Additionally, strong regulatory support for vehicle safety and advanced mobility systems contributes to market growth. As a result, North America is projected to lead the global SVR market in the coming years.
| Report Matrics |
Details |
| Market Size Value |
USD 14.98 billion |
| Growth Rate |
CAGR of 10.71% |
| Forecast |
2026-2033 |
| Historical data |
2021-2024 |
| Base Year |
2025 |
| Report Coverage |
Forecasted revenue, company rating, competitive environment, growth drivers, and trends |
| Segment Coverage |
Type, Application, End-User, Geography |
| Regional Scope |
North America, Europe, Asia Pacific, Middle East |
| Customized scope |
Free customization of reports (With 3 months Analysis Support ) |
| To Learn More About This Report |
Request a Free Sample Copy |
Stolen Vehicle Recovery (SVR) Tracking Service Market Competitive Landscape
The SVR tracking service market is highly competitive, featuring established telematics providers, automotive OEMs, and specialized security companies. Key players compete on tracking accuracy, real-time monitoring capabilities, integration with vehicle systems, and subscription service models. Partnerships between automakers, insurance firms, and technology providers are common, as they enable bundled services and wider market reach. Product differentiation often comes from advanced features like AI-based theft prediction, remote immobilization, and integration with law enforcement databases. Competitive advantage also depends on robust customer support, reliable network coverage, and strong data security protocols. Emerging startups are disrupting the market with innovative low-cost and aftermarket solutions.
The major players for above market are:
- LoJack Corporation
- CalAmp Corp.
- Spireon, Inc.
- Teletrac Navman
- Ituran Location and Control Ltd.
- Verizon Connect
- Geotab Inc.
- Tracker Connect (Pty) Ltd.
- Cartrack Holdings Limited
- MiX Telematics
- TomTom Telematics
- Sierra Wireless, Inc.
- Fleet Complete
- Orbcomm Inc.
- Trimble Inc.
- Globalstar, Inc.
- Xirgo Technologies, LLC
- Starcom Systems Ltd.
- Digital Matter Pty Ltd.
Recent Development
- In April 2025, Geotab partnered with more than 80% of leading OEMs, including BMW, Ford, Mercedes-Benz, Renault, Stellantis, Volkswagen, and Volvo. The collaboration aimed to standardize data, promote industry-wide harmonization, and enable hardware-free SVR solutions, improving telematics integration, fleet monitoring, and vehicle recovery efficiency across mixed fleets and vehicle types.
- In March 2025, Ping An P&C and FAW Hongqi introduced the Hongqi Intelligent Driving Protection Services for connected EVs, offering advanced safety and vehicle monitoring features. The service aimed to support real-time incident response and vehicle security through connected car data and intelligent protection capabilities. This initiative strengthened EV safety ecosystems and promoted broader adoption of connected vehicle services in China.
Frequently Asked Questions (FAQ) :
Q1. What are the main growth-driving factors for this market?
Rising vehicle theft rates globally and increasing consumer awareness regarding vehicle safety are primary drivers. The integration of IoT and GPS technologies allows for real-time tracking, while insurance companies often offer premium discounts for vehicles equipped with SVR systems. Additionally, the growth of commercial fleet management necessitates robust recovery solutions.
Q2. What are the main restraining factors for this market?
High subscription costs and the initial expense of hardware installation can deter price-sensitive consumers. Privacy concerns regarding constant location monitoring also act as a significant barrier. Furthermore, sophisticated thieves now use signal jammers to bypass GPS and GSM tracking, forcing manufacturers to constantly innovate against increasingly high-tech criminal methods.
Q3. Which segment is expected to witness high growth?
The commercial vehicle segment is expected to witness substantial growth. Logistics and transportation companies are prioritizing SVR services to protect valuable cargo and maintain operational continuity. Additionally, the passenger car segment is expanding rapidly as luxury vehicle owners increasingly adopt sophisticated, app-based tracking solutions to mitigate the risk of theft.
Q4. Who are the top major players for this market?
Key players dominating this market include LoJack (CalAmp), Ituran Location and Control, Tracker (Tantalum), and Spireon. Other prominent companies include Cartrack, Directed Electronics, and Vodafone Automotive. These leaders focus on expanding their service networks and integrating advanced telematics with law enforcement databases to improve recovery success rates and speed.
Q5. Which country is the largest player?
The United States is currently the largest player in the SVR market. This dominance is due to high vehicle ownership rates, a strong presence of leading technology providers, and sophisticated law enforcement integration. Increasing investments in smart city infrastructure and a high demand for connected car features further solidify its leading position.
List of Figures
Figure 1: Global Stolen Vehicle Recovery (SVR) Tracking Service Market Revenue Breakdown (USD Billion, %) by Region, 2022 & 2029
Figure 2: Global Stolen Vehicle Recovery (SVR) Tracking Service Market Value Share (%), By Segment 1, 2022 & 2029
Figure 3: Global Stolen Vehicle Recovery (SVR) Tracking Service Market Forecast (USD Billion), by Sub-Segment 1, 2018-2029
Figure 4: Global Stolen Vehicle Recovery (SVR) Tracking Service Market Forecast (USD Billion), by Sub-Segment 2, 2018-2029
Figure 5: Global Stolen Vehicle Recovery (SVR) Tracking Service Market Value Share (%), By Segment 2, 2022 & 2029
Figure 6: Global Stolen Vehicle Recovery (SVR) Tracking Service Market Forecast (USD Billion), by Sub-Segment 1, 2018-2029
Figure 7: Global Stolen Vehicle Recovery (SVR) Tracking Service Market Forecast (USD Billion), by Sub-Segment 2, 2018-2029
Figure 8: Global Stolen Vehicle Recovery (SVR) Tracking Service Market Forecast (USD Billion), by Sub-Segment 3, 2018-2029
Figure 9: Global Stolen Vehicle Recovery (SVR) Tracking Service Market Forecast (USD Billion), by Others, 2018-2029
Figure 10: Global Stolen Vehicle Recovery (SVR) Tracking Service Market Value Share (%), By Segment 3, 2022 & 2029
Figure 11: Global Stolen Vehicle Recovery (SVR) Tracking Service Market Forecast (USD Billion), by Sub-Segment 1, 2018-2029
Figure 12: Global Stolen Vehicle Recovery (SVR) Tracking Service Market Forecast (USD Billion), by Sub-Segment 2, 2018-2029
Figure 13: Global Stolen Vehicle Recovery (SVR) Tracking Service Market Forecast (USD Billion), by Sub-Segment 3, 2018-2029
Figure 14: Global Stolen Vehicle Recovery (SVR) Tracking Service Market Forecast (USD Billion), by Others, 2018-2029
Figure 15: Global Stolen Vehicle Recovery (SVR) Tracking Service Market Value (USD Billion), by Region, 2022 & 2029
Figure 16: North America Stolen Vehicle Recovery (SVR) Tracking Service Market Value Share (%), By Segment 1, 2022 & 2029
Figure 17: North America Stolen Vehicle Recovery (SVR) Tracking Service Market Forecast (USD Billion), by Sub-Segment 1, 2018-2029
Figure 18: North America Stolen Vehicle Recovery (SVR) Tracking Service Market Forecast (USD Billion), by Sub-Segment 2, 2018-2029
Figure 19: North America Stolen Vehicle Recovery (SVR) Tracking Service Market Value Share (%), By Segment 2, 2022 & 2029
Figure 20: North America Stolen Vehicle Recovery (SVR) Tracking Service Market Forecast (USD Billion), by Sub-Segment 1, 2018-2029
Figure 21: North America Stolen Vehicle Recovery (SVR) Tracking Service Market Forecast (USD Billion), by Sub-Segment 2, 2018-2029
Figure 22: North America Stolen Vehicle Recovery (SVR) Tracking Service Market Forecast (USD Billion), by Sub-Segment 3, 2018-2029
Figure 23: North America Stolen Vehicle Recovery (SVR) Tracking Service Market Forecast (USD Billion), by Others, 2018-2029
Figure 24: North America Stolen Vehicle Recovery (SVR) Tracking Service Market Value Share (%), By Segment 3, 2022 & 2029
Figure 25: North America Stolen Vehicle Recovery (SVR) Tracking Service Market Forecast (USD Billion), by Sub-Segment 1, 2018-2029
Figure 26: North America Stolen Vehicle Recovery (SVR) Tracking Service Market Forecast (USD Billion), by Sub-Segment 2, 2018-2029
Figure 27: North America Stolen Vehicle Recovery (SVR) Tracking Service Market Forecast (USD Billion), by Sub-Segment 3, 2018-2029
Figure 28: North America Stolen Vehicle Recovery (SVR) Tracking Service Market Forecast (USD Billion), by Others, 2018-2029
Figure 29: North America Stolen Vehicle Recovery (SVR) Tracking Service Market Forecast (USD Billion), by U.S., 2018-2029
Figure 30: North America Stolen Vehicle Recovery (SVR) Tracking Service Market Forecast (USD Billion), by Canada, 2018-2029
Figure 31: Latin America Stolen Vehicle Recovery (SVR) Tracking Service Market Value Share (%), By Segment 1, 2022 & 2029
Figure 32: Latin America Stolen Vehicle Recovery (SVR) Tracking Service Market Forecast (USD Billion), by Sub-Segment 1, 2018-2029
Figure 33: Latin America Stolen Vehicle Recovery (SVR) Tracking Service Market Forecast (USD Billion), by Sub-Segment 2, 2018-2029
Figure 34: Latin America Stolen Vehicle Recovery (SVR) Tracking Service Market Value Share (%), By Segment 2, 2022 & 2029
Figure 35: Latin America Stolen Vehicle Recovery (SVR) Tracking Service Market Forecast (USD Billion), by Sub-Segment 1, 2018-2029
Figure 36: Latin America Stolen Vehicle Recovery (SVR) Tracking Service Market Forecast (USD Billion), by Sub-Segment 2, 2018-2029
Figure 37: Latin America Stolen Vehicle Recovery (SVR) Tracking Service Market Forecast (USD Billion), by Sub-Segment 3, 2018-2029
Figure 38: Latin America Stolen Vehicle Recovery (SVR) Tracking Service Market Forecast (USD Billion), by Others, 2018-2029
Figure 39: Latin America Stolen Vehicle Recovery (SVR) Tracking Service Market Value Share (%), By Segment 3, 2022 & 2029
Figure 40: Latin America Stolen Vehicle Recovery (SVR) Tracking Service Market Forecast (USD Billion), by Sub-Segment 1, 2018-2029
Figure 41: Latin America Stolen Vehicle Recovery (SVR) Tracking Service Market Forecast (USD Billion), by Sub-Segment 2, 2018-2029
Figure 42: Latin America Stolen Vehicle Recovery (SVR) Tracking Service Market Forecast (USD Billion), by Sub-Segment 3, 2018-2029
Figure 43: Latin America Stolen Vehicle Recovery (SVR) Tracking Service Market Forecast (USD Billion), by Others, 2018-2029
Figure 44: Latin America Stolen Vehicle Recovery (SVR) Tracking Service Market Forecast (USD Billion), by Brazil, 2018-2029
Figure 45: Latin America Stolen Vehicle Recovery (SVR) Tracking Service Market Forecast (USD Billion), by Mexico, 2018-2029
Figure 46: Latin America Stolen Vehicle Recovery (SVR) Tracking Service Market Forecast (USD Billion), by Rest of Latin America, 2018-2029
Figure 47: Europe Stolen Vehicle Recovery (SVR) Tracking Service Market Value Share (%), By Segment 1, 2022 & 2029
Figure 48: Europe Stolen Vehicle Recovery (SVR) Tracking Service Market Forecast (USD Billion), by Sub-Segment 1, 2018-2029
Figure 49: Europe Stolen Vehicle Recovery (SVR) Tracking Service Market Forecast (USD Billion), by Sub-Segment 2, 2018-2029
Figure 50: Europe Stolen Vehicle Recovery (SVR) Tracking Service Market Value Share (%), By Segment 2, 2022 & 2029
Figure 51: Europe Stolen Vehicle Recovery (SVR) Tracking Service Market Forecast (USD Billion), by Sub-Segment 1, 2018-2029
Figure 52: Europe Stolen Vehicle Recovery (SVR) Tracking Service Market Forecast (USD Billion), by Sub-Segment 2, 2018-2029
Figure 53: Europe Stolen Vehicle Recovery (SVR) Tracking Service Market Forecast (USD Billion), by Sub-Segment 3, 2018-2029
Figure 54: Europe Stolen Vehicle Recovery (SVR) Tracking Service Market Forecast (USD Billion), by Others, 2018-2029
Figure 55: Europe Stolen Vehicle Recovery (SVR) Tracking Service Market Value Share (%), By Segment 3, 2022 & 2029
Figure 56: Europe Stolen Vehicle Recovery (SVR) Tracking Service Market Forecast (USD Billion), by Sub-Segment 1, 2018-2029
Figure 57: Europe Stolen Vehicle Recovery (SVR) Tracking Service Market Forecast (USD Billion), by Sub-Segment 2, 2018-2029
Figure 58: Europe Stolen Vehicle Recovery (SVR) Tracking Service Market Forecast (USD Billion), by Sub-Segment 3, 2018-2029
Figure 59: Europe Stolen Vehicle Recovery (SVR) Tracking Service Market Forecast (USD Billion), by Others, 2018-2029
Figure 60: Europe Stolen Vehicle Recovery (SVR) Tracking Service Market Forecast (USD Billion), by U.K., 2018-2029
Figure 61: Europe Stolen Vehicle Recovery (SVR) Tracking Service Market Forecast (USD Billion), by Germany, 2018-2029
Figure 62: Europe Stolen Vehicle Recovery (SVR) Tracking Service Market Forecast (USD Billion), by France, 2018-2029
Figure 63: Europe Stolen Vehicle Recovery (SVR) Tracking Service Market Forecast (USD Billion), by Italy, 2018-2029
Figure 64: Europe Stolen Vehicle Recovery (SVR) Tracking Service Market Forecast (USD Billion), by Spain, 2018-2029
Figure 65: Europe Stolen Vehicle Recovery (SVR) Tracking Service Market Forecast (USD Billion), by Russia, 2018-2029
Figure 66: Europe Stolen Vehicle Recovery (SVR) Tracking Service Market Forecast (USD Billion), by Rest of Europe, 2018-2029
Figure 67: Asia Pacific Stolen Vehicle Recovery (SVR) Tracking Service Market Value Share (%), By Segment 1, 2022 & 2029
Figure 68: Asia Pacific Stolen Vehicle Recovery (SVR) Tracking Service Market Forecast (USD Billion), by Sub-Segment 1, 2018-2029
Figure 69: Asia Pacific Stolen Vehicle Recovery (SVR) Tracking Service Market Forecast (USD Billion), by Sub-Segment 2, 2018-2029
Figure 70: Asia Pacific Stolen Vehicle Recovery (SVR) Tracking Service Market Value Share (%), By Segment 2, 2022 & 2029
Figure 71: Asia Pacific Stolen Vehicle Recovery (SVR) Tracking Service Market Forecast (USD Billion), by Sub-Segment 1, 2018-2029
Figure 72: Asia Pacific Stolen Vehicle Recovery (SVR) Tracking Service Market Forecast (USD Billion), by Sub-Segment 2, 2018-2029
Figure 73: Asia Pacific Stolen Vehicle Recovery (SVR) Tracking Service Market Forecast (USD Billion), by Sub-Segment 3, 2018-2029
Figure 74: Asia Pacific Stolen Vehicle Recovery (SVR) Tracking Service Market Forecast (USD Billion), by Others, 2018-2029
Figure 75: Asia Pacific Stolen Vehicle Recovery (SVR) Tracking Service Market Value Share (%), By Segment 3, 2022 & 2029
Figure 76: Asia Pacific Stolen Vehicle Recovery (SVR) Tracking Service Market Forecast (USD Billion), by Sub-Segment 1, 2018-2029
Figure 77: Asia Pacific Stolen Vehicle Recovery (SVR) Tracking Service Market Forecast (USD Billion), by Sub-Segment 2, 2018-2029
Figure 78: Asia Pacific Stolen Vehicle Recovery (SVR) Tracking Service Market Forecast (USD Billion), by Sub-Segment 3, 2018-2029
Figure 79: Asia Pacific Stolen Vehicle Recovery (SVR) Tracking Service Market Forecast (USD Billion), by Others, 2018-2029
Figure 80: Asia Pacific Stolen Vehicle Recovery (SVR) Tracking Service Market Forecast (USD Billion), by China, 2018-2029
Figure 81: Asia Pacific Stolen Vehicle Recovery (SVR) Tracking Service Market Forecast (USD Billion), by India, 2018-2029
Figure 82: Asia Pacific Stolen Vehicle Recovery (SVR) Tracking Service Market Forecast (USD Billion), by Japan, 2018-2029
Figure 83: Asia Pacific Stolen Vehicle Recovery (SVR) Tracking Service Market Forecast (USD Billion), by Australia, 2018-2029
Figure 84: Asia Pacific Stolen Vehicle Recovery (SVR) Tracking Service Market Forecast (USD Billion), by Southeast Asia, 2018-2029
Figure 85: Asia Pacific Stolen Vehicle Recovery (SVR) Tracking Service Market Forecast (USD Billion), by Rest of Asia Pacific, 2018-2029
Figure 86: Middle East & Africa Stolen Vehicle Recovery (SVR) Tracking Service Market Value Share (%), By Segment 1, 2022 & 2029
Figure 87: Middle East & Africa Stolen Vehicle Recovery (SVR) Tracking Service Market Forecast (USD Billion), by Sub-Segment 1, 2018-2029
Figure 88: Middle East & Africa Stolen Vehicle Recovery (SVR) Tracking Service Market Forecast (USD Billion), by Sub-Segment 2, 2018-2029
Figure 89: Middle East & Africa Stolen Vehicle Recovery (SVR) Tracking Service Market Value Share (%), By Segment 2, 2022 & 2029
Figure 90: Middle East & Africa Stolen Vehicle Recovery (SVR) Tracking Service Market Forecast (USD Billion), by Sub-Segment 1, 2018-2029
Figure 91: Middle East & Africa Stolen Vehicle Recovery (SVR) Tracking Service Market Forecast (USD Billion), by Sub-Segment 2, 2018-2029
Figure 92: Middle East & Africa Stolen Vehicle Recovery (SVR) Tracking Service Market Forecast (USD Billion), by Sub-Segment 3, 2018-2029
Figure 93: Middle East & Africa Stolen Vehicle Recovery (SVR) Tracking Service Market Forecast (USD Billion), by Others, 2018-2029
Figure 94: Middle East & Africa Stolen Vehicle Recovery (SVR) Tracking Service Market Value Share (%), By Segment 3, 2022 & 2029
Figure 95: Middle East & Africa Stolen Vehicle Recovery (SVR) Tracking Service Market Forecast (USD Billion), by Sub-Segment 1, 2018-2029
Figure 96: Middle East & Africa Stolen Vehicle Recovery (SVR) Tracking Service Market Forecast (USD Billion), by Sub-Segment 2, 2018-2029
Figure 97: Middle East & Africa Stolen Vehicle Recovery (SVR) Tracking Service Market Forecast (USD Billion), by Sub-Segment 3, 2018-2029
Figure 98: Middle East & Africa Stolen Vehicle Recovery (SVR) Tracking Service Market Forecast (USD Billion), by Others, 2018-2029
Figure 99: Middle East & Africa Stolen Vehicle Recovery (SVR) Tracking Service Market Forecast (USD Billion), by GCC, 2018-2029
Figure 100: Middle East & Africa Stolen Vehicle Recovery (SVR) Tracking Service Market Forecast (USD Billion), by South Africa, 2018-2029
Figure 101: Middle East & Africa Stolen Vehicle Recovery (SVR) Tracking Service Market Forecast (USD Billion), by Rest of Middle East & Africa, 2018-2029
List of Tables
Table 1: Global Stolen Vehicle Recovery (SVR) Tracking Service Market Revenue (USD Billion) Forecast, by Segment 1, 2018-2029
Table 2: Global Stolen Vehicle Recovery (SVR) Tracking Service Market Revenue (USD Billion) Forecast, by Segment 2, 2018-2029
Table 3: Global Stolen Vehicle Recovery (SVR) Tracking Service Market Revenue (USD Billion) Forecast, by Segment 3, 2018-2029
Table 4: Global Stolen Vehicle Recovery (SVR) Tracking Service Market Revenue (USD Billion) Forecast, by Region, 2018-2029
Table 5: North America Stolen Vehicle Recovery (SVR) Tracking Service Market Revenue (USD Billion) Forecast, by Segment 1, 2018-2029
Table 6: North America Stolen Vehicle Recovery (SVR) Tracking Service Market Revenue (USD Billion) Forecast, by Segment 2, 2018-2029
Table 7: North America Stolen Vehicle Recovery (SVR) Tracking Service Market Revenue (USD Billion) Forecast, by Segment 3, 2018-2029
Table 8: North America Stolen Vehicle Recovery (SVR) Tracking Service Market Revenue (USD Billion) Forecast, by Country, 2018-2029
Table 9: Europe Stolen Vehicle Recovery (SVR) Tracking Service Market Revenue (USD Billion) Forecast, by Segment 1, 2018-2029
Table 10: Europe Stolen Vehicle Recovery (SVR) Tracking Service Market Revenue (USD Billion) Forecast, by Segment 2, 2018-2029
Table 11: Europe Stolen Vehicle Recovery (SVR) Tracking Service Market Revenue (USD Billion) Forecast, by Segment 3, 2018-2029
Table 12: Europe Stolen Vehicle Recovery (SVR) Tracking Service Market Revenue (USD Billion) Forecast, by Country, 2018-2029
Table 13: Latin America Stolen Vehicle Recovery (SVR) Tracking Service Market Revenue (USD Billion) Forecast, by Segment 1, 2018-2029
Table 14: Latin America Stolen Vehicle Recovery (SVR) Tracking Service Market Revenue (USD Billion) Forecast, by Segment 2, 2018-2029
Table 15: Latin America Stolen Vehicle Recovery (SVR) Tracking Service Market Revenue (USD Billion) Forecast, by Segment 3, 2018-2029
Table 16: Latin America Stolen Vehicle Recovery (SVR) Tracking Service Market Revenue (USD Billion) Forecast, by Country, 2018-2029
Table 17: Asia Pacific Stolen Vehicle Recovery (SVR) Tracking Service Market Revenue (USD Billion) Forecast, by Segment 1, 2018-2029
Table 18: Asia Pacific Stolen Vehicle Recovery (SVR) Tracking Service Market Revenue (USD Billion) Forecast, by Segment 2, 2018-2029
Table 19: Asia Pacific Stolen Vehicle Recovery (SVR) Tracking Service Market Revenue (USD Billion) Forecast, by Segment 3, 2018-2029
Table 20: Asia Pacific Stolen Vehicle Recovery (SVR) Tracking Service Market Revenue (USD Billion) Forecast, by Country, 2018-2029
Table 21: Middle East & Africa Stolen Vehicle Recovery (SVR) Tracking Service Market Revenue (USD Billion) Forecast, by Segment 1, 2018-2029
Table 22: Middle East & Africa Stolen Vehicle Recovery (SVR) Tracking Service Market Revenue (USD Billion) Forecast, by Segment 2, 2018-2029
Table 23: Middle East & Africa Stolen Vehicle Recovery (SVR) Tracking Service Market Revenue (USD Billion) Forecast, by Segment 3, 2018-2029
Table 24: Middle East & Africa Stolen Vehicle Recovery (SVR) Tracking Service Market Revenue (USD Billion) Forecast, by Country, 2018-2029
Research Process
Data Library Research are conducted by industry experts who offer insight on
industry structure, market segmentations technology assessment and competitive landscape (CL), and penetration, as well as on emerging trends. Their analysis is based on primary interviews (~ 80%) and secondary research (~ 20%) as well as years of professional expertise in their respective industries. Adding to this, by analysing historical trends and current market positions, our analysts predict where the market will be headed for the next five years. Furthermore, the varying trends of segment & categories geographically presented are also studied and the estimated based on the primary & secondary research.
In this particular report from the supply side Data Library Research has conducted primary surveys (interviews) with the key level executives (VP, CEO’s, Marketing Director, Business Development Manager
and SOFT) of the companies that active & prominent as well as the midsized organization
FIGURE 1: DLR RESEARH PROCESS
![research-methodology1]()
Primary Research
Extensive primary research was conducted to gain a deeper insight of the market and industry performance. The analysis is based on both primary and secondary research as well as years of professional expertise in the respective industries.
In addition to analysing current and historical trends, our analysts predict where the market is headed over the next five years.
It varies by segment for these categories geographically presented in the list of market tables. Speaking about this particular report we have conducted primary surveys (interviews) with the key level executives (VP, CEO’s, Marketing Director, Business Development Manager and many more) of the major players active in the market.
Secondary Research
Secondary research was mainly used to collect and identify information useful for the extensive, technical, market-oriented, and Friend’s study of the Global Extra Neutral Alcohol. It was also used to obtain key information about major players, market classification and segmentation according to the industry trends, geographical markets, and developments related to the market and technology perspectives. For this study, analysts have gathered information from various credible sources, such as annual reports, sec filings, journals, white papers, SOFT presentations, and company web sites.
Market Size Estimation
Both, top-down and bottom-up approaches were used to estimate and validate the size of the Global market and to estimate the size of various other dependent submarkets in the overall Extra Neutral Alcohol. The key players in the market were identified through secondary research and their market contributions in the respective geographies were determined through primary and secondary research.
Forecast Model
![research-methodology2]()