Third-Party Oilfield Services Market Overview and Analysis
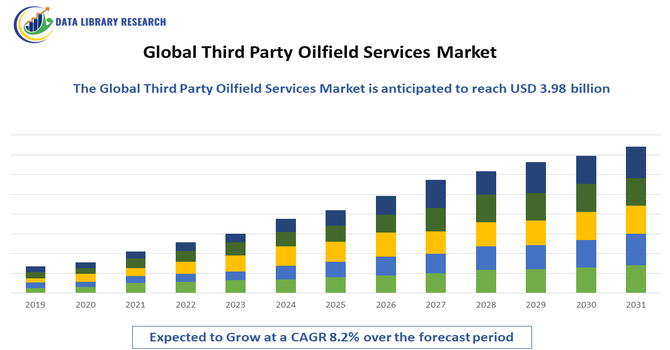
- The Global Third-Party Oilfield Services Market is projected to reach USD 3.98 billion by 2032, from USD 0.541 billion in 2025, exhibiting a strong Compound Annual Growth Rate (CAGR) of about 8.2% over the forecast period 2025-2031.
Get Complete Analysis Of The Report - Download Updated Free Sample PDF
The Global Third-Party Oilfield Services Market is witnessing significant growth, driven primarily by the increasing demand for efficient and cost-effective oil and gas exploration, drilling, and production activities. Oilfield operators are increasingly outsourcing specialized services—such as drilling, well testing, equipment maintenance, and reservoir management—to third-party service providers to optimize operational efficiency, reduce capital expenditure, and focus on core business functions.
Third Party Oilfield Services Market Latest Trends
The Global Third-Party Oilfield Services Market is increasingly shifting toward digitalization and automation, with service providers adopting advanced technologies such as IoT-enabled equipment, real-time monitoring, predictive maintenance, and cloud-based data analytics to optimize oilfield operations. There is a growing trend of integrated service offerings, where companies provide end-to-end solutions—from drilling and well completion to production optimization—allowing operators to reduce costs and improve efficiency. Additionally, environmentally sustainable practices are gaining prominence, with service providers focusing on reducing carbon emissions, minimizing water usage, and implementing green drilling techniques.
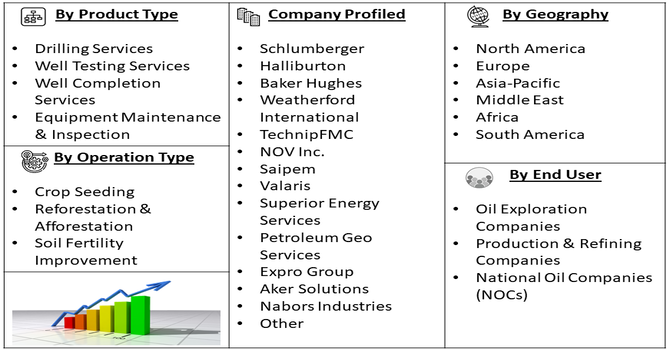
Segmentation: Global Third-Party Oilfield Services Market is segmented By Service Type (Drilling Services, Well Testing Services, Well Completion Services, Equipment Maintenance & Inspection), End User (Oil Exploration Companies, Production & Refining Companies, National Oil Companies (NOCs), Operation Type (Onshore Services, Offshore Services), and Geography (North America, Europe, Asia-Pacific, Middle East and Africa, and South America). The report provides the value (in USD million) for the above segments.
For Detailed Market Segmentation - Get a Free Sample PDF
Market Drivers:
- Increasing Global Energy Demand and Oilfield Exploration
The rising global energy demand, driven by economic growth, industrialization, and urbanization, is a primary driver for third-party oilfield services. As oil and gas companies seek to explore both conventional and unconventional reserves, they increasingly rely on specialized service providers to manage complex drilling, completion, and reservoir management tasks. Third-party service providers offer expertise, advanced technologies, and efficient project execution, enabling oilfield operators to optimize production and reduce operational risks. This trend is particularly prominent in regions with challenging terrains, deepwater reserves, and mature fields requiring enhanced oil recovery solutions.
- Cost Optimization and Outsourcing of Specialized Services
Oilfield operators are under constant pressure to reduce operational costs and improve efficiency. Outsourcing specialized tasks—such as drilling, well testing, equipment maintenance, and reservoir analysis—to third-party service providers allows companies to focus on core business activities while leveraging external expertise. This approach reduces capital expenditure, minimizes downtime, and provides access to advanced technologies without heavy investment in in-house infrastructure. Additionally, the shortage of skilled labor in certain regions makes outsourcing a practical and cost-effective solution, driving the adoption of third-party oilfield services globally.
Market Restraints:
- High Capital and Operational Costs for Service Providers
Third-party oilfield service providers face substantial capital and operational costs to maintain advanced drilling rigs, inspection equipment, and specialized technologies. Continuous investment is required for equipment upgrades, compliance with environmental and safety regulations, and training of skilled personnel. These high costs, coupled with project-specific risks such as harsh operating conditions and geopolitical instability in key oil-producing regions, can limit the expansion of service offerings and restrict market penetration, particularly in price-sensitive markets.
Socioeconomic Impact on Third-Party Oilfield Services Market
The global third-party oilfield services market has a wide-ranging socioeconomic impact by supporting energy production, creating jobs, and enabling technological progress in the oil and gas sector. These service providers help oil companies improve efficiency, maintain equipment, and reduce operational risks, which in turn supports stable energy supplies for industries and households. The market generates employment for engineers, technicians, logistics workers, and local communities, contributing to regional economic growth. It also encourages the adoption of safer and more environmentally responsible practices by offering advanced monitoring, maintenance, and inspection solutions. As a result, the industry not only strengthens energy security but also promotes skill development, innovation, and economic stability in oil-producing regions worldwide.
Segmental Analysis:
- Drilling Services segment is expected to witness the highest growth over the forecast period
Drilling services dominate the service type segment, as they are fundamental to oil and gas exploration and production activities. Third-party providers offer specialized drilling rigs, technical expertise, and project management solutions that allow operators to efficiently access both onshore and offshore reserves. Outsourcing drilling operations helps oil and gas companies reduce capital expenditure, improve operational efficiency, and minimize risks associated with complex drilling projects, particularly in deepwater and unconventional fields.
- Oil Exploration Companies segment is expected to witness the highest growth over the forecast period
Oil exploration companies are major consumers of third-party oilfield services, relying on external providers for specialized tasks such as seismic analysis, drilling, well testing, and reservoir evaluation. By outsourcing these services, exploration companies can leverage advanced technologies and expert personnel without heavy investment in in-house infrastructure, enabling faster project execution and reduced operational costs.
- Offshore Services segment is expected to witness the highest growth over the forecast period
Offshore services represent a critical segment, given the technical complexity and high costs associated with deepwater oil and gas projects. Third-party service providers deliver specialized offshore drilling, installation, and maintenance solutions, including floating platforms, subsea equipment, and well intervention technologies. These services ensure operational efficiency, safety, and compliance with environmental regulations, making them indispensable for offshore oilfield operations.
- North America segment is expected to witness the highest growth over the forecast period
North America is expected to lead the market geographically due to its mature oil and gas industry, technological advancements, and widespread adoption of outsourced services. The region benefits from extensive offshore and onshore oilfield operations, a strong presence of service providers, and supportive regulatory frameworks, driving high demand for third-party drilling, maintenance, and reservoir management solutions.
Additionally, North America continues to attract significant investment in oilfield modernization, further boosting the role of third-party service providers. Increased exploration activities in shale formations, along with the region’s focus on reducing operational risks and improving efficiency, have accelerated the adoption of advanced well intervention, inspection, and automation services. The presence of skilled labor, cutting-edge technologies, and strong collaboration between operators and service companies also contribute to market growth. As energy companies prioritize cost optimization and sustainability, third-party oilfield services play a key role in supporting safer, more reliable, and environmentally responsible operations across the United States and Canada.
| Report Matrics |
Details |
| Market Size Value |
USD 3.98 billion |
| Growth Rate |
CAGR of 8.2% |
| Forecast |
2026-2033 |
| Historical data |
2021-2024 |
| Base Year |
2025 |
| Report Coverage |
Forecasted revenue, company rating, competitive environment, growth drivers, and trends |
| Segment Coverage |
Type, Application, End-User, Geography |
| Regional Scope |
North America, Europe, Asia Pacific, Middle East |
| Customized scope |
Free customization of reports (With 3 months Analysis Support ) |
| To Learn More About This Report |
Request a Free Sample Copy |
Third Party Oilfield Services Market Competitive Landscape
The global Third Party Oilfield Services Market is intensely competitive, with a mix of large, diversified multinational firms and specialized regional players vying for contracts in drilling, completion, maintenance, and reservoir services. Major service providers differentiate themselves by offering integrated, full life cycle solutions — from seismic evaluation and drilling to well testing and production support — often backed by advanced technologies, digitalization, and strong safety and compliance track records. As energy companies increasingly outsource complex and capital-intensive operations, third party providers that can deliver operational efficiency, cost optimization, technological innovation, and rapid deployment across onshore and offshore projects hold a competitive edge. The market also sees strategic collaborations, mergers, and expansion into emerging markets as service providers strive to broaden geographic reach and enhance service portfolios.
Some of the key companies active in this market:
- Schlumberger
- Halliburton
- Baker Hughes
- Weatherford International
- TechnipFMC
- NOV Inc.
- Saipem
- Valaris
- Superior Energy Services
- Petroleum Geo Services
- Expro Group
- Aker Solutions
- Nabors Industries
- Oceaneering International
- McDermott International
- Subsea 7
- BJ Services Company
- Petrofac
- Fugro
- Ranger Energy Services
Recent Development
- In July 2025, Versalis transferred its Oilfield Chemicals business unit to the newly formed Versalis Oilfield Solutions S.r.l. consolidating its expertise in oilfield services. The move streamlined operations, strengthened R&D in advanced chemical formulations, and enhanced delivery of tailored products and technical support for drilling industry clients.
- In April 2024, Deep Well Services and CNX Resources formed a joint venture to launch AutoSep Technologies, a new oilfield service company delivering automated flowback solutions. Combining CNX’s technological strengths with DWS’s service expertise, AutoSep operated independently, offering improved efficiency and performance to the oil and gas industry through advanced, automated flowback operations.
Frequently Asked Questions (FAQ) :
Q1. What are the main growth-driving factors for this market?
The market is primarily driven by the need to optimize oil and gas production, especially from mature or complex wells. Companies increasingly outsource specialized tasks, such as advanced drilling and well completion, to third-party experts to reduce costs and leverage cutting-edge technologies like automation and digital oilfield solutions for greater efficiency.
Q2. What are the main restraining factors for this market?
Major restraints include the inherent volatility of global crude oil prices, which directly affects exploration and production spending by oil companies. Additionally, increasing environmental regulations and the global shift toward renewable energy sources create long-term uncertainty, limiting large-scale investment in oilfield service contracts.
Q3. Which segment is expected to witness high growth?
The Offshore segment is anticipated to witness significant growth, particularly in deepwater and ultra-deepwater exploration projects, where specialized services are essential. Furthermore, the Well Completion Equipment & Services segment is also projected for strong expansion due to the complexity of modern wells requiring enhanced recovery techniques.
Q4. Who are the top major players for this market?
The market is highly concentrated and dominated by global integrated service providers, often referred to as "the Big Three." These major players are Schlumberger (SLB), Halliburton, and Baker Hughes Company. Other key companies include Weatherford International and NOV (National Oilwell Varco), offering comprehensive service portfolios.
Q5. Which country is the largest player?
North America remains the largest regional market for third-party oilfield services, mainly due to the expansive oil and gas operations in the United States and Canada, particularly in unconventional resources like shale gas. The region's technological maturity and supportive regulatory environment sustain its market dominance.
List of Figures
Figure 1: Global Third Party Oilfield Services Market Revenue Breakdown (USD Billion, %) by Region, 2022 & 2029
Figure 2: Global Third Party Oilfield Services Market Value Share (%), By Segment 1, 2022 & 2029
Figure 3: Global Third Party Oilfield Services Market Forecast (USD Billion), by Sub-Segment 1, 2018-2029
Figure 4: Global Third Party Oilfield Services Market Forecast (USD Billion), by Sub-Segment 2, 2018-2029
Figure 5: Global Third Party Oilfield Services Market Value Share (%), By Segment 2, 2022 & 2029
Figure 6: Global Third Party Oilfield Services Market Forecast (USD Billion), by Sub-Segment 1, 2018-2029
Figure 7: Global Third Party Oilfield Services Market Forecast (USD Billion), by Sub-Segment 2, 2018-2029
Figure 8: Global Third Party Oilfield Services Market Forecast (USD Billion), by Sub-Segment 3, 2018-2029
Figure 9: Global Third Party Oilfield Services Market Forecast (USD Billion), by Others, 2018-2029
Figure 10: Global Third Party Oilfield Services Market Value Share (%), By Segment 3, 2022 & 2029
Figure 11: Global Third Party Oilfield Services Market Forecast (USD Billion), by Sub-Segment 1, 2018-2029
Figure 12: Global Third Party Oilfield Services Market Forecast (USD Billion), by Sub-Segment 2, 2018-2029
Figure 13: Global Third Party Oilfield Services Market Forecast (USD Billion), by Sub-Segment 3, 2018-2029
Figure 14: Global Third Party Oilfield Services Market Forecast (USD Billion), by Others, 2018-2029
Figure 15: Global Third Party Oilfield Services Market Value (USD Billion), by Region, 2022 & 2029
Figure 16: North America Third Party Oilfield Services Market Value Share (%), By Segment 1, 2022 & 2029
Figure 17: North America Third Party Oilfield Services Market Forecast (USD Billion), by Sub-Segment 1, 2018-2029
Figure 18: North America Third Party Oilfield Services Market Forecast (USD Billion), by Sub-Segment 2, 2018-2029
Figure 19: North America Third Party Oilfield Services Market Value Share (%), By Segment 2, 2022 & 2029
Figure 20: North America Third Party Oilfield Services Market Forecast (USD Billion), by Sub-Segment 1, 2018-2029
Figure 21: North America Third Party Oilfield Services Market Forecast (USD Billion), by Sub-Segment 2, 2018-2029
Figure 22: North America Third Party Oilfield Services Market Forecast (USD Billion), by Sub-Segment 3, 2018-2029
Figure 23: North America Third Party Oilfield Services Market Forecast (USD Billion), by Others, 2018-2029
Figure 24: North America Third Party Oilfield Services Market Value Share (%), By Segment 3, 2022 & 2029
Figure 25: North America Third Party Oilfield Services Market Forecast (USD Billion), by Sub-Segment 1, 2018-2029
Figure 26: North America Third Party Oilfield Services Market Forecast (USD Billion), by Sub-Segment 2, 2018-2029
Figure 27: North America Third Party Oilfield Services Market Forecast (USD Billion), by Sub-Segment 3, 2018-2029
Figure 28: North America Third Party Oilfield Services Market Forecast (USD Billion), by Others, 2018-2029
Figure 29: North America Third Party Oilfield Services Market Forecast (USD Billion), by U.S., 2018-2029
Figure 30: North America Third Party Oilfield Services Market Forecast (USD Billion), by Canada, 2018-2029
Figure 31: Latin America Third Party Oilfield Services Market Value Share (%), By Segment 1, 2022 & 2029
Figure 32: Latin America Third Party Oilfield Services Market Forecast (USD Billion), by Sub-Segment 1, 2018-2029
Figure 33: Latin America Third Party Oilfield Services Market Forecast (USD Billion), by Sub-Segment 2, 2018-2029
Figure 34: Latin America Third Party Oilfield Services Market Value Share (%), By Segment 2, 2022 & 2029
Figure 35: Latin America Third Party Oilfield Services Market Forecast (USD Billion), by Sub-Segment 1, 2018-2029
Figure 36: Latin America Third Party Oilfield Services Market Forecast (USD Billion), by Sub-Segment 2, 2018-2029
Figure 37: Latin America Third Party Oilfield Services Market Forecast (USD Billion), by Sub-Segment 3, 2018-2029
Figure 38: Latin America Third Party Oilfield Services Market Forecast (USD Billion), by Others, 2018-2029
Figure 39: Latin America Third Party Oilfield Services Market Value Share (%), By Segment 3, 2022 & 2029
Figure 40: Latin America Third Party Oilfield Services Market Forecast (USD Billion), by Sub-Segment 1, 2018-2029
Figure 41: Latin America Third Party Oilfield Services Market Forecast (USD Billion), by Sub-Segment 2, 2018-2029
Figure 42: Latin America Third Party Oilfield Services Market Forecast (USD Billion), by Sub-Segment 3, 2018-2029
Figure 43: Latin America Third Party Oilfield Services Market Forecast (USD Billion), by Others, 2018-2029
Figure 44: Latin America Third Party Oilfield Services Market Forecast (USD Billion), by Brazil, 2018-2029
Figure 45: Latin America Third Party Oilfield Services Market Forecast (USD Billion), by Mexico, 2018-2029
Figure 46: Latin America Third Party Oilfield Services Market Forecast (USD Billion), by Rest of Latin America, 2018-2029
Figure 47: Europe Third Party Oilfield Services Market Value Share (%), By Segment 1, 2022 & 2029
Figure 48: Europe Third Party Oilfield Services Market Forecast (USD Billion), by Sub-Segment 1, 2018-2029
Figure 49: Europe Third Party Oilfield Services Market Forecast (USD Billion), by Sub-Segment 2, 2018-2029
Figure 50: Europe Third Party Oilfield Services Market Value Share (%), By Segment 2, 2022 & 2029
Figure 51: Europe Third Party Oilfield Services Market Forecast (USD Billion), by Sub-Segment 1, 2018-2029
Figure 52: Europe Third Party Oilfield Services Market Forecast (USD Billion), by Sub-Segment 2, 2018-2029
Figure 53: Europe Third Party Oilfield Services Market Forecast (USD Billion), by Sub-Segment 3, 2018-2029
Figure 54: Europe Third Party Oilfield Services Market Forecast (USD Billion), by Others, 2018-2029
Figure 55: Europe Third Party Oilfield Services Market Value Share (%), By Segment 3, 2022 & 2029
Figure 56: Europe Third Party Oilfield Services Market Forecast (USD Billion), by Sub-Segment 1, 2018-2029
Figure 57: Europe Third Party Oilfield Services Market Forecast (USD Billion), by Sub-Segment 2, 2018-2029
Figure 58: Europe Third Party Oilfield Services Market Forecast (USD Billion), by Sub-Segment 3, 2018-2029
Figure 59: Europe Third Party Oilfield Services Market Forecast (USD Billion), by Others, 2018-2029
Figure 60: Europe Third Party Oilfield Services Market Forecast (USD Billion), by U.K., 2018-2029
Figure 61: Europe Third Party Oilfield Services Market Forecast (USD Billion), by Germany, 2018-2029
Figure 62: Europe Third Party Oilfield Services Market Forecast (USD Billion), by France, 2018-2029
Figure 63: Europe Third Party Oilfield Services Market Forecast (USD Billion), by Italy, 2018-2029
Figure 64: Europe Third Party Oilfield Services Market Forecast (USD Billion), by Spain, 2018-2029
Figure 65: Europe Third Party Oilfield Services Market Forecast (USD Billion), by Russia, 2018-2029
Figure 66: Europe Third Party Oilfield Services Market Forecast (USD Billion), by Rest of Europe, 2018-2029
Figure 67: Asia Pacific Third Party Oilfield Services Market Value Share (%), By Segment 1, 2022 & 2029
Figure 68: Asia Pacific Third Party Oilfield Services Market Forecast (USD Billion), by Sub-Segment 1, 2018-2029
Figure 69: Asia Pacific Third Party Oilfield Services Market Forecast (USD Billion), by Sub-Segment 2, 2018-2029
Figure 70: Asia Pacific Third Party Oilfield Services Market Value Share (%), By Segment 2, 2022 & 2029
Figure 71: Asia Pacific Third Party Oilfield Services Market Forecast (USD Billion), by Sub-Segment 1, 2018-2029
Figure 72: Asia Pacific Third Party Oilfield Services Market Forecast (USD Billion), by Sub-Segment 2, 2018-2029
Figure 73: Asia Pacific Third Party Oilfield Services Market Forecast (USD Billion), by Sub-Segment 3, 2018-2029
Figure 74: Asia Pacific Third Party Oilfield Services Market Forecast (USD Billion), by Others, 2018-2029
Figure 75: Asia Pacific Third Party Oilfield Services Market Value Share (%), By Segment 3, 2022 & 2029
Figure 76: Asia Pacific Third Party Oilfield Services Market Forecast (USD Billion), by Sub-Segment 1, 2018-2029
Figure 77: Asia Pacific Third Party Oilfield Services Market Forecast (USD Billion), by Sub-Segment 2, 2018-2029
Figure 78: Asia Pacific Third Party Oilfield Services Market Forecast (USD Billion), by Sub-Segment 3, 2018-2029
Figure 79: Asia Pacific Third Party Oilfield Services Market Forecast (USD Billion), by Others, 2018-2029
Figure 80: Asia Pacific Third Party Oilfield Services Market Forecast (USD Billion), by China, 2018-2029
Figure 81: Asia Pacific Third Party Oilfield Services Market Forecast (USD Billion), by India, 2018-2029
Figure 82: Asia Pacific Third Party Oilfield Services Market Forecast (USD Billion), by Japan, 2018-2029
Figure 83: Asia Pacific Third Party Oilfield Services Market Forecast (USD Billion), by Australia, 2018-2029
Figure 84: Asia Pacific Third Party Oilfield Services Market Forecast (USD Billion), by Southeast Asia, 2018-2029
Figure 85: Asia Pacific Third Party Oilfield Services Market Forecast (USD Billion), by Rest of Asia Pacific, 2018-2029
Figure 86: Middle East & Africa Third Party Oilfield Services Market Value Share (%), By Segment 1, 2022 & 2029
Figure 87: Middle East & Africa Third Party Oilfield Services Market Forecast (USD Billion), by Sub-Segment 1, 2018-2029
Figure 88: Middle East & Africa Third Party Oilfield Services Market Forecast (USD Billion), by Sub-Segment 2, 2018-2029
Figure 89: Middle East & Africa Third Party Oilfield Services Market Value Share (%), By Segment 2, 2022 & 2029
Figure 90: Middle East & Africa Third Party Oilfield Services Market Forecast (USD Billion), by Sub-Segment 1, 2018-2029
Figure 91: Middle East & Africa Third Party Oilfield Services Market Forecast (USD Billion), by Sub-Segment 2, 2018-2029
Figure 92: Middle East & Africa Third Party Oilfield Services Market Forecast (USD Billion), by Sub-Segment 3, 2018-2029
Figure 93: Middle East & Africa Third Party Oilfield Services Market Forecast (USD Billion), by Others, 2018-2029
Figure 94: Middle East & Africa Third Party Oilfield Services Market Value Share (%), By Segment 3, 2022 & 2029
Figure 95: Middle East & Africa Third Party Oilfield Services Market Forecast (USD Billion), by Sub-Segment 1, 2018-2029
Figure 96: Middle East & Africa Third Party Oilfield Services Market Forecast (USD Billion), by Sub-Segment 2, 2018-2029
Figure 97: Middle East & Africa Third Party Oilfield Services Market Forecast (USD Billion), by Sub-Segment 3, 2018-2029
Figure 98: Middle East & Africa Third Party Oilfield Services Market Forecast (USD Billion), by Others, 2018-2029
Figure 99: Middle East & Africa Third Party Oilfield Services Market Forecast (USD Billion), by GCC, 2018-2029
Figure 100: Middle East & Africa Third Party Oilfield Services Market Forecast (USD Billion), by South Africa, 2018-2029
Figure 101: Middle East & Africa Third Party Oilfield Services Market Forecast (USD Billion), by Rest of Middle East & Africa, 2018-2029
List of Tables
Table 1: Global Third Party Oilfield Services Market Revenue (USD Billion) Forecast, by Segment 1, 2018-2029
Table 2: Global Third Party Oilfield Services Market Revenue (USD Billion) Forecast, by Segment 2, 2018-2029
Table 3: Global Third Party Oilfield Services Market Revenue (USD Billion) Forecast, by Segment 3, 2018-2029
Table 4: Global Third Party Oilfield Services Market Revenue (USD Billion) Forecast, by Region, 2018-2029
Table 5: North America Third Party Oilfield Services Market Revenue (USD Billion) Forecast, by Segment 1, 2018-2029
Table 6: North America Third Party Oilfield Services Market Revenue (USD Billion) Forecast, by Segment 2, 2018-2029
Table 7: North America Third Party Oilfield Services Market Revenue (USD Billion) Forecast, by Segment 3, 2018-2029
Table 8: North America Third Party Oilfield Services Market Revenue (USD Billion) Forecast, by Country, 2018-2029
Table 9: Europe Third Party Oilfield Services Market Revenue (USD Billion) Forecast, by Segment 1, 2018-2029
Table 10: Europe Third Party Oilfield Services Market Revenue (USD Billion) Forecast, by Segment 2, 2018-2029
Table 11: Europe Third Party Oilfield Services Market Revenue (USD Billion) Forecast, by Segment 3, 2018-2029
Table 12: Europe Third Party Oilfield Services Market Revenue (USD Billion) Forecast, by Country, 2018-2029
Table 13: Latin America Third Party Oilfield Services Market Revenue (USD Billion) Forecast, by Segment 1, 2018-2029
Table 14: Latin America Third Party Oilfield Services Market Revenue (USD Billion) Forecast, by Segment 2, 2018-2029
Table 15: Latin America Third Party Oilfield Services Market Revenue (USD Billion) Forecast, by Segment 3, 2018-2029
Table 16: Latin America Third Party Oilfield Services Market Revenue (USD Billion) Forecast, by Country, 2018-2029
Table 17: Asia Pacific Third Party Oilfield Services Market Revenue (USD Billion) Forecast, by Segment 1, 2018-2029
Table 18: Asia Pacific Third Party Oilfield Services Market Revenue (USD Billion) Forecast, by Segment 2, 2018-2029
Table 19: Asia Pacific Third Party Oilfield Services Market Revenue (USD Billion) Forecast, by Segment 3, 2018-2029
Table 20: Asia Pacific Third Party Oilfield Services Market Revenue (USD Billion) Forecast, by Country, 2018-2029
Table 21: Middle East & Africa Third Party Oilfield Services Market Revenue (USD Billion) Forecast, by Segment 1, 2018-2029
Table 22: Middle East & Africa Third Party Oilfield Services Market Revenue (USD Billion) Forecast, by Segment 2, 2018-2029
Table 23: Middle East & Africa Third Party Oilfield Services Market Revenue (USD Billion) Forecast, by Segment 3, 2018-2029
Table 24: Middle East & Africa Third Party Oilfield Services Market Revenue (USD Billion) Forecast, by Country, 2018-2029
Research Process
Data Library Research are conducted by industry experts who offer insight on
industry structure, market segmentations technology assessment and competitive landscape (CL), and penetration, as well as on emerging trends. Their analysis is based on primary interviews (~ 80%) and secondary research (~ 20%) as well as years of professional expertise in their respective industries. Adding to this, by analysing historical trends and current market positions, our analysts predict where the market will be headed for the next five years. Furthermore, the varying trends of segment & categories geographically presented are also studied and the estimated based on the primary & secondary research.
In this particular report from the supply side Data Library Research has conducted primary surveys (interviews) with the key level executives (VP, CEO’s, Marketing Director, Business Development Manager
and SOFT) of the companies that active & prominent as well as the midsized organization
FIGURE 1: DLR RESEARH PROCESS
![research-methodology1]()
Primary Research
Extensive primary research was conducted to gain a deeper insight of the market and industry performance. The analysis is based on both primary and secondary research as well as years of professional expertise in the respective industries.
In addition to analysing current and historical trends, our analysts predict where the market is headed over the next five years.
It varies by segment for these categories geographically presented in the list of market tables. Speaking about this particular report we have conducted primary surveys (interviews) with the key level executives (VP, CEO’s, Marketing Director, Business Development Manager and many more) of the major players active in the market.
Secondary Research
Secondary research was mainly used to collect and identify information useful for the extensive, technical, market-oriented, and Friend’s study of the Global Extra Neutral Alcohol. It was also used to obtain key information about major players, market classification and segmentation according to the industry trends, geographical markets, and developments related to the market and technology perspectives. For this study, analysts have gathered information from various credible sources, such as annual reports, sec filings, journals, white papers, SOFT presentations, and company web sites.
Market Size Estimation
Both, top-down and bottom-up approaches were used to estimate and validate the size of the Global market and to estimate the size of various other dependent submarkets in the overall Extra Neutral Alcohol. The key players in the market were identified through secondary research and their market contributions in the respective geographies were determined through primary and secondary research.
Forecast Model
![research-methodology2]()