Three-in-One Temperature, Humidity and Pressure Sensor Market Overview and Analysis

  • The Global Three-in-One Temperature, Humidity, and Pressure Sensor Market is experiencing significant growth, with a 2025 estimated market size of around USD 1.76 billion and projections to reach USD 3.76 billion by 2032, driven by a projected Compound Annual Growth Rate (CAGR) of 8.2% from 2025-2032.

The Global Three-in-One Temperature, Humidity, and Pressure Sensor Market refers to the industry focused on the development, production, and deployment of integrated sensor solutions capable of simultaneously measuring environmental temperature, relative humidity, and atmospheric pressure. These compact, multi-functional sensors are increasingly used across consumer electronics, automotive, industrial automation, smart homes, healthcare, and environmental monitoring due to their space-saving design, energy efficiency, and cost-effectiveness. Market growth is driven by rising demand for real-time environmental data in IoT applications, wearable devices, and smart city infrastructure.

Three-in-One Temperature, Humidity and Pressure Sensor Market Latest Trends

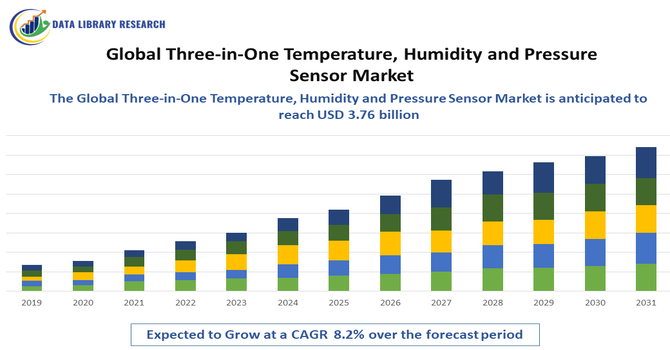
The Global Three-in-One Temperature, Humidity, and Pressure Sensor Market is experiencing rapid growth, driven by increasing demand for compact, energy-efficient, and multi-functional sensors in connected devices. A major trend is the integration of these sensors into consumer electronics such as smartphones, wearables, and smart home devices, enabling more accurate environmental monitoring and personalized user experiences. The rise of the Internet of Things (IoT) and Industry 4.0 is also propelling adoption in industrial automation, predictive maintenance, and HVAC systems. Additionally, advancements in MEMS technology are leading to smaller, more durable, and cost-effective sensors.

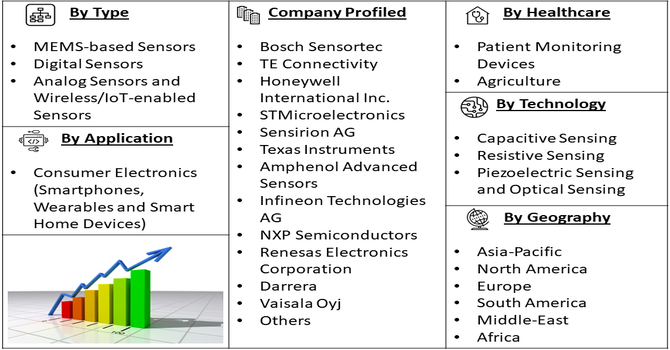
Segmentation: The Global Three-in-One Temperature, Humidity, and Pressure Sensor Market is Segmented by Sensor Type (MEMS-based Sensors, Digital Sensors, Analog Sensors and Wireless/IoT-enabled Sensors), Technology (Capacitive Sensing, Resistive Sensing, Piezoelectric Sensing and Optical Sensing), Application (Consumer Electronics (Smartphones, Wearables and Smart Home Devices), Automotive (Cabin Climate Control, Tire Pressure Monitoring and Engine Management Systems), Industrial Automation (HVAC Systems, Smart Manufacturing and Environmental Monitoring), Healthcare (Patient Monitoring Devices and Medical Equipment), Agriculture (Precision Farming and Greenhouse Management), and Weather Monitoring & Environmental Stations), Connectivity (Wired Sensors and Wireless Sensors (Bluetooth, ZigBee, LoRaWAN and Wi-Fi), End User (Residential, Commercial and Industrial), and Geography (North America, Europe, Asia-Pacific, Middle East and Africa, and South America). The report provides the value (in USD million) for the above segments.

Market Drivers:

  • Growing Demand for Smart and Connected Devices

The demand for smart and connected devices like smartphones, wearables, and smart home systems is growing fast around the world. These devices need accurate environmental sensing to adjust to their surroundings—for example, changing screen brightness or managing indoor climate. Three-in-one sensors, which measure temperature, humidity, and pressure all at once, are ideal for these applications because they save space and power. As more consumers and industries use smart technology, the need for compact, multi-functional sensors increases. Their ability to provide real-time, reliable environmental data makes them essential in the Internet of Things (IoT) ecosystem, driving steady market growth across sectors like electronics, automotive, and industrial automation.

  • Rising Adoption in Automotive and Industrial Applications

Automotive and industrial sectors are increasingly adopting advanced sensors to improve efficiency, safety, and automation. In vehicles, three-in-one sensors help manage climate control, monitor engine performance, and improve comfort. In factories and industrial plants, these sensors provide vital data for equipment performance, air quality, and process automation. Because they combine three important measurements in a single component, they reduce the need for multiple separate sensors, saving both space and cost. As the automotive industry shifts toward electric and smart vehicles, and industries embrace digital transformation and Industry 4.0, demand for integrated environmental sensors is expected to rise significantly over the coming years.

Market Restraints:

  • High Cost and Design Complexity

Despite their advantages, three-in-one sensors can be expensive to design and produce, especially when high accuracy and durability are required. Integrating temperature, humidity, and pressure sensing into one small chip while ensuring reliable performance takes advanced technology and manufacturing precision. This makes these sensors more costly than basic, single-function alternatives. For small companies or cost-sensitive applications, the higher price and complexity of integration into systems can be a barrier. Additionally, ensuring these sensors work accurately in extreme environments—such as in automotive engines or industrial plants—can add to development time and cost. These challenges can slow down adoption, especially in emerging markets or low-budget projects.

Socio Economic Impact on Three-in-One Temperature, Humidity and Pressure Sensor Market

The three-in-one sensor market has a notable socio-economic impact by enabling smarter, safer, and more efficient environments across sectors. In healthcare, these sensors improve patient monitoring systems and environmental control in hospitals. In agriculture, they support precision farming, enhancing crop yields and resource use. The affordability and scalability of these integrated sensors allow small and medium enterprises to adopt smart solutions previously limited to larger players, promoting economic inclusivity. On a broader scale, their role in energy-efficient HVAC systems and smart buildings contributes to sustainability and cost savings, aligning with global climate goals. Furthermore, as remote monitoring becomes vital in post-pandemic work and lifestyle models, these sensors enhance quality of life and operational resilience across homes and industries.

Segmental Analysis:

  • MEMS-based Sensors segment is expected to witness highest growth over the forecast period

The MEMS-based sensors segment is expected to witness the highest growth in the global three-in-one temperature, humidity, and pressure sensor market due to their small size, low power consumption, and cost-effectiveness. MEMS (Micro-Electro-Mechanical Systems) technology enables the integration of multiple sensing functions into a single chip, making these sensors ideal for compact and portable electronic devices. Their precision and reliability also make them suitable for industrial, automotive, and medical applications. With the growing demand for miniaturized, multifunctional components in smartphones, wearables, and IoT devices, MEMS-based sensors are rapidly gaining popularity. Continuous advancements in MEMS fabrication and packaging, along with increased production scalability, are expected to further accelerate their adoption across various sectors during the forecast period.

  • Capacitive Sensing segment is expected to witness highest growth over the forecast period

Capacitive sensing technology is expected to witness the fastest growth in the three-in-one sensor market due to its high accuracy, low power usage, and stable long-term performance. It is particularly effective for humidity and pressure detection, making it well-suited for integrated sensor applications across consumer electronics, automotive systems, and environmental monitoring. Capacitive sensors are also more resistant to temperature changes and contamination, which enhances their durability in challenging environments. As more industries shift towards reliable and low-maintenance solutions, capacitive sensing stands out as a preferred technology. Its ability to support compact designs without compromising measurement precision positions it as a key enabler in the development of smart devices and connected systems, fueling strong market growth in the coming years.

  • Smartphones segment is expected to witness highest growth over the forecast period

The smartphones segment is projected to experience the highest growth in the global three-in-one sensor market, driven by the increasing integration of environmental sensing features into mobile devices. Modern smartphones use temperature, humidity, and pressure sensors to enable features such as altitude tracking, indoor navigation, weather monitoring, and adaptive display settings. As smartphone brands compete to offer more advanced features, the demand for compact, multi-functional sensors continues to rise. Additionally, the shift toward 5G and AI-powered mobile applications is increasing the need for real-time environmental data. Consumers are also more health- and environment-conscious, further encouraging manufacturers to include these sensors. With billions of smartphones sold globally each year, this segment will remain a major driver of market expansion.

  • Commercial segment is expected to witness highest growth over the forecast period

The commercial segment is expected to see the fastest growth due to the rising use of smart building technologies, HVAC systems, and environmental control systems in offices, retail spaces, and public facilities. Businesses are increasingly adopting three-in-one sensors to monitor and optimize indoor air quality, energy usage, and environmental comfort. These sensors provide real-time data that helps reduce operational costs and improve occupant well-being, especially in the context of health-focused infrastructure after the COVID-19 pandemic. Additionally, regulatory requirements for energy efficiency and environmental monitoring in commercial buildings are accelerating sensor adoption. As more companies invest in digital transformation and smart facility management, the demand for integrated, multi-parameter environmental sensors in the commercial space is expected to grow rapidly.

  • Asia Pacific region is expected to witness highest growth over the forecast period

Asia Pacific is projected to be the fastest-growing region in the global three-in-one sensor market, fueled by rapid industrialization, strong growth in consumer electronics manufacturing, and increasing adoption of IoT devices. Countries like China, Japan, South Korea, and India are major hubs for electronics production and innovation, creating a high demand for compact, multi-functional sensors in smartphones, wearables, and home appliances. For instance, in April 2024, Sentinum, an IFM company, launched a new temperature and humidity sensor that operated with both Mioty and LoRa technologies, powered by Epishine’s highly efficient organic indoor solar cells. This collaboration marked a significant advancement in sensor technology, introducing maintenance-free, long-lasting sensors as replacements for traditional battery-powered devices. The innovation had a strong impact on the Asia Pacific region, where rising industrialization and smart infrastructure increased demand for energy-efficient, low-maintenance sensor solutions across manufacturing, agriculture, and smart buildings. Globally, it set a new benchmark for integrated environmental sensors, encouraging the adoption of solar-powered and wireless technologies. This development helped accelerate growth in the three-in-one temperature, humidity, and pressure sensor market by offering more reliable, eco-friendly options aligned with expanding IoT and Industry 4.0 applications.

Additionally, government initiatives supporting smart city development, environmental monitoring, and industrial automation are further boosting sensor deployment. The region also benefits from a large consumer base and expanding middle class, driving demand for smart devices and energy-efficient infrastructure. With rising investments in advanced manufacturing and sensor technology, Asia Pacific is set to lead global market growth in the coming years.

Three-in-One Temperature, Humidity and Pressure Sensor Market Competitive Landscape

The competitive landscape of the Global Three-in-One Temperature, Humidity, and Pressure Sensor Market is characterized by intense innovation and strategic expansion by leading technology firms. Major players such as Bosch Sensortec, Sensirion, STMicroelectronics, Texas Instruments, and TE Connectivity dominate the market with a strong portfolio of MEMS-based sensors. These companies invest heavily in R&D to improve sensor precision, power efficiency, and miniaturization, while ensuring seamless integration into IoT and edge computing platforms. Startups and niche manufacturers are also entering the space, targeting specialized applications in wearables, automotive, and industrial automation. Mergers, partnerships, and OEM collaborations are common as companies aim to expand their market reach. Regional manufacturers in Asia-Pacific are also gaining traction due to cost-effective production and growing local demand.

The 20 major players for above market are:

  • Bosch Sensortec
  • TE Connectivity
  • Honeywell International Inc.
  • STMicroelectronics
  • Sensirion AG
  • Texas Instruments
  • Amphenol Advanced Sensors
  • Infineon Technologies AG
  • NXP Semiconductors
  • Renesas Electronics Corporation
  • BME (Bosch Measurement Equipment)
  • Darrera
  • Vaisala Oyj
  • Rika Sensors (Hunan Rika Electronic Tech Co., Ltd.)
  • ZATA
  • Met One Instruments
  • Dyacon Inc.
  • Setra Systems Inc.
  • Endress+Hauser Group
  • Kistler Group

Recent Development

  • In April 2025, Sensor manufacturers are focusing on developing small digital humidity sensors capable of simultaneously detecting pressure and temperature. Innovations in new materials, such as polymer composites and graphene, are enhancing sensor stability and sensitivity over time. In sectors like cold chain logistics, wireless, battery-free humidity sensors leveraging NFC and energy harvesting technologies are gaining popularity. These advancements are also enabling smarter wearables and medical devices with built-in humidity sensing capabilities, expanding the scope and functionality of connected health and monitoring solutions.


  • In March 2025, The humidity sensor market is gradually expanding, driven by rising demand from industrial automation, smart home systems, and automotive climate control applications. These sensors play a vital role in ensuring safety, energy efficiency, and maintaining air quality. Rapid growth is particularly evident in consumer electronics, HVAC systems, and agriculture, where real-time environmental monitoring is critical. Advances in embedded systems and the Internet of Things have led to greater integration of small, low-power humidity sensors into connected devices, fueling market expansion and innovation.


Frequently Asked Questions (FAQ) :

Q1. What the main growth driving factors for this market?

The market is primarily driven by the proliferation of the Internet of Things (IoT) and the push towards Industry 4.0, which mandates accurate, real-time environmental data for automation, smart systems, and predictive maintenance. Increasing demand from the automotive sector for advanced in-vehicle environmental monitoring, and the rising adoption in smart buildings/HVAC systems for energy efficiency and occupant comfort, are significant contributors. Furthermore, continuous technological advancements result in smaller, more energy-efficient, and cost-effective multi-functional sensors.

Q2. What are the main restraining factors for this market?

Key restraining factors include the high initial investment cost, especially for integrating advanced and highly accurate sensor systems into legacy equipment or smaller applications. Technical challenges such as the requirement for complex calibration and maintenance procedures to ensure long-term reliability and accuracy can hinder wider adoption. Additionally, the risk of sensor drift and vulnerability to external contaminants can compromise data integrity, necessitating protective measures and regular replacements.

Q3. Which segment is expected to witness high growth?

The Industrial Automation and Automotive segments are expected to witness high growth. Industrial automation is rapidly adopting these integrated sensors for process control, predictive maintenance (Industry 4.0), and environmental monitoring in manufacturing facilities. In the automotive sector, their use in electric vehicle battery management, cabin climate control, and advanced driver-assistance systems (ADAS) is fueling substantial demand, driven by stringent safety regulations and electrification trends.

Q4. Who are the top major players for this market?

Top major players in the broader market for combined and individual temperature, humidity, and pressure sensors include established global technology and industrial companies. Key players often cited are Bosch Sensortec GmbH, Honeywell International Inc., TE Connectivity, Infineon Technologies AG, NXP Semiconductors, Amphenol Corporation, Sensata Technologies, Inc., and STMicroelectronics. These companies compete through product miniaturization, integration capabilities, and developing highly accurate, reliable, and low-power multi-sensor solutions for diverse industries.

Q5. Which country is the largest player?

Asia-Pacific region, particularly China, is generally cited as the largest market player, holding the dominant revenue share. This is attributed to the region's massive manufacturing base for consumer electronics and automotive components, rapid industrialization, and significant investments in smart city and IoT infrastructure. North America and Europe also hold substantial market shares due to high technological adoption and the presence of major industry players.

Three-in-One Temperature, Humidity and Pressure Sensor MARKET STUDY GLOBAL MARKET ANALYSIS, INSIGHTS AND FORECAST, 2022-2029

    1. Introduction

    • 1.1. Research Scope
    • 1.2. Market Segmentation
    • 1.3. Research Methodology
    • 1.4. Definitions and Assumptions

    2. Executive Summary

      3. Market Dynamics

      • 3.1. Market Drivers
      • 3.2. Market Restraints
      • 3.3. Market Opportunities

      4. Key Insights

      • 4.1. Key Emerging Trends – For Major Countries
      • 4.2. Latest Technological Advancement
      • 4.3. Regulatory Landscape
      • 4.4. Industry SWOT Analysis
      • 4.5. Porters Five Forces Analysis

      5. Global Three-in-One Temperature, Humidity and Pressure Sensor Market Analysis (USD Billion), Insights and Forecast, 2018-2029

      • 5.1. Key Findings / Summary
      • 5.2. Market Analysis, Insights and Forecast – By Segment 1
        • 5.2.1. Sub-Segment 1
        • 5.2.2. Sub-Segment 2
      • 5.3. Market Analysis, Insights and Forecast – By Segment 2
        • 5.3.1. Sub-Segment 1
        • 5.3.2. Sub-Segment 2
        • 5.3.3. Sub-Segment 3
        • 5.3.4. Others
      • 5.4. Market Analysis, Insights and Forecast – By Segment 3
        • 5.4.1. Sub-Segment 1
        • 5.4.2. Sub-Segment 2
        • 5.4.3. Sub-Segment 3
        • 5.4.4. Others
      • 5.5. Market Analysis, Insights and Forecast – By Region
        • 5.5.1. North America
        • 5.5.2. Latin America
        • 5.5.3. Europe
        • 5.5.4. Asia Pacific
        • 5.5.5. Middle East and Africa

      6. North America Three-in-One Temperature, Humidity and Pressure Sensor Market Analysis (USD Billion), Insights and Forecast, 2018-2029

      • 6.1. Key Findings / Summary
      • 6.2. Market Analysis, Insights and Forecast – By Segment 1
        • 6.2.1. Sub-Segment 1
        • 6.2.2. Sub-Segment 2
      • 6.3. Market Analysis, Insights and Forecast – By Segment 2
        • 6.3.1. Sub-Segment 1
        • 6.3.2. Sub-Segment 2
        • 6.3.3. Sub-Segment 3
        • 6.3.4. Others
      • 6.4. Market Analysis, Insights and Forecast – By Segment 3
        • 6.4.1. Sub-Segment 1
        • 6.4.2. Sub-Segment 2
        • 6.4.3. Sub-Segment 3
        • 6.4.4. Others
      • 6.5. Market Analysis, Insights and Forecast – By Country
        • 6.5.1. U.S.
        • 6.5.2. Canada

      7. Latin America Three-in-One Temperature, Humidity and Pressure Sensor Market Analysis (USD Billion), Insights and Forecast, 2018-2029

      • 7.1. Key Findings / Summary
      • 7.2. Market Analysis, Insights and Forecast – By Segment 1
        • 7.2.1. Sub-Segment 1
        • 7.2.2. Sub-Segment 2
      • 7.3. Market Analysis, Insights and Forecast – By Segment 2
        • 7.3.1. Sub-Segment 1
        • 7.3.2. Sub-Segment 2
        • 7.3.3. Sub-Segment 3
        • 7.3.4. Others
      • 7.4. Market Analysis, Insights and Forecast – By Segment 3
        • 7.4.1. Sub-Segment 1
        • 7.4.2. Sub-Segment 2
        • 7.4.3. Sub-Segment 3
        • 7.4.4. Others
      • 7.5. Insights and Forecast – By Country
        • 7.5.1. Brazil
        • 7.5.2. Mexico
        • 7.5.3. Rest of Latin America

      8. Europe Three-in-One Temperature, Humidity and Pressure Sensor Market Analysis (USD Billion), Insights and Forecast, 2018-2029

      • 8.1. Key Findings / Summary
      • 8.2. Market Analysis, Insights and Forecast – By Segment 1
        • 8.2.1. Sub-Segment 1
        • 8.2.2. Sub-Segment 2
      • 8.3. Market Analysis, Insights and Forecast – By Segment 2
        • 8.3.1. Sub-Segment 1
        • 8.3.2. Sub-Segment 2
        • 8.3.3. Sub-Segment 3
        • 8.3.4. Others
      • 8.4. Market Analysis, Insights and Forecast – By Segment 3
        • 8.4.1. Sub-Segment 1
        • 8.4.2. Sub-Segment 2
        • 8.4.3. Sub-Segment 3
        • 8.4.4. Others
      • 8.5. Market Analysis, Insights and Forecast – By Country
        • 8.5.1. UK
        • 8.5.2. Germany
        • 8.5.3. France
        • 8.5.4. Italy
        • 8.5.5. Spain
        • 8.5.6. Russia
        • 8.5.7. Rest of Europe

      9. Asia Pacific Three-in-One Temperature, Humidity and Pressure Sensor Market Analysis (USD Billion), Insights and Forecast, 2018-2029

      • 9.1. Key Findings / Summary
      • 9.2. Market Analysis, Insights and Forecast – By Segment 1
        • 9.2.1. Sub-Segment 1
        • 9.2.2. Sub-Segment 2
      • 9.3. Market Analysis, Insights and Forecast – By Segment 2
        • 9.3.1. Sub-Segment 1
        • 9.3.2. Sub-Segment 2
        • 9.3.3. Sub-Segment 3
        • 9.3.4. Others
      • 9.4. Market Analysis, Insights and Forecast – By Segment 3
        • 9.4.1. Sub-Segment 1
        • 9.4.2. Sub-Segment 2
        • 9.4.3. Sub-Segment 3
        • 9.4.4. Others
      • 9.5. Market Analysis, Insights and Forecast – By Country
        • 9.5.1. China
        • 9.5.2. India
        • 9.5.3. Japan
        • 9.5.4. Australia
        • 9.5.5. South East Asia
        • 9.5.6. Rest of Asia Pacific

      10. Middle East & Africa Three-in-One Temperature, Humidity and Pressure Sensor Market Analysis (USD Billion), Insights and Forecast, 2018-2029

      • 10.1. Key Findings / Summary
      • 10.2. Market Analysis, Insights and Forecast – By Segment 1
        • 10.2.1. Sub-Segment 1
        • 10.2.2. Sub-Segment 2
      • 10.3. Market Analysis, Insights and Forecast – By Segment 2
        • 10.3.1. Sub-Segment 1
        • 10.3.2. Sub-Segment 2
        • 10.3.3. Sub-Segment 3
        • 10.3.4. Others
      • 10.4. Market Analysis, Insights and Forecast – By Segment 3
        • 10.4.1. Sub-Segment 1
        • 10.4.2. Sub-Segment 2
        • 10.4.3. Sub-Segment 3
        • 10.4.4. Others
      • 10.5. Market Analysis, Insights and Forecast – By Country
        • 10.5.1. GCC
        • 10.5.2. South Africa
        • 10.5.3. Rest of Middle East & Africa

      11. Competitive Analysis

      • 11.1. Company Market Share Analysis, 2018
      • 11.2. Key Industry Developments
      • 11.3. Company Profile
        • 11.3.1. Company 1
          • 11.3.1.1. Business Overview
          • 11.3.1.2. Segment 1 & Service Offering
          • 11.3.1.3. Overall Revenue
          • 11.3.1.4. Geographic Presence
          • 11.3.1.5. Recent Development
        *Similar details will be provided for the following companies
        • 11.3.2. Company 2
        • 11.3.3. Company 3
        • 11.3.4. Company 4
        • 11.3.5. Company 5
        • 11.3.6. Company 6
        • 11.3.7. Company 7
        • 11.3.8. Company 8
        • 11.3.9. Company 9
        • 11.3.10. Company 10
        • 11.3.11. Company 11
        • 11.3.12. Company 12
      List of Figures

      Figure 1: Global Three-in-One Temperature, Humidity and Pressure Sensor Market Revenue Breakdown (USD Billion, %) by Region, 2022 & 2029
      Figure 2: Global Three-in-One Temperature, Humidity and Pressure Sensor Market Value Share (%), By Segment 1, 2022 & 2029
      Figure 3: Global Three-in-One Temperature, Humidity and Pressure Sensor Market Forecast (USD Billion), by Sub-Segment 1, 2018-2029
      Figure 4: Global Three-in-One Temperature, Humidity and Pressure Sensor Market Forecast (USD Billion), by Sub-Segment 2, 2018-2029
      Figure 5: Global Three-in-One Temperature, Humidity and Pressure Sensor Market Value Share (%), By Segment 2, 2022 & 2029
      Figure 6: Global Three-in-One Temperature, Humidity and Pressure Sensor Market Forecast (USD Billion), by Sub-Segment 1, 2018-2029
      Figure 7: Global Three-in-One Temperature, Humidity and Pressure Sensor Market Forecast (USD Billion), by Sub-Segment 2, 2018-2029
      Figure 8: Global Three-in-One Temperature, Humidity and Pressure Sensor Market Forecast (USD Billion), by Sub-Segment 3, 2018-2029
      Figure 9: Global Three-in-One Temperature, Humidity and Pressure Sensor Market Forecast (USD Billion), by Others, 2018-2029
      Figure 10: Global Three-in-One Temperature, Humidity and Pressure Sensor Market Value Share (%), By Segment 3, 2022 & 2029
      Figure 11: Global Three-in-One Temperature, Humidity and Pressure Sensor Market Forecast (USD Billion), by Sub-Segment 1, 2018-2029
      Figure 12: Global Three-in-One Temperature, Humidity and Pressure Sensor Market Forecast (USD Billion), by Sub-Segment 2, 2018-2029
      Figure 13: Global Three-in-One Temperature, Humidity and Pressure Sensor Market Forecast (USD Billion), by Sub-Segment 3, 2018-2029
      Figure 14: Global Three-in-One Temperature, Humidity and Pressure Sensor Market Forecast (USD Billion), by Others, 2018-2029
      Figure 15: Global Three-in-One Temperature, Humidity and Pressure Sensor Market Value (USD Billion), by Region, 2022 & 2029
      Figure 16: North America Three-in-One Temperature, Humidity and Pressure Sensor Market Value Share (%), By Segment 1, 2022 & 2029
      Figure 17: North America Three-in-One Temperature, Humidity and Pressure Sensor Market Forecast (USD Billion), by Sub-Segment 1, 2018-2029
      Figure 18: North America Three-in-One Temperature, Humidity and Pressure Sensor Market Forecast (USD Billion), by Sub-Segment 2, 2018-2029
      Figure 19: North America Three-in-One Temperature, Humidity and Pressure Sensor Market Value Share (%), By Segment 2, 2022 & 2029
      Figure 20: North America Three-in-One Temperature, Humidity and Pressure Sensor Market Forecast (USD Billion), by Sub-Segment 1, 2018-2029
      Figure 21: North America Three-in-One Temperature, Humidity and Pressure Sensor Market Forecast (USD Billion), by Sub-Segment 2, 2018-2029
      Figure 22: North America Three-in-One Temperature, Humidity and Pressure Sensor Market Forecast (USD Billion), by Sub-Segment 3, 2018-2029
      Figure 23: North America Three-in-One Temperature, Humidity and Pressure Sensor Market Forecast (USD Billion), by Others, 2018-2029
      Figure 24: North America Three-in-One Temperature, Humidity and Pressure Sensor Market Value Share (%), By Segment 3, 2022 & 2029
      Figure 25: North America Three-in-One Temperature, Humidity and Pressure Sensor Market Forecast (USD Billion), by Sub-Segment 1, 2018-2029
      Figure 26: North America Three-in-One Temperature, Humidity and Pressure Sensor Market Forecast (USD Billion), by Sub-Segment 2, 2018-2029
      Figure 27: North America Three-in-One Temperature, Humidity and Pressure Sensor Market Forecast (USD Billion), by Sub-Segment 3, 2018-2029
      Figure 28: North America Three-in-One Temperature, Humidity and Pressure Sensor Market Forecast (USD Billion), by Others, 2018-2029
      Figure 29: North America Three-in-One Temperature, Humidity and Pressure Sensor Market Forecast (USD Billion), by U.S., 2018-2029
      Figure 30: North America Three-in-One Temperature, Humidity and Pressure Sensor Market Forecast (USD Billion), by Canada, 2018-2029
      Figure 31: Latin America Three-in-One Temperature, Humidity and Pressure Sensor Market Value Share (%), By Segment 1, 2022 & 2029
      Figure 32: Latin America Three-in-One Temperature, Humidity and Pressure Sensor Market Forecast (USD Billion), by Sub-Segment 1, 2018-2029
      Figure 33: Latin America Three-in-One Temperature, Humidity and Pressure Sensor Market Forecast (USD Billion), by Sub-Segment 2, 2018-2029
      Figure 34: Latin America Three-in-One Temperature, Humidity and Pressure Sensor Market Value Share (%), By Segment 2, 2022 & 2029
      Figure 35: Latin America Three-in-One Temperature, Humidity and Pressure Sensor Market Forecast (USD Billion), by Sub-Segment 1, 2018-2029
      Figure 36: Latin America Three-in-One Temperature, Humidity and Pressure Sensor Market Forecast (USD Billion), by Sub-Segment 2, 2018-2029
      Figure 37: Latin America Three-in-One Temperature, Humidity and Pressure Sensor Market Forecast (USD Billion), by Sub-Segment 3, 2018-2029
      Figure 38: Latin America Three-in-One Temperature, Humidity and Pressure Sensor Market Forecast (USD Billion), by Others, 2018-2029
      Figure 39: Latin America Three-in-One Temperature, Humidity and Pressure Sensor Market Value Share (%), By Segment 3, 2022 & 2029
      Figure 40: Latin America Three-in-One Temperature, Humidity and Pressure Sensor Market Forecast (USD Billion), by Sub-Segment 1, 2018-2029
      Figure 41: Latin America Three-in-One Temperature, Humidity and Pressure Sensor Market Forecast (USD Billion), by Sub-Segment 2, 2018-2029
      Figure 42: Latin America Three-in-One Temperature, Humidity and Pressure Sensor Market Forecast (USD Billion), by Sub-Segment 3, 2018-2029
      Figure 43: Latin America Three-in-One Temperature, Humidity and Pressure Sensor Market Forecast (USD Billion), by Others, 2018-2029
      Figure 44: Latin America Three-in-One Temperature, Humidity and Pressure Sensor Market Forecast (USD Billion), by Brazil, 2018-2029
      Figure 45: Latin America Three-in-One Temperature, Humidity and Pressure Sensor Market Forecast (USD Billion), by Mexico, 2018-2029
      Figure 46: Latin America Three-in-One Temperature, Humidity and Pressure Sensor Market Forecast (USD Billion), by Rest of Latin America, 2018-2029
      Figure 47: Europe Three-in-One Temperature, Humidity and Pressure Sensor Market Value Share (%), By Segment 1, 2022 & 2029
      Figure 48: Europe Three-in-One Temperature, Humidity and Pressure Sensor Market Forecast (USD Billion), by Sub-Segment 1, 2018-2029
      Figure 49: Europe Three-in-One Temperature, Humidity and Pressure Sensor Market Forecast (USD Billion), by Sub-Segment 2, 2018-2029
      Figure 50: Europe Three-in-One Temperature, Humidity and Pressure Sensor Market Value Share (%), By Segment 2, 2022 & 2029
      Figure 51: Europe Three-in-One Temperature, Humidity and Pressure Sensor Market Forecast (USD Billion), by Sub-Segment 1, 2018-2029
      Figure 52: Europe Three-in-One Temperature, Humidity and Pressure Sensor Market Forecast (USD Billion), by Sub-Segment 2, 2018-2029
      Figure 53: Europe Three-in-One Temperature, Humidity and Pressure Sensor Market Forecast (USD Billion), by Sub-Segment 3, 2018-2029
      Figure 54: Europe Three-in-One Temperature, Humidity and Pressure Sensor Market Forecast (USD Billion), by Others, 2018-2029
      Figure 55: Europe Three-in-One Temperature, Humidity and Pressure Sensor Market Value Share (%), By Segment 3, 2022 & 2029
      Figure 56: Europe Three-in-One Temperature, Humidity and Pressure Sensor Market Forecast (USD Billion), by Sub-Segment 1, 2018-2029
      Figure 57: Europe Three-in-One Temperature, Humidity and Pressure Sensor Market Forecast (USD Billion), by Sub-Segment 2, 2018-2029
      Figure 58: Europe Three-in-One Temperature, Humidity and Pressure Sensor Market Forecast (USD Billion), by Sub-Segment 3, 2018-2029
      Figure 59: Europe Three-in-One Temperature, Humidity and Pressure Sensor Market Forecast (USD Billion), by Others, 2018-2029
      Figure 60: Europe Three-in-One Temperature, Humidity and Pressure Sensor Market Forecast (USD Billion), by U.K., 2018-2029
      Figure 61: Europe Three-in-One Temperature, Humidity and Pressure Sensor Market Forecast (USD Billion), by Germany, 2018-2029
      Figure 62: Europe Three-in-One Temperature, Humidity and Pressure Sensor Market Forecast (USD Billion), by France, 2018-2029
      Figure 63: Europe Three-in-One Temperature, Humidity and Pressure Sensor Market Forecast (USD Billion), by Italy, 2018-2029
      Figure 64: Europe Three-in-One Temperature, Humidity and Pressure Sensor Market Forecast (USD Billion), by Spain, 2018-2029
      Figure 65: Europe Three-in-One Temperature, Humidity and Pressure Sensor Market Forecast (USD Billion), by Russia, 2018-2029
      Figure 66: Europe Three-in-One Temperature, Humidity and Pressure Sensor Market Forecast (USD Billion), by Rest of Europe, 2018-2029
      Figure 67: Asia Pacific Three-in-One Temperature, Humidity and Pressure Sensor Market Value Share (%), By Segment 1, 2022 & 2029
      Figure 68: Asia Pacific Three-in-One Temperature, Humidity and Pressure Sensor Market Forecast (USD Billion), by Sub-Segment 1, 2018-2029
      Figure 69: Asia Pacific Three-in-One Temperature, Humidity and Pressure Sensor Market Forecast (USD Billion), by Sub-Segment 2, 2018-2029
      Figure 70: Asia Pacific Three-in-One Temperature, Humidity and Pressure Sensor Market Value Share (%), By Segment 2, 2022 & 2029
      Figure 71: Asia Pacific Three-in-One Temperature, Humidity and Pressure Sensor Market Forecast (USD Billion), by Sub-Segment 1, 2018-2029
      Figure 72: Asia Pacific Three-in-One Temperature, Humidity and Pressure Sensor Market Forecast (USD Billion), by Sub-Segment 2, 2018-2029
      Figure 73: Asia Pacific Three-in-One Temperature, Humidity and Pressure Sensor Market Forecast (USD Billion), by Sub-Segment 3, 2018-2029
      Figure 74: Asia Pacific Three-in-One Temperature, Humidity and Pressure Sensor Market Forecast (USD Billion), by Others, 2018-2029
      Figure 75: Asia Pacific Three-in-One Temperature, Humidity and Pressure Sensor Market Value Share (%), By Segment 3, 2022 & 2029
      Figure 76: Asia Pacific Three-in-One Temperature, Humidity and Pressure Sensor Market Forecast (USD Billion), by Sub-Segment 1, 2018-2029
      Figure 77: Asia Pacific Three-in-One Temperature, Humidity and Pressure Sensor Market Forecast (USD Billion), by Sub-Segment 2, 2018-2029
      Figure 78: Asia Pacific Three-in-One Temperature, Humidity and Pressure Sensor Market Forecast (USD Billion), by Sub-Segment 3, 2018-2029
      Figure 79: Asia Pacific Three-in-One Temperature, Humidity and Pressure Sensor Market Forecast (USD Billion), by Others, 2018-2029
      Figure 80: Asia Pacific Three-in-One Temperature, Humidity and Pressure Sensor Market Forecast (USD Billion), by China, 2018-2029
      Figure 81: Asia Pacific Three-in-One Temperature, Humidity and Pressure Sensor Market Forecast (USD Billion), by India, 2018-2029
      Figure 82: Asia Pacific Three-in-One Temperature, Humidity and Pressure Sensor Market Forecast (USD Billion), by Japan, 2018-2029
      Figure 83: Asia Pacific Three-in-One Temperature, Humidity and Pressure Sensor Market Forecast (USD Billion), by Australia, 2018-2029
      Figure 84: Asia Pacific Three-in-One Temperature, Humidity and Pressure Sensor Market Forecast (USD Billion), by Southeast Asia, 2018-2029
      Figure 85: Asia Pacific Three-in-One Temperature, Humidity and Pressure Sensor Market Forecast (USD Billion), by Rest of Asia Pacific, 2018-2029
      Figure 86: Middle East & Africa Three-in-One Temperature, Humidity and Pressure Sensor Market Value Share (%), By Segment 1, 2022 & 2029
      Figure 87: Middle East & Africa Three-in-One Temperature, Humidity and Pressure Sensor Market Forecast (USD Billion), by Sub-Segment 1, 2018-2029
      Figure 88: Middle East & Africa Three-in-One Temperature, Humidity and Pressure Sensor Market Forecast (USD Billion), by Sub-Segment 2, 2018-2029
      Figure 89: Middle East & Africa Three-in-One Temperature, Humidity and Pressure Sensor Market Value Share (%), By Segment 2, 2022 & 2029
      Figure 90: Middle East & Africa Three-in-One Temperature, Humidity and Pressure Sensor Market Forecast (USD Billion), by Sub-Segment 1, 2018-2029
      Figure 91: Middle East & Africa Three-in-One Temperature, Humidity and Pressure Sensor Market Forecast (USD Billion), by Sub-Segment 2, 2018-2029
      Figure 92: Middle East & Africa Three-in-One Temperature, Humidity and Pressure Sensor Market Forecast (USD Billion), by Sub-Segment 3, 2018-2029
      Figure 93: Middle East & Africa Three-in-One Temperature, Humidity and Pressure Sensor Market Forecast (USD Billion), by Others, 2018-2029
      Figure 94: Middle East & Africa Three-in-One Temperature, Humidity and Pressure Sensor Market Value Share (%), By Segment 3, 2022 & 2029
      Figure 95: Middle East & Africa Three-in-One Temperature, Humidity and Pressure Sensor Market Forecast (USD Billion), by Sub-Segment 1, 2018-2029
      Figure 96: Middle East & Africa Three-in-One Temperature, Humidity and Pressure Sensor Market Forecast (USD Billion), by Sub-Segment 2, 2018-2029
      Figure 97: Middle East & Africa Three-in-One Temperature, Humidity and Pressure Sensor Market Forecast (USD Billion), by Sub-Segment 3, 2018-2029
      Figure 98: Middle East & Africa Three-in-One Temperature, Humidity and Pressure Sensor Market Forecast (USD Billion), by Others, 2018-2029
      Figure 99: Middle East & Africa Three-in-One Temperature, Humidity and Pressure Sensor Market Forecast (USD Billion), by GCC, 2018-2029
      Figure 100: Middle East & Africa Three-in-One Temperature, Humidity and Pressure Sensor Market Forecast (USD Billion), by South Africa, 2018-2029
      Figure 101: Middle East & Africa Three-in-One Temperature, Humidity and Pressure Sensor Market Forecast (USD Billion), by Rest of Middle East & Africa, 2018-2029 
      List of Tables
      Table 1: Global Three-in-One Temperature, Humidity and Pressure Sensor Market Revenue (USD Billion) Forecast, by Segment 1, 2018-2029
      Table 2: Global Three-in-One Temperature, Humidity and Pressure Sensor Market Revenue (USD Billion) Forecast, by Segment 2, 2018-2029
      Table 3: Global Three-in-One Temperature, Humidity and Pressure Sensor Market Revenue (USD Billion) Forecast, by Segment 3, 2018-2029
      Table 4: Global Three-in-One Temperature, Humidity and Pressure Sensor Market Revenue (USD Billion) Forecast, by Region, 2018-2029
      Table 5: North America Three-in-One Temperature, Humidity and Pressure Sensor Market Revenue (USD Billion) Forecast, by Segment 1, 2018-2029
      Table 6: North America Three-in-One Temperature, Humidity and Pressure Sensor Market Revenue (USD Billion) Forecast, by Segment 2, 2018-2029
      Table 7: North America Three-in-One Temperature, Humidity and Pressure Sensor Market Revenue (USD Billion) Forecast, by Segment 3, 2018-2029
      Table 8: North America Three-in-One Temperature, Humidity and Pressure Sensor Market Revenue (USD Billion) Forecast, by Country, 2018-2029
      Table 9: Europe Three-in-One Temperature, Humidity and Pressure Sensor Market Revenue (USD Billion) Forecast, by Segment 1, 2018-2029
      Table 10: Europe Three-in-One Temperature, Humidity and Pressure Sensor Market Revenue (USD Billion) Forecast, by Segment 2, 2018-2029
      Table 11: Europe Three-in-One Temperature, Humidity and Pressure Sensor Market Revenue (USD Billion) Forecast, by Segment 3, 2018-2029
      Table 12: Europe Three-in-One Temperature, Humidity and Pressure Sensor Market Revenue (USD Billion) Forecast, by Country, 2018-2029
      Table 13: Latin America Three-in-One Temperature, Humidity and Pressure Sensor Market Revenue (USD Billion) Forecast, by Segment 1, 2018-2029
      Table 14: Latin America Three-in-One Temperature, Humidity and Pressure Sensor Market Revenue (USD Billion) Forecast, by Segment 2, 2018-2029
      Table 15: Latin America Three-in-One Temperature, Humidity and Pressure Sensor Market Revenue (USD Billion) Forecast, by Segment 3, 2018-2029
      Table 16: Latin America Three-in-One Temperature, Humidity and Pressure Sensor Market Revenue (USD Billion) Forecast, by Country, 2018-2029
      Table 17: Asia Pacific Three-in-One Temperature, Humidity and Pressure Sensor Market Revenue (USD Billion) Forecast, by Segment 1, 2018-2029
      Table 18: Asia Pacific Three-in-One Temperature, Humidity and Pressure Sensor Market Revenue (USD Billion) Forecast, by Segment 2, 2018-2029
      Table 19: Asia Pacific Three-in-One Temperature, Humidity and Pressure Sensor Market Revenue (USD Billion) Forecast, by Segment 3, 2018-2029
      Table 20: Asia Pacific Three-in-One Temperature, Humidity and Pressure Sensor Market Revenue (USD Billion) Forecast, by Country, 2018-2029
      Table 21: Middle East & Africa Three-in-One Temperature, Humidity and Pressure Sensor Market Revenue (USD Billion) Forecast, by Segment 1, 2018-2029
      Table 22: Middle East & Africa Three-in-One Temperature, Humidity and Pressure Sensor Market Revenue (USD Billion) Forecast, by Segment 2, 2018-2029
      Table 23: Middle East & Africa Three-in-One Temperature, Humidity and Pressure Sensor Market Revenue (USD Billion) Forecast, by Segment 3, 2018-2029
      Table 24: Middle East & Africa Three-in-One Temperature, Humidity and Pressure Sensor Market Revenue (USD Billion) Forecast, by Country, 2018-2029
      Research Process

      Data Library Research are conducted by industry experts who offer insight on industry structure, market segmentations technology assessment and competitive landscape (CL), and penetration, as well as on emerging trends. Their analysis is based on primary interviews (~ 80%) and secondary research (~ 20%) as well as years of professional expertise in their respective industries. Adding to this, by analysing historical trends and current market positions, our analysts predict where the market will be headed for the next five years. Furthermore, the varying trends of segment & categories geographically presented are also studied and the estimated based on the primary & secondary research.

      In this particular report from the supply side Data Library Research has conducted primary surveys (interviews) with the key level executives (VP, CEO’s, Marketing Director, Business Development Manager and SOFT) of the companies that active & prominent as well as the midsized organization

      FIGURE 1: DLR RESEARH PROCESS

      research-methodology1

      Primary Research

      Extensive primary research was conducted to gain a deeper insight of the market and industry performance. The analysis is based on both primary and secondary research as well as years of professional expertise in the respective industries.

      In addition to analysing current and historical trends, our analysts predict where the market is headed over the next five years.

      It varies by segment for these categories geographically presented in the list of market tables. Speaking about this particular report we have conducted primary surveys (interviews) with the key level executives (VP, CEO’s, Marketing Director, Business Development Manager and many more) of the major players active in the market.

      Secondary Research

      Secondary research was mainly used to collect and identify information useful for the extensive, technical, market-oriented, and Friend’s study of the Global Extra Neutral Alcohol. It was also used to obtain key information about major players, market classification and segmentation according to the industry trends, geographical markets, and developments related to the market and technology perspectives. For this study, analysts have gathered information from various credible sources, such as annual reports, sec filings, journals, white papers, SOFT presentations, and company web sites.

      Market Size Estimation

      Both, top-down and bottom-up approaches were used to estimate and validate the size of the Global market and to estimate the size of various other dependent submarkets in the overall Extra Neutral Alcohol. The key players in the market were identified through secondary research and their market contributions in the respective geographies were determined through primary and secondary research.

      Forecast Model

      research-methodology2

      Happy to Assist You

      If you have a question?

      info@datalibraryresearch.com

      IND : +91 955 279 0357

      Browse Related Reports