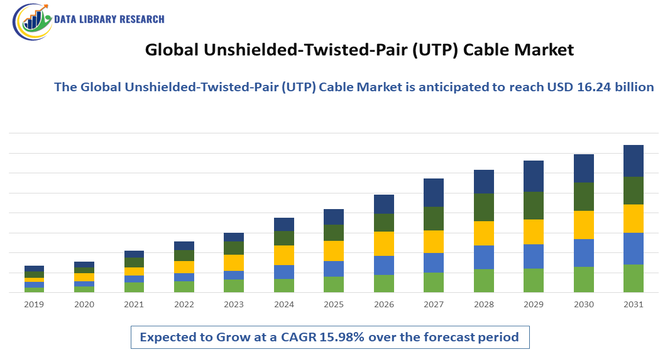
Unshielded-Twisted-Pair (UTP) Cable Market Overview and Analysis
- The Global UTP Cable Market is forecasted to reach approximately USD 16.24 billion by 2032, from USD 4.2 billion in 2025, exhibiting a Compound Annual Growth Rate (CAGR) of about 15.98% over the forecast period, 2025-2032.
Get Complete Analysis Of The Report - Download Updated Free Sample PDF
The Global Unshielded-Twisted-Pair (UTP) Cable Market is experiencing steady growth, driven primarily by the rapid expansion of data centers, increasing adoption of high-speed internet connectivity, and rising demand for structured cabling in commercial and residential infrastructures. The surge in digital transformation across industries, coupled with the proliferation of smart devices, cloud computing, and IoT ecosystems, is significantly boosting the need for reliable, cost-effective networking cables such as UTP. Moreover, ongoing upgrades from Cat5e and Cat6 to higher-performance categories like Cat6A and Cat7 to support higher bandwidths and faster data transmission are further accelerating market growth.
Unshielded-Twisted-Pair (UTP) Cable Market Latest Trends
The UTP cable market is experiencing a strong shift toward higher-performance cabling, with growing adoption of advanced categories such as Cat6A, Cat7, and even Cat8 — driven by rising demand for faster data transmission, higher bandwidth and lower latency in data centers, enterprise networks, and smart-building infrastructures. Manufacturers are also responding with improved cable designs — using better copper conductors, tighter twisting, enhanced insulation and shielding (even in UTP variants), and compliance with modern building and fire-safety standards (e.g. low-smoke, halogen-free jackets) to meet evolving enterprise and regulatory requirements.
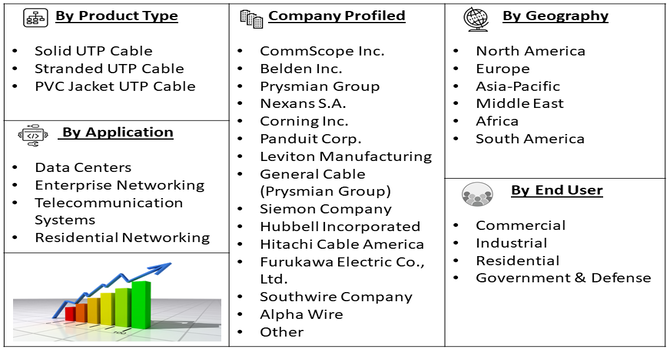
Segmentation: Global Unshielded-Twisted-Pair (UTP) Cable Market is segmented By Application (Data Centers, Enterprise Networking, Telecommunication Systems, Residential Networking), Cable Type (Solid UTP Cable, Stranded UTP Cable, PVC Jacket UTP Cable), End User (Commercial, Industrial, Residential, Government & Defense), and Geography (North America, Europe, Asia-Pacific, Middle East and Africa, and South America). The report provides the value (in USD million) for the above segments.
For Detailed Market Segmentation - Get a Free Sample PDF
Market Drivers:
- Rapid Expansion of High-Speed Internet and Data Center Infrastructure
The increasing global demand for high-speed internet connectivity is one of the strongest drivers of the UTP cable market. As households, enterprises, and public institutions continue to adopt gigabit broadband and cloud-based services, the need for reliable, low-latency networking infrastructure rises sharply. UTP cables, especially categories such as Cat5e, Cat6, and Cat6A, offer cost-effective, easy-to-install solutions that support high data transmission speeds required for modern applications. Additionally, the explosive growth of data centers—driven by cloud computing, AI workloads, and large-scale digital storage—continues to accelerate the deployment of high-performance UTP Ethernet cables for structured cabling, internal networking, and rack-to-switch connections.
- Growing Adoption of Smart Homes, IoT, and Connected Devices
The proliferation of smart homes, IoT devices, and connected industrial systems is significantly boosting the need for reliable, wired connectivity solutions. While wireless technologies dominate consumer markets, UTP cables remain the backbone of stable, interference-free communication networks needed for smart home hubs, security systems, automation devices, and energy management solutions. For instance, in December 2025, Vantage Data Centers’ completion of its fully leased 16MW facility in Malaysia reflected accelerating global hyperscale expansion, which in turn boosted demand for advanced networking infrastructure. This growth supported UTP cable market as operators strengthened interregional connectivity and upgraded data transmission capabilities.
In industrial IoT environments, UTP cables are preferred for their durability, noise immunity, and ability to handle high-speed data transfer in environments where wireless signals may be inconsistent. This ongoing shift toward connected ecosystems—spanning residential, commercial, and industrial settings—is driving steady growth in demand for UTP cabling infrastructure worldwide.
Market Restraints:
- Increasing Adoption of Wireless Communication Technologies
The major challenge is the increasing adoption of wireless communication technologies such as Wi-Fi 6, 5G, and advanced Bluetooth systems, which reduce the dependence on wired network infrastructure in both residential and commercial environments.
Additionally, UTP cables are more susceptible to electromagnetic interference (EMI) and signal degradation compared to shielded twisted-pair (STP) and fiber optic cables, limiting their use in industrial settings with high electrical noise. The rising shift toward fiber optic cabling for high-bandwidth applications also restricts UTP market penetration, particularly in enterprise and data center networks where performance and long-distance transmission are critical.
Socioeconomic Impact on Unshielded-Twisted-Pair (UTP) Cable Market
The Global Unshielded Twisted-Pair (UTP) Cable Market has experienced a significant socioeconomic impact, driven by escalating demand for high-speed data transmission and reliable networking infrastructure across residential, commercial, and industrial sectors. Rapid digitalization, expanding IT and telecommunications networks, and the proliferation of smart cities have created employment opportunities in manufacturing, installation, and maintenance services. Increased connectivity supports economic productivity, business efficiency, and technological innovation, particularly in emerging economies. Simultaneously, the market stimulates investment in raw materials, logistics, and skilled labor, contributing to regional economic development. Rising demand for UTP cables also underscores the societal shift toward digital inclusion and infrastructure modernization.
Segmental Analysis:
- Data Centers segment is expected to witness the highest growth over the forecast period
Data centers are driving significant demand for UTP cables as they require high-speed, reliable, and cost-effective networking solutions for internal connectivity between servers, switches, and storage systems. UTP cables, particularly Cat6 and Cat6A, are widely adopted due to their ability to support high data transmission rates and minimize latency, which is critical for cloud computing, AI, and large-scale digital operations. The ongoing expansion of hyperscale and enterprise data centers worldwide is accelerating the adoption of UTP cabling infrastructure.
- Solid UTP Cable segment is expected to witness the highest growth over the forecast period
Solid UTP cables are preferred for permanent, long-distance in-wall or structured cabling installations, providing enhanced signal stability and reduced attenuation over longer runs. They are widely used in commercial buildings, data centers, and enterprise networks where long-term durability and consistent performance are critical. Their reliability and cost-effectiveness make them a standard choice for structured cabling projects.
- Commercial segment is expected to witness the highest growth over the forecast period
The commercial sector represents a major end-user segment for UTP cables, encompassing office buildings, corporate campuses, retail chains, and co-working spaces. UTP cabling is extensively deployed for enterprise networking, internet connectivity, VoIP systems, CCTV, and access control networks. The growing demand for high-speed, secure, and flexible networking solutions in the commercial space drives substantial UTP cable adoption.
- North America region is expected to witness the highest growth over the forecast period
The North America region is expected to witness the highest growth over the forecast period in the Unshielded-Twisted-Pair (UTP) Cable market, driven by the presence of advanced IT infrastructure, widespread adoption of high-speed internet, and rapid expansion of data centers across the United States and Canada. For instance, in November 2025, Marvell’s acquisition of Celestial AI accelerated advancements in scale-up optical interconnects for next-generation AI data centers, indirectly increasing demand in North America for high-performance UTP cabling to support supporting network expansions, enhanced data throughput, and broader infrastructure upgrades across multi-rack AI environments.
Strict regulatory standards for network reliability, coupled with growing demand for structured cabling in enterprise, commercial, and residential sectors, are fueling the deployment of UTP cables. Additionally, the region’s focus on digital transformation, cloud computing, and IoT-enabled applications further accelerates the adoption of high-performance UTP cabling solutions.
| Report Matrics |
Details |
| Market Size Value |
USD 16.24 billion |
| Growth Rate |
CAGR of 15.98% |
| Forecast |
2026-2033 |
| Historical data |
2021-2024 |
| Base Year |
2025 |
| Report Coverage |
Forecasted revenue, company rating, competitive environment, growth drivers, and trends |
| Segment Coverage |
Type, Application, End-User, Geography |
| Regional Scope |
North America, Europe, Asia Pacific, Middle East |
| Customized scope |
Free customization of reports (With 3 months Analysis Support ) |
| To Learn More About This Report |
Request a Free Sample Copy |
Unshielded-Twisted-Pair (UTP) Cable Market Competitive Landscape
The competitive landscape of the Global Unshielded-Twisted-Pair (UTP) Cable Market is highly competitive and technology-driven, with major players focusing on product innovation, high-performance cabling solutions, global distribution networks, and strategic partnerships to maintain market leadership. Companies are emphasizing the development of higher-category cables (Cat6A, Cat7, Cat8), low-loss copper conductors, and compliance with modern building and fire-safety standards to meet the increasing demand from data centers, enterprise networks, and residential infrastructures. Strong after-sales support, regional presence, and customized solutions are key differentiators, enabling these players to capture significant market share globally.
Key Players:
- CommScope Inc.
- Belden Inc.
- Prysmian Group
- Nexans S.A.
- Corning Inc.
- Panduit Corp.
- Leviton Manufacturing
- General Cable (Prysmian Group)
- Siemon Company
- Hubbell Incorporated
- Hitachi Cable America
- Furukawa Electric Co., Ltd.
- Southwire Company
- Alpha Wire
- Sumitomo Electric Industries
- Belkin International
- Samsung C&T Corporation
- Legrand S.A.
- TE Connectivity
- Schneider Electric
Recent News
- In December 2025, ABB’s strategic investment in OctaiPipe enhanced the adoption of AI-driven solutions for data center optimization, indirectly boosting demand for high-performance UTP cables to support efficient networking, energy management, and operational resilience across global data center infrastructures.
- In November 2025, Nokia’s expansion of high-performance data center switches and AI-driven operational tools increased the demand for reliable, high-speed UTP cables to support advanced AI workloads, enhancing network efficiency, scalability, and connectivity across global data center infrastructures.
Frequently Asked Questions (FAQ) :
Q1. What are the main growth-driving factors for this market?
The main driver is the massive global demand for high-speed data transmission infrastructure. This growth is fueled by the expansion of data centers, the rollout of 5G networks, and the proliferation of IoT devices and smart homes, all of which rely on cost-effective and reliable UTP cabling for network connectivity.
Q2. What are the main restraining factors for this market?
The chief restraints are the inherent limitations of UTP cables, specifically their vulnerability to electromagnetic interference (EMI) and crosstalk, which can degrade signal quality over long distances. Additionally, the increasing competition from advanced alternatives, such as higher-performance fiber optic cables, poses a long-term challenge.
Q3. Which segment is expected to witness high growth?
The Category 6A (Cat6A) and above segment is expected to witness the highest growth. As businesses and data centers require much higher bandwidth and faster data rates to support cloud computing and large file transfers, they are rapidly upgrading to these advanced UTP categories for improved performance and reliability.
Q4. Who are the top major players for this market?
The UTP cable market is competitive, featuring several large global manufacturers. Key players include established networking and infrastructure companies like CommScope, Corning, Panduit, Belden, and TE Connectivity. These companies focus on innovation in high-category cables and strong distribution networks.
Q5. Which country is the largest player?
The United States, within the North American region, is generally considered the largest player. This is due to the presence of extensive, well-established network infrastructure, the world's largest data center market, and high technological adoption rates across enterprise and telecommunication sectors.
List of Figures
Figure 1: Global Unshielded-Twisted-Pair (UTP) Cable Market Revenue Breakdown (USD Billion, %) by Region, 2022 & 2029
Figure 2: Global Unshielded-Twisted-Pair (UTP) Cable Market Value Share (%), By Segment 1, 2022 & 2029
Figure 3: Global Unshielded-Twisted-Pair (UTP) Cable Market Forecast (USD Billion), by Sub-Segment 1, 2018-2029
Figure 4: Global Unshielded-Twisted-Pair (UTP) Cable Market Forecast (USD Billion), by Sub-Segment 2, 2018-2029
Figure 5: Global Unshielded-Twisted-Pair (UTP) Cable Market Value Share (%), By Segment 2, 2022 & 2029
Figure 6: Global Unshielded-Twisted-Pair (UTP) Cable Market Forecast (USD Billion), by Sub-Segment 1, 2018-2029
Figure 7: Global Unshielded-Twisted-Pair (UTP) Cable Market Forecast (USD Billion), by Sub-Segment 2, 2018-2029
Figure 8: Global Unshielded-Twisted-Pair (UTP) Cable Market Forecast (USD Billion), by Sub-Segment 3, 2018-2029
Figure 9: Global Unshielded-Twisted-Pair (UTP) Cable Market Forecast (USD Billion), by Others, 2018-2029
Figure 10: Global Unshielded-Twisted-Pair (UTP) Cable Market Value Share (%), By Segment 3, 2022 & 2029
Figure 11: Global Unshielded-Twisted-Pair (UTP) Cable Market Forecast (USD Billion), by Sub-Segment 1, 2018-2029
Figure 12: Global Unshielded-Twisted-Pair (UTP) Cable Market Forecast (USD Billion), by Sub-Segment 2, 2018-2029
Figure 13: Global Unshielded-Twisted-Pair (UTP) Cable Market Forecast (USD Billion), by Sub-Segment 3, 2018-2029
Figure 14: Global Unshielded-Twisted-Pair (UTP) Cable Market Forecast (USD Billion), by Others, 2018-2029
Figure 15: Global Unshielded-Twisted-Pair (UTP) Cable Market Value (USD Billion), by Region, 2022 & 2029
Figure 16: North America Unshielded-Twisted-Pair (UTP) Cable Market Value Share (%), By Segment 1, 2022 & 2029
Figure 17: North America Unshielded-Twisted-Pair (UTP) Cable Market Forecast (USD Billion), by Sub-Segment 1, 2018-2029
Figure 18: North America Unshielded-Twisted-Pair (UTP) Cable Market Forecast (USD Billion), by Sub-Segment 2, 2018-2029
Figure 19: North America Unshielded-Twisted-Pair (UTP) Cable Market Value Share (%), By Segment 2, 2022 & 2029
Figure 20: North America Unshielded-Twisted-Pair (UTP) Cable Market Forecast (USD Billion), by Sub-Segment 1, 2018-2029
Figure 21: North America Unshielded-Twisted-Pair (UTP) Cable Market Forecast (USD Billion), by Sub-Segment 2, 2018-2029
Figure 22: North America Unshielded-Twisted-Pair (UTP) Cable Market Forecast (USD Billion), by Sub-Segment 3, 2018-2029
Figure 23: North America Unshielded-Twisted-Pair (UTP) Cable Market Forecast (USD Billion), by Others, 2018-2029
Figure 24: North America Unshielded-Twisted-Pair (UTP) Cable Market Value Share (%), By Segment 3, 2022 & 2029
Figure 25: North America Unshielded-Twisted-Pair (UTP) Cable Market Forecast (USD Billion), by Sub-Segment 1, 2018-2029
Figure 26: North America Unshielded-Twisted-Pair (UTP) Cable Market Forecast (USD Billion), by Sub-Segment 2, 2018-2029
Figure 27: North America Unshielded-Twisted-Pair (UTP) Cable Market Forecast (USD Billion), by Sub-Segment 3, 2018-2029
Figure 28: North America Unshielded-Twisted-Pair (UTP) Cable Market Forecast (USD Billion), by Others, 2018-2029
Figure 29: North America Unshielded-Twisted-Pair (UTP) Cable Market Forecast (USD Billion), by U.S., 2018-2029
Figure 30: North America Unshielded-Twisted-Pair (UTP) Cable Market Forecast (USD Billion), by Canada, 2018-2029
Figure 31: Latin America Unshielded-Twisted-Pair (UTP) Cable Market Value Share (%), By Segment 1, 2022 & 2029
Figure 32: Latin America Unshielded-Twisted-Pair (UTP) Cable Market Forecast (USD Billion), by Sub-Segment 1, 2018-2029
Figure 33: Latin America Unshielded-Twisted-Pair (UTP) Cable Market Forecast (USD Billion), by Sub-Segment 2, 2018-2029
Figure 34: Latin America Unshielded-Twisted-Pair (UTP) Cable Market Value Share (%), By Segment 2, 2022 & 2029
Figure 35: Latin America Unshielded-Twisted-Pair (UTP) Cable Market Forecast (USD Billion), by Sub-Segment 1, 2018-2029
Figure 36: Latin America Unshielded-Twisted-Pair (UTP) Cable Market Forecast (USD Billion), by Sub-Segment 2, 2018-2029
Figure 37: Latin America Unshielded-Twisted-Pair (UTP) Cable Market Forecast (USD Billion), by Sub-Segment 3, 2018-2029
Figure 38: Latin America Unshielded-Twisted-Pair (UTP) Cable Market Forecast (USD Billion), by Others, 2018-2029
Figure 39: Latin America Unshielded-Twisted-Pair (UTP) Cable Market Value Share (%), By Segment 3, 2022 & 2029
Figure 40: Latin America Unshielded-Twisted-Pair (UTP) Cable Market Forecast (USD Billion), by Sub-Segment 1, 2018-2029
Figure 41: Latin America Unshielded-Twisted-Pair (UTP) Cable Market Forecast (USD Billion), by Sub-Segment 2, 2018-2029
Figure 42: Latin America Unshielded-Twisted-Pair (UTP) Cable Market Forecast (USD Billion), by Sub-Segment 3, 2018-2029
Figure 43: Latin America Unshielded-Twisted-Pair (UTP) Cable Market Forecast (USD Billion), by Others, 2018-2029
Figure 44: Latin America Unshielded-Twisted-Pair (UTP) Cable Market Forecast (USD Billion), by Brazil, 2018-2029
Figure 45: Latin America Unshielded-Twisted-Pair (UTP) Cable Market Forecast (USD Billion), by Mexico, 2018-2029
Figure 46: Latin America Unshielded-Twisted-Pair (UTP) Cable Market Forecast (USD Billion), by Rest of Latin America, 2018-2029
Figure 47: Europe Unshielded-Twisted-Pair (UTP) Cable Market Value Share (%), By Segment 1, 2022 & 2029
Figure 48: Europe Unshielded-Twisted-Pair (UTP) Cable Market Forecast (USD Billion), by Sub-Segment 1, 2018-2029
Figure 49: Europe Unshielded-Twisted-Pair (UTP) Cable Market Forecast (USD Billion), by Sub-Segment 2, 2018-2029
Figure 50: Europe Unshielded-Twisted-Pair (UTP) Cable Market Value Share (%), By Segment 2, 2022 & 2029
Figure 51: Europe Unshielded-Twisted-Pair (UTP) Cable Market Forecast (USD Billion), by Sub-Segment 1, 2018-2029
Figure 52: Europe Unshielded-Twisted-Pair (UTP) Cable Market Forecast (USD Billion), by Sub-Segment 2, 2018-2029
Figure 53: Europe Unshielded-Twisted-Pair (UTP) Cable Market Forecast (USD Billion), by Sub-Segment 3, 2018-2029
Figure 54: Europe Unshielded-Twisted-Pair (UTP) Cable Market Forecast (USD Billion), by Others, 2018-2029
Figure 55: Europe Unshielded-Twisted-Pair (UTP) Cable Market Value Share (%), By Segment 3, 2022 & 2029
Figure 56: Europe Unshielded-Twisted-Pair (UTP) Cable Market Forecast (USD Billion), by Sub-Segment 1, 2018-2029
Figure 57: Europe Unshielded-Twisted-Pair (UTP) Cable Market Forecast (USD Billion), by Sub-Segment 2, 2018-2029
Figure 58: Europe Unshielded-Twisted-Pair (UTP) Cable Market Forecast (USD Billion), by Sub-Segment 3, 2018-2029
Figure 59: Europe Unshielded-Twisted-Pair (UTP) Cable Market Forecast (USD Billion), by Others, 2018-2029
Figure 60: Europe Unshielded-Twisted-Pair (UTP) Cable Market Forecast (USD Billion), by U.K., 2018-2029
Figure 61: Europe Unshielded-Twisted-Pair (UTP) Cable Market Forecast (USD Billion), by Germany, 2018-2029
Figure 62: Europe Unshielded-Twisted-Pair (UTP) Cable Market Forecast (USD Billion), by France, 2018-2029
Figure 63: Europe Unshielded-Twisted-Pair (UTP) Cable Market Forecast (USD Billion), by Italy, 2018-2029
Figure 64: Europe Unshielded-Twisted-Pair (UTP) Cable Market Forecast (USD Billion), by Spain, 2018-2029
Figure 65: Europe Unshielded-Twisted-Pair (UTP) Cable Market Forecast (USD Billion), by Russia, 2018-2029
Figure 66: Europe Unshielded-Twisted-Pair (UTP) Cable Market Forecast (USD Billion), by Rest of Europe, 2018-2029
Figure 67: Asia Pacific Unshielded-Twisted-Pair (UTP) Cable Market Value Share (%), By Segment 1, 2022 & 2029
Figure 68: Asia Pacific Unshielded-Twisted-Pair (UTP) Cable Market Forecast (USD Billion), by Sub-Segment 1, 2018-2029
Figure 69: Asia Pacific Unshielded-Twisted-Pair (UTP) Cable Market Forecast (USD Billion), by Sub-Segment 2, 2018-2029
Figure 70: Asia Pacific Unshielded-Twisted-Pair (UTP) Cable Market Value Share (%), By Segment 2, 2022 & 2029
Figure 71: Asia Pacific Unshielded-Twisted-Pair (UTP) Cable Market Forecast (USD Billion), by Sub-Segment 1, 2018-2029
Figure 72: Asia Pacific Unshielded-Twisted-Pair (UTP) Cable Market Forecast (USD Billion), by Sub-Segment 2, 2018-2029
Figure 73: Asia Pacific Unshielded-Twisted-Pair (UTP) Cable Market Forecast (USD Billion), by Sub-Segment 3, 2018-2029
Figure 74: Asia Pacific Unshielded-Twisted-Pair (UTP) Cable Market Forecast (USD Billion), by Others, 2018-2029
Figure 75: Asia Pacific Unshielded-Twisted-Pair (UTP) Cable Market Value Share (%), By Segment 3, 2022 & 2029
Figure 76: Asia Pacific Unshielded-Twisted-Pair (UTP) Cable Market Forecast (USD Billion), by Sub-Segment 1, 2018-2029
Figure 77: Asia Pacific Unshielded-Twisted-Pair (UTP) Cable Market Forecast (USD Billion), by Sub-Segment 2, 2018-2029
Figure 78: Asia Pacific Unshielded-Twisted-Pair (UTP) Cable Market Forecast (USD Billion), by Sub-Segment 3, 2018-2029
Figure 79: Asia Pacific Unshielded-Twisted-Pair (UTP) Cable Market Forecast (USD Billion), by Others, 2018-2029
Figure 80: Asia Pacific Unshielded-Twisted-Pair (UTP) Cable Market Forecast (USD Billion), by China, 2018-2029
Figure 81: Asia Pacific Unshielded-Twisted-Pair (UTP) Cable Market Forecast (USD Billion), by India, 2018-2029
Figure 82: Asia Pacific Unshielded-Twisted-Pair (UTP) Cable Market Forecast (USD Billion), by Japan, 2018-2029
Figure 83: Asia Pacific Unshielded-Twisted-Pair (UTP) Cable Market Forecast (USD Billion), by Australia, 2018-2029
Figure 84: Asia Pacific Unshielded-Twisted-Pair (UTP) Cable Market Forecast (USD Billion), by Southeast Asia, 2018-2029
Figure 85: Asia Pacific Unshielded-Twisted-Pair (UTP) Cable Market Forecast (USD Billion), by Rest of Asia Pacific, 2018-2029
Figure 86: Middle East & Africa Unshielded-Twisted-Pair (UTP) Cable Market Value Share (%), By Segment 1, 2022 & 2029
Figure 87: Middle East & Africa Unshielded-Twisted-Pair (UTP) Cable Market Forecast (USD Billion), by Sub-Segment 1, 2018-2029
Figure 88: Middle East & Africa Unshielded-Twisted-Pair (UTP) Cable Market Forecast (USD Billion), by Sub-Segment 2, 2018-2029
Figure 89: Middle East & Africa Unshielded-Twisted-Pair (UTP) Cable Market Value Share (%), By Segment 2, 2022 & 2029
Figure 90: Middle East & Africa Unshielded-Twisted-Pair (UTP) Cable Market Forecast (USD Billion), by Sub-Segment 1, 2018-2029
Figure 91: Middle East & Africa Unshielded-Twisted-Pair (UTP) Cable Market Forecast (USD Billion), by Sub-Segment 2, 2018-2029
Figure 92: Middle East & Africa Unshielded-Twisted-Pair (UTP) Cable Market Forecast (USD Billion), by Sub-Segment 3, 2018-2029
Figure 93: Middle East & Africa Unshielded-Twisted-Pair (UTP) Cable Market Forecast (USD Billion), by Others, 2018-2029
Figure 94: Middle East & Africa Unshielded-Twisted-Pair (UTP) Cable Market Value Share (%), By Segment 3, 2022 & 2029
Figure 95: Middle East & Africa Unshielded-Twisted-Pair (UTP) Cable Market Forecast (USD Billion), by Sub-Segment 1, 2018-2029
Figure 96: Middle East & Africa Unshielded-Twisted-Pair (UTP) Cable Market Forecast (USD Billion), by Sub-Segment 2, 2018-2029
Figure 97: Middle East & Africa Unshielded-Twisted-Pair (UTP) Cable Market Forecast (USD Billion), by Sub-Segment 3, 2018-2029
Figure 98: Middle East & Africa Unshielded-Twisted-Pair (UTP) Cable Market Forecast (USD Billion), by Others, 2018-2029
Figure 99: Middle East & Africa Unshielded-Twisted-Pair (UTP) Cable Market Forecast (USD Billion), by GCC, 2018-2029
Figure 100: Middle East & Africa Unshielded-Twisted-Pair (UTP) Cable Market Forecast (USD Billion), by South Africa, 2018-2029
Figure 101: Middle East & Africa Unshielded-Twisted-Pair (UTP) Cable Market Forecast (USD Billion), by Rest of Middle East & Africa, 2018-2029
List of Tables
Table 1: Global Unshielded-Twisted-Pair (UTP) Cable Market Revenue (USD Billion) Forecast, by Segment 1, 2018-2029
Table 2: Global Unshielded-Twisted-Pair (UTP) Cable Market Revenue (USD Billion) Forecast, by Segment 2, 2018-2029
Table 3: Global Unshielded-Twisted-Pair (UTP) Cable Market Revenue (USD Billion) Forecast, by Segment 3, 2018-2029
Table 4: Global Unshielded-Twisted-Pair (UTP) Cable Market Revenue (USD Billion) Forecast, by Region, 2018-2029
Table 5: North America Unshielded-Twisted-Pair (UTP) Cable Market Revenue (USD Billion) Forecast, by Segment 1, 2018-2029
Table 6: North America Unshielded-Twisted-Pair (UTP) Cable Market Revenue (USD Billion) Forecast, by Segment 2, 2018-2029
Table 7: North America Unshielded-Twisted-Pair (UTP) Cable Market Revenue (USD Billion) Forecast, by Segment 3, 2018-2029
Table 8: North America Unshielded-Twisted-Pair (UTP) Cable Market Revenue (USD Billion) Forecast, by Country, 2018-2029
Table 9: Europe Unshielded-Twisted-Pair (UTP) Cable Market Revenue (USD Billion) Forecast, by Segment 1, 2018-2029
Table 10: Europe Unshielded-Twisted-Pair (UTP) Cable Market Revenue (USD Billion) Forecast, by Segment 2, 2018-2029
Table 11: Europe Unshielded-Twisted-Pair (UTP) Cable Market Revenue (USD Billion) Forecast, by Segment 3, 2018-2029
Table 12: Europe Unshielded-Twisted-Pair (UTP) Cable Market Revenue (USD Billion) Forecast, by Country, 2018-2029
Table 13: Latin America Unshielded-Twisted-Pair (UTP) Cable Market Revenue (USD Billion) Forecast, by Segment 1, 2018-2029
Table 14: Latin America Unshielded-Twisted-Pair (UTP) Cable Market Revenue (USD Billion) Forecast, by Segment 2, 2018-2029
Table 15: Latin America Unshielded-Twisted-Pair (UTP) Cable Market Revenue (USD Billion) Forecast, by Segment 3, 2018-2029
Table 16: Latin America Unshielded-Twisted-Pair (UTP) Cable Market Revenue (USD Billion) Forecast, by Country, 2018-2029
Table 17: Asia Pacific Unshielded-Twisted-Pair (UTP) Cable Market Revenue (USD Billion) Forecast, by Segment 1, 2018-2029
Table 18: Asia Pacific Unshielded-Twisted-Pair (UTP) Cable Market Revenue (USD Billion) Forecast, by Segment 2, 2018-2029
Table 19: Asia Pacific Unshielded-Twisted-Pair (UTP) Cable Market Revenue (USD Billion) Forecast, by Segment 3, 2018-2029
Table 20: Asia Pacific Unshielded-Twisted-Pair (UTP) Cable Market Revenue (USD Billion) Forecast, by Country, 2018-2029
Table 21: Middle East & Africa Unshielded-Twisted-Pair (UTP) Cable Market Revenue (USD Billion) Forecast, by Segment 1, 2018-2029
Table 22: Middle East & Africa Unshielded-Twisted-Pair (UTP) Cable Market Revenue (USD Billion) Forecast, by Segment 2, 2018-2029
Table 23: Middle East & Africa Unshielded-Twisted-Pair (UTP) Cable Market Revenue (USD Billion) Forecast, by Segment 3, 2018-2029
Table 24: Middle East & Africa Unshielded-Twisted-Pair (UTP) Cable Market Revenue (USD Billion) Forecast, by Country, 2018-2029
Research Process
Data Library Research are conducted by industry experts who offer insight on
industry structure, market segmentations technology assessment and competitive landscape (CL), and penetration, as well as on emerging trends. Their analysis is based on primary interviews (~ 80%) and secondary research (~ 20%) as well as years of professional expertise in their respective industries. Adding to this, by analysing historical trends and current market positions, our analysts predict where the market will be headed for the next five years. Furthermore, the varying trends of segment & categories geographically presented are also studied and the estimated based on the primary & secondary research.
In this particular report from the supply side Data Library Research has conducted primary surveys (interviews) with the key level executives (VP, CEO’s, Marketing Director, Business Development Manager
and SOFT) of the companies that active & prominent as well as the midsized organization
FIGURE 1: DLR RESEARH PROCESS
![research-methodology1]()
Primary Research
Extensive primary research was conducted to gain a deeper insight of the market and industry performance. The analysis is based on both primary and secondary research as well as years of professional expertise in the respective industries.
In addition to analysing current and historical trends, our analysts predict where the market is headed over the next five years.
It varies by segment for these categories geographically presented in the list of market tables. Speaking about this particular report we have conducted primary surveys (interviews) with the key level executives (VP, CEO’s, Marketing Director, Business Development Manager and many more) of the major players active in the market.
Secondary Research
Secondary research was mainly used to collect and identify information useful for the extensive, technical, market-oriented, and Friend’s study of the Global Extra Neutral Alcohol. It was also used to obtain key information about major players, market classification and segmentation according to the industry trends, geographical markets, and developments related to the market and technology perspectives. For this study, analysts have gathered information from various credible sources, such as annual reports, sec filings, journals, white papers, SOFT presentations, and company web sites.
Market Size Estimation
Both, top-down and bottom-up approaches were used to estimate and validate the size of the Global market and to estimate the size of various other dependent submarkets in the overall Extra Neutral Alcohol. The key players in the market were identified through secondary research and their market contributions in the respective geographies were determined through primary and secondary research.
Forecast Model
![research-methodology2]()