Urban Environmental Market Overview and Analysis

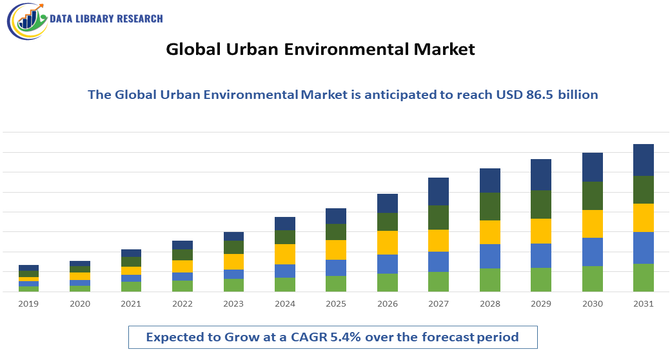
The Global Urban Environmental Market reached approximately USD 61.2 billion in 2026 and is expected to grow to USD 86.5 billion by 2033, growing with a CAGR of (5.4% ), 2026-2033.

The Global Urban Environmental Market comprises products, technologies, and services designed to monitor, manage, and improve environmental conditions in urban areas. It includes solutions for air and water quality monitoring, waste management, noise control, green infrastructure, urban climate resilience, and environmental data analytics. The market supports sustainable city development by helping governments and organizations address pollution, resource efficiency, and climate change impacts. Growth is driven by rapid urbanization, stricter environmental regulations, and smart city initiatives worldwide.

Urban Environmental Market Latest Trends

The Global Urban Environmental Market is evolving rapidly as cities adopt smart, data-driven solutions to manage pollution, resources, and climate risks. Key trends include the growing use of IoT sensors for real-time air, water, and noise monitoring, and the integration of AI and analytics platforms to support predictive decision-making. Smart waste management, green infrastructure, and urban climate resilience solutions are gaining traction as municipalities pursue sustainability goals. Increased investment in smart city programs and digital twins is improving urban planning and environmental performance.

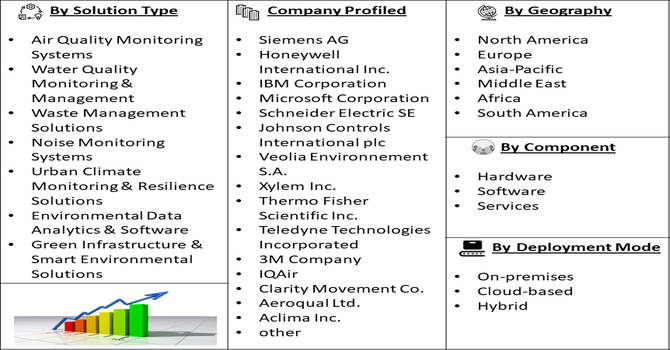
Segmentation: The Global Urban Environmental Market is segmented by Solution Type (Air Quality Monitoring Systems, Water Quality Monitoring & Management, Waste Management Solutions, Noise Monitoring Systems, Urban Climate Monitoring & Resilience Solutions, Environmental Data Analytics & Software and Green Infrastructure & Smart Environmental Solutions), Component (Hardware (Sensors, Monitors, Meters), Software (Analytics Platforms, Dashboards, Data Management) and Services (Consulting, Installation, Maintenance, Monitoring)), Deployment Mode (On-premises, Cloud-based and Hybrid), and Geography (North America, Europe, Asia-Pacific, Middle East and Africa, and South America). The report provides the value (in USD million) for the above segments.

Market Drivers:

  • Rapid Urbanization and Smart City Development

Rapid urbanization across developed and emerging economies has significantly increased pressure on urban infrastructure, natural resources, and environmental quality. As cities expand, governments and municipalities are investing heavily in smart city initiatives to manage air pollution, water scarcity, waste generation, and climate resilience. Urban environmental solutions such as real-time monitoring systems, data analytics platforms, and smart waste management technologies help cities optimize resource use and improve living conditions.

In July 2025, World Bank, reported that India’s urban population growth and the projected need for over 144 million new homes by 2070, coupled with intensifying heat waves and flood risks from reduced stormwater absorption, underscored the urgency of sustainable urban planning. This accelerated global demand for urban environmental solutions and smart city development, driving investments in climate-resilient infrastructure, monitoring systems, and green technologies worldwide. The growing adoption of digital infrastructure, IoT sensors, and integrated urban management platforms has driven strong demand for environmental solutions, making urbanization a key growth driver for the global urban environmental market.

  • Stringent Environmental Regulations and Climate Action Goals

Increasingly strict environmental regulations and global climate commitments have accelerated adoption of urban environmental technologies. Governments are enforcing air and water quality standards, emissions monitoring, and waste reduction policies to protect public health and meet sustainability targets. Cities are also aligning with international climate frameworks, such as net-zero and carbon neutrality goals, which require continuous environmental monitoring and data-driven decision-making. Urban environmental solutions support regulatory compliance by providing accurate, real-time data and reporting capabilities. As regulatory pressure intensifies and climate risks grow, municipalities and organizations are increasingly investing in advanced environmental monitoring and management systems.

Market Restraints:

  • High Implementation Costs and Budget Constraints

Despite strong demand, high implementation costs remain a major restraint for the global urban environmental market. Deploying comprehensive monitoring networks, smart infrastructure, and advanced data platforms requires significant capital investment, which can strain municipal budgets, particularly in developing regions. Ongoing costs related to system maintenance, data management, and skilled personnel further increase financial pressure. Limited funding, lengthy approval processes, and competing public spending priorities often delay or scale down projects. As a result, cost sensitivity and budget constraints can slow adoption of urban environmental solutions, especially in smaller cities and low-income urban areas.

Socioeconomic Impact on Urban Environmental Market

The urban environmental market plays a vital socioeconomic role by improving public health, quality of life, and economic resilience in cities. Effective air and water quality management reduces healthcare costs and pollution-related illnesses, while sustainable waste and energy solutions support cleaner living environments. The market also creates employment opportunities across environmental services, technology development, data analytics, and urban infrastructure projects. By supporting climate adaptation and disaster preparedness, these solutions help protect vulnerable urban populations and critical assets. Moreover, improved environmental conditions enhance city attractiveness, boosting tourism, investment, and long-term economic growth while supporting inclusive and sustainable urban development.

Segmental Analysis:

  • Noise Monitoring Systems segment is expected to witness highest growth over the forecast period

The noise monitoring systems segment was expected to witness the fastest growth due to increasing urbanization, rising traffic congestion, and expanding industrial activities. As cities grow denser, noise pollution has become a major public health concern, prompting governments to enforce stricter noise regulations and monitoring standards. Smart city projects and urban planning initiatives increasingly include noise mapping and real-time monitoring to manage traffic, construction, and industrial noise sources. Advanced sensors, IoT connectivity, and data-driven analysis have improved accuracy and ease of deployment. This heightened regulatory and community focus drove strong demand for noise monitoring solutions during the forecast period.

  • Analytics Platforms segment is expected to witness highest growth over the forecast period

The analytics platforms segment was expected to grow fastest as cities and organizations increasingly relied on data-driven decision-making to manage environmental challenges. With large volumes of data generated by air, water, noise, and waste sensors, analytics platforms became essential for real-time monitoring, trend analysis, and predictive forecasting. These platforms enable integration of multiple data sources, visualization through dashboards, and automated reporting for compliance and planning. Advanced AI and machine learning capabilities improved anomaly detection and predictive insights. As municipalities invested in smart city infrastructure, demand for scalable analytics platforms surged, making this segment a key growth driver in the urban environmental market.

  • Cloud-based segment is expected to witness highest growth over the forecast period

The cloud-based segment was expected to witness the highest growth due to its scalability, cost-efficiency, and remote accessibility. Cloud solutions allow municipalities and enterprises to store, process, and analyze environmental data without heavy on-premises IT investments. They enable real-time access to monitoring data, collaborative workflows, and seamless software updates, supporting multi-location urban projects. Additionally, cloud platforms facilitate integration of IoT devices and AI analytics, enhancing system performance and scalability. As more cities adopted smart infrastructure and digital services, cloud-based environmental solutions offered flexibility and rapid deployment, driving strong growth compared to traditional on-premises systems.

  • North American Region is expected to witness highest growth over the forecast period

North America was expected to lead growth due to strong smart city initiatives, strict environmental regulations, and advanced technological adoption. The region has high demand for air quality, water monitoring, and noise control solutions driven by public health concerns and regulatory compliance.

In Deceber 2025, A peer-reviewed study led by Kaihui Song revealed that rising temperatures would worsen heat exposure disparities across the United States, particularly in the Southeast, by 2100. This finding heightened demand for urban environmental solutions in North America, as municipalities accelerated investments in heat monitoring, climate resilience planning, and data-driven mitigation tools to address inequities and protect vulnerable communities.

Major cities and municipalities invested in IoT networks, analytics platforms, and integrated environmental management systems to enhance sustainability and quality of life. Additionally, North America’s strong presence of technology providers and environmental service firms accelerated innovation and deployment. These factors, combined with substantial government funding and private investments in urban infrastructure, positioned North America as the fastest-growing region in the forecast period.

  • Urban Environmental Market Competitive Landscape

The competitive landscape of the global urban environmental market is diverse, comprising multinational technology firms, environmental service providers, engineering companies, and emerging startups. Competition centers on innovation, data accuracy, system integration, and scalability of solutions. Leading players invest heavily in R&D to enhance sensor technologies, analytics platforms, and end-to-end environmental management systems. Strategic partnerships with municipalities, utilities, and infrastructure developers are common to expand market reach. Additionally, mergers and acquisitions help companies broaden capabilities across air quality, water management, and smart infrastructure. The market remains moderately fragmented, with regional players competing alongside global firms through customized, city-specific solutions.

The major players for above market are:

  • Siemens AG
  • Honeywell International Inc.
  • IBM Corporation
  • Microsoft Corporation
  • Schneider Electric SE
  • Johnson Controls International plc
  • Veolia Environnement S.A.
  • Xylem Inc.
  • Thermo Fisher Scientific Inc.
  • Teledyne Technologies Incorporated
  • 3M Company
  • IQAir
  • Clarity Movement Co.
  • Aeroqual Ltd.
  • Aclima Inc.
  • Sutron Corporation
  • OptiRTC, Inc.
  • Paradox Engineering SA
  • Trimble Inc.
  • Hitachi Ltd.

Recent Development

  • In September 2025, CAWRAS’ launch and its $25 million Weather Science Research Programme strengthened tropical climate and weather research in Singapore and Southeast Asia. This initiative boosted demand for urban environmental monitoring and analytics tools globally, as enhanced climate modeling and weather data capabilities supported smarter urban planning, improved air quality and flood management, and accelerated adoption of advanced environmental sensing and analytics in cities worldwide.


  • In October 2023, Izmir’s inclusion in the Z Zurich Foundation’s Urban Climate Resilience Program strengthened local climate disaster preparedness, focusing on flooding and extreme heat. This initiative increased demand for urban environmental solutions globally, as cities sought advanced monitoring, resilience planning, and climate risk analytics. The collaboration also highlighted the importance of integrated environmental technologies in urban resilience projects, boosting market adoption worldwide.


Frequently Asked Questions (FAQ) :

Q1. What are the main growth-driving factors for this market?

Rapid global urbanization and stringent environmental regulations are the primary drivers. Cities are increasingly investing in smart waste management, air quality monitoring, and water treatment to meet sustainability goals. Additionally, the rise of "Smart City" initiatives and increased public awareness regarding climate change are pushing municipalities to adopt advanced green technologies.

Q2. What are the main restraining factors for this market?

High capital expenditure for large-scale environmental infrastructure projects often slows market progress. Many developing cities face significant budget constraints and lack the technical expertise required to maintain complex systems. Furthermore, fragmented regulatory frameworks across different regions and the long ROI period for environmental investments can deter private sector participation and investment.

Q3. Which segment is expected to witness high growth?

The Smart Waste Management segment is poised for high growth. As urban populations surge, traditional collection methods become inefficient. Integration of IoT sensors, automated sorting, and waste-to-energy technologies is becoming essential. This segment benefits from the circular economy trend, focusing on resource recovery and reducing the environmental footprint of urban centers.

Q4. Who are the top major players for this market?

The market is led by global environmental services and technology firms including Veolia Environnement, Suez, and Waste Management, Inc. Other key players include Xylem for water solutions and Siemens for smart infrastructure. These companies dominate through integrated service offerings that combine physical utility management with advanced digital monitoring and analytics.

Q5. Which country is the largest player?

China is the largest player in the urban environmental market. Driven by massive national sustainability targets and "Sponge City" initiatives, the country has invested heavily in urban water management and air purification. Its rapid infrastructure expansion and government-backed environmental projects make it a global leader in both consumption and technology implementation.

Urban Environmental MARKET STUDY GLOBAL MARKET ANALYSIS, INSIGHTS AND FORECAST, 2022-2029

    1. Introduction

    • 1.1. Research Scope
    • 1.2. Market Segmentation
    • 1.3. Research Methodology
    • 1.4. Definitions and Assumptions

    2. Executive Summary

      3. Market Dynamics

      • 3.1. Market Drivers
      • 3.2. Market Restraints
      • 3.3. Market Opportunities

      4. Key Insights

      • 4.1. Key Emerging Trends – For Major Countries
      • 4.2. Latest Technological Advancement
      • 4.3. Regulatory Landscape
      • 4.4. Industry SWOT Analysis
      • 4.5. Porters Five Forces Analysis

      5. Global Urban Environmental Market Analysis (USD Billion), Insights and Forecast, 2018-2029

      • 5.1. Key Findings / Summary
      • 5.2. Market Analysis, Insights and Forecast – By Segment 1
        • 5.2.1. Sub-Segment 1
        • 5.2.2. Sub-Segment 2
      • 5.3. Market Analysis, Insights and Forecast – By Segment 2
        • 5.3.1. Sub-Segment 1
        • 5.3.2. Sub-Segment 2
        • 5.3.3. Sub-Segment 3
        • 5.3.4. Others
      • 5.4. Market Analysis, Insights and Forecast – By Segment 3
        • 5.4.1. Sub-Segment 1
        • 5.4.2. Sub-Segment 2
        • 5.4.3. Sub-Segment 3
        • 5.4.4. Others
      • 5.5. Market Analysis, Insights and Forecast – By Region
        • 5.5.1. North America
        • 5.5.2. Latin America
        • 5.5.3. Europe
        • 5.5.4. Asia Pacific
        • 5.5.5. Middle East and Africa

      6. North America Urban Environmental Market Analysis (USD Billion), Insights and Forecast, 2018-2029

      • 6.1. Key Findings / Summary
      • 6.2. Market Analysis, Insights and Forecast – By Segment 1
        • 6.2.1. Sub-Segment 1
        • 6.2.2. Sub-Segment 2
      • 6.3. Market Analysis, Insights and Forecast – By Segment 2
        • 6.3.1. Sub-Segment 1
        • 6.3.2. Sub-Segment 2
        • 6.3.3. Sub-Segment 3
        • 6.3.4. Others
      • 6.4. Market Analysis, Insights and Forecast – By Segment 3
        • 6.4.1. Sub-Segment 1
        • 6.4.2. Sub-Segment 2
        • 6.4.3. Sub-Segment 3
        • 6.4.4. Others
      • 6.5. Market Analysis, Insights and Forecast – By Country
        • 6.5.1. U.S.
        • 6.5.2. Canada

      7. Latin America Urban Environmental Market Analysis (USD Billion), Insights and Forecast, 2018-2029

      • 7.1. Key Findings / Summary
      • 7.2. Market Analysis, Insights and Forecast – By Segment 1
        • 7.2.1. Sub-Segment 1
        • 7.2.2. Sub-Segment 2
      • 7.3. Market Analysis, Insights and Forecast – By Segment 2
        • 7.3.1. Sub-Segment 1
        • 7.3.2. Sub-Segment 2
        • 7.3.3. Sub-Segment 3
        • 7.3.4. Others
      • 7.4. Market Analysis, Insights and Forecast – By Segment 3
        • 7.4.1. Sub-Segment 1
        • 7.4.2. Sub-Segment 2
        • 7.4.3. Sub-Segment 3
        • 7.4.4. Others
      • 7.5. Insights and Forecast – By Country
        • 7.5.1. Brazil
        • 7.5.2. Mexico
        • 7.5.3. Rest of Latin America

      8. Europe Urban Environmental Market Analysis (USD Billion), Insights and Forecast, 2018-2029

      • 8.1. Key Findings / Summary
      • 8.2. Market Analysis, Insights and Forecast – By Segment 1
        • 8.2.1. Sub-Segment 1
        • 8.2.2. Sub-Segment 2
      • 8.3. Market Analysis, Insights and Forecast – By Segment 2
        • 8.3.1. Sub-Segment 1
        • 8.3.2. Sub-Segment 2
        • 8.3.3. Sub-Segment 3
        • 8.3.4. Others
      • 8.4. Market Analysis, Insights and Forecast – By Segment 3
        • 8.4.1. Sub-Segment 1
        • 8.4.2. Sub-Segment 2
        • 8.4.3. Sub-Segment 3
        • 8.4.4. Others
      • 8.5. Market Analysis, Insights and Forecast – By Country
        • 8.5.1. UK
        • 8.5.2. Germany
        • 8.5.3. France
        • 8.5.4. Italy
        • 8.5.5. Spain
        • 8.5.6. Russia
        • 8.5.7. Rest of Europe

      9. Asia Pacific Urban Environmental Market Analysis (USD Billion), Insights and Forecast, 2018-2029

      • 9.1. Key Findings / Summary
      • 9.2. Market Analysis, Insights and Forecast – By Segment 1
        • 9.2.1. Sub-Segment 1
        • 9.2.2. Sub-Segment 2
      • 9.3. Market Analysis, Insights and Forecast – By Segment 2
        • 9.3.1. Sub-Segment 1
        • 9.3.2. Sub-Segment 2
        • 9.3.3. Sub-Segment 3
        • 9.3.4. Others
      • 9.4. Market Analysis, Insights and Forecast – By Segment 3
        • 9.4.1. Sub-Segment 1
        • 9.4.2. Sub-Segment 2
        • 9.4.3. Sub-Segment 3
        • 9.4.4. Others
      • 9.5. Market Analysis, Insights and Forecast – By Country
        • 9.5.1. China
        • 9.5.2. India
        • 9.5.3. Japan
        • 9.5.4. Australia
        • 9.5.5. South East Asia
        • 9.5.6. Rest of Asia Pacific

      10. Middle East & Africa Urban Environmental Market Analysis (USD Billion), Insights and Forecast, 2018-2029

      • 10.1. Key Findings / Summary
      • 10.2. Market Analysis, Insights and Forecast – By Segment 1
        • 10.2.1. Sub-Segment 1
        • 10.2.2. Sub-Segment 2
      • 10.3. Market Analysis, Insights and Forecast – By Segment 2
        • 10.3.1. Sub-Segment 1
        • 10.3.2. Sub-Segment 2
        • 10.3.3. Sub-Segment 3
        • 10.3.4. Others
      • 10.4. Market Analysis, Insights and Forecast – By Segment 3
        • 10.4.1. Sub-Segment 1
        • 10.4.2. Sub-Segment 2
        • 10.4.3. Sub-Segment 3
        • 10.4.4. Others
      • 10.5. Market Analysis, Insights and Forecast – By Country
        • 10.5.1. GCC
        • 10.5.2. South Africa
        • 10.5.3. Rest of Middle East & Africa

      11. Competitive Analysis

      • 11.1. Company Market Share Analysis, 2018
      • 11.2. Key Industry Developments
      • 11.3. Company Profile
        • 11.3.1. Company 1
          • 11.3.1.1. Business Overview
          • 11.3.1.2. Segment 1 & Service Offering
          • 11.3.1.3. Overall Revenue
          • 11.3.1.4. Geographic Presence
          • 11.3.1.5. Recent Development
        *Similar details will be provided for the following companies
        • 11.3.2. Company 2
        • 11.3.3. Company 3
        • 11.3.4. Company 4
        • 11.3.5. Company 5
        • 11.3.6. Company 6
        • 11.3.7. Company 7
        • 11.3.8. Company 8
        • 11.3.9. Company 9
        • 11.3.10. Company 10
        • 11.3.11. Company 11
        • 11.3.12. Company 12
      List of Figures

      Figure 1: Global Urban Environmental Market Revenue Breakdown (USD Billion, %) by Region, 2022 & 2029
      Figure 2: Global Urban Environmental Market Value Share (%), By Segment 1, 2022 & 2029
      Figure 3: Global Urban Environmental Market Forecast (USD Billion), by Sub-Segment 1, 2018-2029
      Figure 4: Global Urban Environmental Market Forecast (USD Billion), by Sub-Segment 2, 2018-2029
      Figure 5: Global Urban Environmental Market Value Share (%), By Segment 2, 2022 & 2029
      Figure 6: Global Urban Environmental Market Forecast (USD Billion), by Sub-Segment 1, 2018-2029
      Figure 7: Global Urban Environmental Market Forecast (USD Billion), by Sub-Segment 2, 2018-2029
      Figure 8: Global Urban Environmental Market Forecast (USD Billion), by Sub-Segment 3, 2018-2029
      Figure 9: Global Urban Environmental Market Forecast (USD Billion), by Others, 2018-2029
      Figure 10: Global Urban Environmental Market Value Share (%), By Segment 3, 2022 & 2029
      Figure 11: Global Urban Environmental Market Forecast (USD Billion), by Sub-Segment 1, 2018-2029
      Figure 12: Global Urban Environmental Market Forecast (USD Billion), by Sub-Segment 2, 2018-2029
      Figure 13: Global Urban Environmental Market Forecast (USD Billion), by Sub-Segment 3, 2018-2029
      Figure 14: Global Urban Environmental Market Forecast (USD Billion), by Others, 2018-2029
      Figure 15: Global Urban Environmental Market Value (USD Billion), by Region, 2022 & 2029
      Figure 16: North America Urban Environmental Market Value Share (%), By Segment 1, 2022 & 2029
      Figure 17: North America Urban Environmental Market Forecast (USD Billion), by Sub-Segment 1, 2018-2029
      Figure 18: North America Urban Environmental Market Forecast (USD Billion), by Sub-Segment 2, 2018-2029
      Figure 19: North America Urban Environmental Market Value Share (%), By Segment 2, 2022 & 2029
      Figure 20: North America Urban Environmental Market Forecast (USD Billion), by Sub-Segment 1, 2018-2029
      Figure 21: North America Urban Environmental Market Forecast (USD Billion), by Sub-Segment 2, 2018-2029
      Figure 22: North America Urban Environmental Market Forecast (USD Billion), by Sub-Segment 3, 2018-2029
      Figure 23: North America Urban Environmental Market Forecast (USD Billion), by Others, 2018-2029
      Figure 24: North America Urban Environmental Market Value Share (%), By Segment 3, 2022 & 2029
      Figure 25: North America Urban Environmental Market Forecast (USD Billion), by Sub-Segment 1, 2018-2029
      Figure 26: North America Urban Environmental Market Forecast (USD Billion), by Sub-Segment 2, 2018-2029
      Figure 27: North America Urban Environmental Market Forecast (USD Billion), by Sub-Segment 3, 2018-2029
      Figure 28: North America Urban Environmental Market Forecast (USD Billion), by Others, 2018-2029
      Figure 29: North America Urban Environmental Market Forecast (USD Billion), by U.S., 2018-2029
      Figure 30: North America Urban Environmental Market Forecast (USD Billion), by Canada, 2018-2029
      Figure 31: Latin America Urban Environmental Market Value Share (%), By Segment 1, 2022 & 2029
      Figure 32: Latin America Urban Environmental Market Forecast (USD Billion), by Sub-Segment 1, 2018-2029
      Figure 33: Latin America Urban Environmental Market Forecast (USD Billion), by Sub-Segment 2, 2018-2029
      Figure 34: Latin America Urban Environmental Market Value Share (%), By Segment 2, 2022 & 2029
      Figure 35: Latin America Urban Environmental Market Forecast (USD Billion), by Sub-Segment 1, 2018-2029
      Figure 36: Latin America Urban Environmental Market Forecast (USD Billion), by Sub-Segment 2, 2018-2029
      Figure 37: Latin America Urban Environmental Market Forecast (USD Billion), by Sub-Segment 3, 2018-2029
      Figure 38: Latin America Urban Environmental Market Forecast (USD Billion), by Others, 2018-2029
      Figure 39: Latin America Urban Environmental Market Value Share (%), By Segment 3, 2022 & 2029
      Figure 40: Latin America Urban Environmental Market Forecast (USD Billion), by Sub-Segment 1, 2018-2029
      Figure 41: Latin America Urban Environmental Market Forecast (USD Billion), by Sub-Segment 2, 2018-2029
      Figure 42: Latin America Urban Environmental Market Forecast (USD Billion), by Sub-Segment 3, 2018-2029
      Figure 43: Latin America Urban Environmental Market Forecast (USD Billion), by Others, 2018-2029
      Figure 44: Latin America Urban Environmental Market Forecast (USD Billion), by Brazil, 2018-2029
      Figure 45: Latin America Urban Environmental Market Forecast (USD Billion), by Mexico, 2018-2029
      Figure 46: Latin America Urban Environmental Market Forecast (USD Billion), by Rest of Latin America, 2018-2029
      Figure 47: Europe Urban Environmental Market Value Share (%), By Segment 1, 2022 & 2029
      Figure 48: Europe Urban Environmental Market Forecast (USD Billion), by Sub-Segment 1, 2018-2029
      Figure 49: Europe Urban Environmental Market Forecast (USD Billion), by Sub-Segment 2, 2018-2029
      Figure 50: Europe Urban Environmental Market Value Share (%), By Segment 2, 2022 & 2029
      Figure 51: Europe Urban Environmental Market Forecast (USD Billion), by Sub-Segment 1, 2018-2029
      Figure 52: Europe Urban Environmental Market Forecast (USD Billion), by Sub-Segment 2, 2018-2029
      Figure 53: Europe Urban Environmental Market Forecast (USD Billion), by Sub-Segment 3, 2018-2029
      Figure 54: Europe Urban Environmental Market Forecast (USD Billion), by Others, 2018-2029
      Figure 55: Europe Urban Environmental Market Value Share (%), By Segment 3, 2022 & 2029
      Figure 56: Europe Urban Environmental Market Forecast (USD Billion), by Sub-Segment 1, 2018-2029
      Figure 57: Europe Urban Environmental Market Forecast (USD Billion), by Sub-Segment 2, 2018-2029
      Figure 58: Europe Urban Environmental Market Forecast (USD Billion), by Sub-Segment 3, 2018-2029
      Figure 59: Europe Urban Environmental Market Forecast (USD Billion), by Others, 2018-2029
      Figure 60: Europe Urban Environmental Market Forecast (USD Billion), by U.K., 2018-2029
      Figure 61: Europe Urban Environmental Market Forecast (USD Billion), by Germany, 2018-2029
      Figure 62: Europe Urban Environmental Market Forecast (USD Billion), by France, 2018-2029
      Figure 63: Europe Urban Environmental Market Forecast (USD Billion), by Italy, 2018-2029
      Figure 64: Europe Urban Environmental Market Forecast (USD Billion), by Spain, 2018-2029
      Figure 65: Europe Urban Environmental Market Forecast (USD Billion), by Russia, 2018-2029
      Figure 66: Europe Urban Environmental Market Forecast (USD Billion), by Rest of Europe, 2018-2029
      Figure 67: Asia Pacific Urban Environmental Market Value Share (%), By Segment 1, 2022 & 2029
      Figure 68: Asia Pacific Urban Environmental Market Forecast (USD Billion), by Sub-Segment 1, 2018-2029
      Figure 69: Asia Pacific Urban Environmental Market Forecast (USD Billion), by Sub-Segment 2, 2018-2029
      Figure 70: Asia Pacific Urban Environmental Market Value Share (%), By Segment 2, 2022 & 2029
      Figure 71: Asia Pacific Urban Environmental Market Forecast (USD Billion), by Sub-Segment 1, 2018-2029
      Figure 72: Asia Pacific Urban Environmental Market Forecast (USD Billion), by Sub-Segment 2, 2018-2029
      Figure 73: Asia Pacific Urban Environmental Market Forecast (USD Billion), by Sub-Segment 3, 2018-2029
      Figure 74: Asia Pacific Urban Environmental Market Forecast (USD Billion), by Others, 2018-2029
      Figure 75: Asia Pacific Urban Environmental Market Value Share (%), By Segment 3, 2022 & 2029
      Figure 76: Asia Pacific Urban Environmental Market Forecast (USD Billion), by Sub-Segment 1, 2018-2029
      Figure 77: Asia Pacific Urban Environmental Market Forecast (USD Billion), by Sub-Segment 2, 2018-2029
      Figure 78: Asia Pacific Urban Environmental Market Forecast (USD Billion), by Sub-Segment 3, 2018-2029
      Figure 79: Asia Pacific Urban Environmental Market Forecast (USD Billion), by Others, 2018-2029
      Figure 80: Asia Pacific Urban Environmental Market Forecast (USD Billion), by China, 2018-2029
      Figure 81: Asia Pacific Urban Environmental Market Forecast (USD Billion), by India, 2018-2029
      Figure 82: Asia Pacific Urban Environmental Market Forecast (USD Billion), by Japan, 2018-2029
      Figure 83: Asia Pacific Urban Environmental Market Forecast (USD Billion), by Australia, 2018-2029
      Figure 84: Asia Pacific Urban Environmental Market Forecast (USD Billion), by Southeast Asia, 2018-2029
      Figure 85: Asia Pacific Urban Environmental Market Forecast (USD Billion), by Rest of Asia Pacific, 2018-2029
      Figure 86: Middle East & Africa Urban Environmental Market Value Share (%), By Segment 1, 2022 & 2029
      Figure 87: Middle East & Africa Urban Environmental Market Forecast (USD Billion), by Sub-Segment 1, 2018-2029
      Figure 88: Middle East & Africa Urban Environmental Market Forecast (USD Billion), by Sub-Segment 2, 2018-2029
      Figure 89: Middle East & Africa Urban Environmental Market Value Share (%), By Segment 2, 2022 & 2029
      Figure 90: Middle East & Africa Urban Environmental Market Forecast (USD Billion), by Sub-Segment 1, 2018-2029
      Figure 91: Middle East & Africa Urban Environmental Market Forecast (USD Billion), by Sub-Segment 2, 2018-2029
      Figure 92: Middle East & Africa Urban Environmental Market Forecast (USD Billion), by Sub-Segment 3, 2018-2029
      Figure 93: Middle East & Africa Urban Environmental Market Forecast (USD Billion), by Others, 2018-2029
      Figure 94: Middle East & Africa Urban Environmental Market Value Share (%), By Segment 3, 2022 & 2029
      Figure 95: Middle East & Africa Urban Environmental Market Forecast (USD Billion), by Sub-Segment 1, 2018-2029
      Figure 96: Middle East & Africa Urban Environmental Market Forecast (USD Billion), by Sub-Segment 2, 2018-2029
      Figure 97: Middle East & Africa Urban Environmental Market Forecast (USD Billion), by Sub-Segment 3, 2018-2029
      Figure 98: Middle East & Africa Urban Environmental Market Forecast (USD Billion), by Others, 2018-2029
      Figure 99: Middle East & Africa Urban Environmental Market Forecast (USD Billion), by GCC, 2018-2029
      Figure 100: Middle East & Africa Urban Environmental Market Forecast (USD Billion), by South Africa, 2018-2029
      Figure 101: Middle East & Africa Urban Environmental Market Forecast (USD Billion), by Rest of Middle East & Africa, 2018-2029 
      List of Tables
      Table 1: Global Urban Environmental Market Revenue (USD Billion) Forecast, by Segment 1, 2018-2029
      Table 2: Global Urban Environmental Market Revenue (USD Billion) Forecast, by Segment 2, 2018-2029
      Table 3: Global Urban Environmental Market Revenue (USD Billion) Forecast, by Segment 3, 2018-2029
      Table 4: Global Urban Environmental Market Revenue (USD Billion) Forecast, by Region, 2018-2029
      Table 5: North America Urban Environmental Market Revenue (USD Billion) Forecast, by Segment 1, 2018-2029
      Table 6: North America Urban Environmental Market Revenue (USD Billion) Forecast, by Segment 2, 2018-2029
      Table 7: North America Urban Environmental Market Revenue (USD Billion) Forecast, by Segment 3, 2018-2029
      Table 8: North America Urban Environmental Market Revenue (USD Billion) Forecast, by Country, 2018-2029
      Table 9: Europe Urban Environmental Market Revenue (USD Billion) Forecast, by Segment 1, 2018-2029
      Table 10: Europe Urban Environmental Market Revenue (USD Billion) Forecast, by Segment 2, 2018-2029
      Table 11: Europe Urban Environmental Market Revenue (USD Billion) Forecast, by Segment 3, 2018-2029
      Table 12: Europe Urban Environmental Market Revenue (USD Billion) Forecast, by Country, 2018-2029
      Table 13: Latin America Urban Environmental Market Revenue (USD Billion) Forecast, by Segment 1, 2018-2029
      Table 14: Latin America Urban Environmental Market Revenue (USD Billion) Forecast, by Segment 2, 2018-2029
      Table 15: Latin America Urban Environmental Market Revenue (USD Billion) Forecast, by Segment 3, 2018-2029
      Table 16: Latin America Urban Environmental Market Revenue (USD Billion) Forecast, by Country, 2018-2029
      Table 17: Asia Pacific Urban Environmental Market Revenue (USD Billion) Forecast, by Segment 1, 2018-2029
      Table 18: Asia Pacific Urban Environmental Market Revenue (USD Billion) Forecast, by Segment 2, 2018-2029
      Table 19: Asia Pacific Urban Environmental Market Revenue (USD Billion) Forecast, by Segment 3, 2018-2029
      Table 20: Asia Pacific Urban Environmental Market Revenue (USD Billion) Forecast, by Country, 2018-2029
      Table 21: Middle East & Africa Urban Environmental Market Revenue (USD Billion) Forecast, by Segment 1, 2018-2029
      Table 22: Middle East & Africa Urban Environmental Market Revenue (USD Billion) Forecast, by Segment 2, 2018-2029
      Table 23: Middle East & Africa Urban Environmental Market Revenue (USD Billion) Forecast, by Segment 3, 2018-2029
      Table 24: Middle East & Africa Urban Environmental Market Revenue (USD Billion) Forecast, by Country, 2018-2029
      Research Process

      Data Library Research are conducted by industry experts who offer insight on industry structure, market segmentations technology assessment and competitive landscape (CL), and penetration, as well as on emerging trends. Their analysis is based on primary interviews (~ 80%) and secondary research (~ 20%) as well as years of professional expertise in their respective industries. Adding to this, by analysing historical trends and current market positions, our analysts predict where the market will be headed for the next five years. Furthermore, the varying trends of segment & categories geographically presented are also studied and the estimated based on the primary & secondary research.

      In this particular report from the supply side Data Library Research has conducted primary surveys (interviews) with the key level executives (VP, CEO’s, Marketing Director, Business Development Manager and SOFT) of the companies that active & prominent as well as the midsized organization

      FIGURE 1: DLR RESEARH PROCESS

      research-methodology1

      Primary Research

      Extensive primary research was conducted to gain a deeper insight of the market and industry performance. The analysis is based on both primary and secondary research as well as years of professional expertise in the respective industries.

      In addition to analysing current and historical trends, our analysts predict where the market is headed over the next five years.

      It varies by segment for these categories geographically presented in the list of market tables. Speaking about this particular report we have conducted primary surveys (interviews) with the key level executives (VP, CEO’s, Marketing Director, Business Development Manager and many more) of the major players active in the market.

      Secondary Research

      Secondary research was mainly used to collect and identify information useful for the extensive, technical, market-oriented, and Friend’s study of the Global Extra Neutral Alcohol. It was also used to obtain key information about major players, market classification and segmentation according to the industry trends, geographical markets, and developments related to the market and technology perspectives. For this study, analysts have gathered information from various credible sources, such as annual reports, sec filings, journals, white papers, SOFT presentations, and company web sites.

      Market Size Estimation

      Both, top-down and bottom-up approaches were used to estimate and validate the size of the Global market and to estimate the size of various other dependent submarkets in the overall Extra Neutral Alcohol. The key players in the market were identified through secondary research and their market contributions in the respective geographies were determined through primary and secondary research.

      Forecast Model

      research-methodology2