Utility Coordination Services Market Overview and Analysis:

The market is projected to reach approximately USD 23.75 billion by 2032, from USD 16.76 billion in 2025. The market is forecasted to expand significantly, with a CAGR consistently around 7.8% over the forecast period 2025-2032.

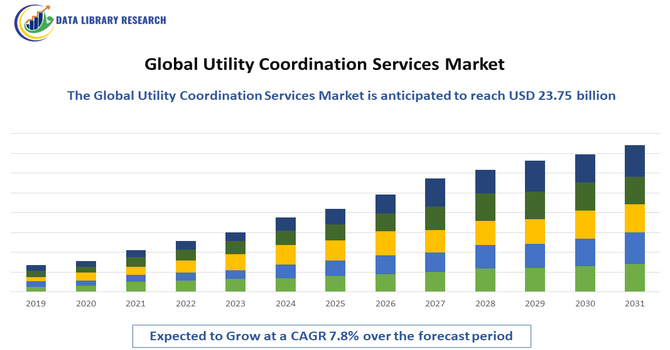
The Global Utility Coordination Services Market is experiencing steady growth, driven by increasing investment in large-scale infrastructure development, rising urbanization, and expanding smart city initiatives across both developed and emerging economies. The surge in construction of highways, commercial buildings, renewable energy facilities, and telecommunications infrastructure is creating a critical need for accurate utility mapping, conflict analysis, and coordination to avoid costly delays and damages.

Utility Coordination Services Market Latest Trends

The Global Utility Coordination Services Market is evolving rapidly with several key trends shaping its future. One prominent trend is the accelerated adoption of digital mapping, geographic information systems (GIS), and 3D modelling solutions, which enable more accurate tracking of underground and above-ground utility networks, thereby reducing damages and project delays. Another emerging trend is the increasing integration of drone technology and remote sensing for utility inspections and situational awareness in congested urban and infrastructure-heavy environments.

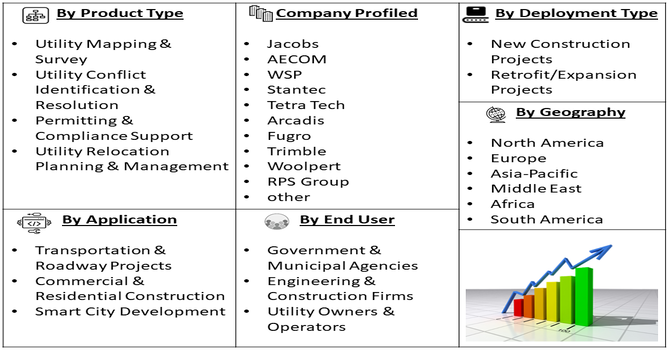
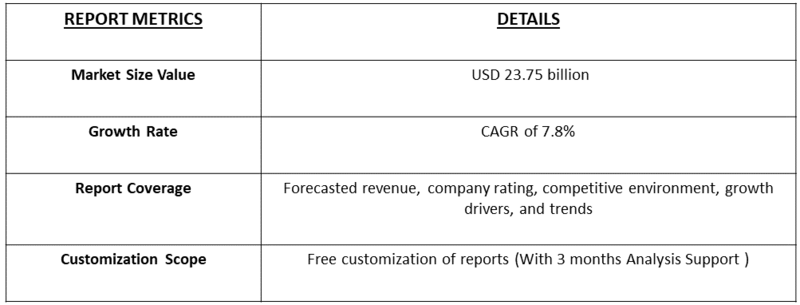
Segmentation: Global Utility Coordination Services Market is segmented By Service Type (Utility Mapping & Surveys, Utility Conflict Identification & Resolution, Permitting & Compliance Support, Utility Relocation Planning & Management), Utility Type (Water & Wastewater, Gas Pipelines, Electric Power Infrastructure, Telecommunications & Fiber Optics), Deployment Type (New Construction Projects, Retrofit/Expansion Projects, Infrastructure Rehabilitation Projects), Application (Transportation & Roadway Projects, Commercial & Residential Construction, Smart City Development), End User (Government & Municipal Agencies, Engineering & Construction Firms, Utility Owners & Operators), and Geography (North America, Europe, Asia-Pacific, Middle East and Africa, and South America). The report provides the value (in USD million) for the above segments.

Market Drivers:

  • Rapid Infrastructure Expansion and Urban Development

The primary drivers of the Global Utility Coordination Services Market is the accelerating pace of infrastructure development worldwide, including transportation networks, commercial construction, telecom fiber rollout, and utility modernization projects. As cities grow denser and underground utility networks become increasingly complex, effective coordination becomes essential to prevent costly delays, safety hazards, and utility damage during construction. Governments and private developers are prioritizing precision planning to ensure construction timelines are met, especially for megaprojects such as smart cities, highway expansions, high-speed rail lines, and renewable energy installations.

  • Increasing Regulatory Compliance and Safety Requirements

Growing emphasis on regulatory compliance and public safety is another major factor driving the demand for utility coordination services. Many countries have strengthened laws and standards governing excavation, utility documentation, and construction risk mitigation in response to rising incidents of utility strikes, service disruptions, and environmental hazards.

Regulations such as the U.S. "811 Call Before You Dig" laws, European infrastructure safety frameworks, and national construction codes require accurate mapping, approval permits, and utility coordination before project execution. For instance, in August 2025, GHD and Oyamacor formed a strategic joint venture to provide comprehensive power and utility solutions, combining extensive utility engineering, construction management, and sector expertise. Leveraging established client relationships across the U.S., this collaboration strengthens the global utility coordination services market by supporting growing infrastructure needs, enhancing regulatory compliance, and promoting safety standards, while advancing financial, strategic, and diversity objectives within the evolving utility and energy sector.

Market Restraints:

  • High Cost and Time Associated with Implementing Advanced Utility Mapping and Coordination Processes

The Global Utility Coordination Services Market faces several restraints that may limit its growth, with one of the most significant being the high cost and time associated with implementing advanced utility mapping and coordination processes, especially for large and complex infrastructure projects. Many organizations, particularly in developing regions, still rely on outdated or incomplete underground utility records, leading to challenges in data accuracy and increasing the need for extensive field verification, which can delay project timelines and inflate operational costs. Additionally, the market is hindered by fragmented utility ownership and inconsistent data standards, making coordination between multiple stakeholders—such as government agencies, telecom operators, power utilities, and construction firms—difficult and time-consuming.

Socio Economic Impact on Utility Coordination Services Market

The global utility coordination services market plays a vital socioeconomic role by ensuring the smooth and efficient integration of utilities like electricity, water, gas, and telecommunications during construction and infrastructure projects. By minimizing delays and conflicts between different utility providers, these services reduce project costs and improve timelines, which supports faster urban development and economic growth. This coordination also enhances public safety, reduces service interruptions, and promotes sustainable resource management, benefiting communities, businesses, and local economies worldwide.

Segmental Analysis:

  • Utility Mapping & Surveys segment is expected to witness highest growth over the forecast period

Within the service category, Utility Mapping & Surveys hold a key share as they form the foundation for identifying underground and above-ground utilities before construction. With increasing complexity in urban infrastructure, accurate mapping using GIS, LiDAR, ground-penetrating radar (GPR), and 3D modeling helps prevent costly utility strikes, delays, and safety risks. The growing use of digital utility records and geospatial analytics is further accelerating demand for this service segment.

  • Telecommunications & Fiber Optics segment is expected to witness highest growth over the forecast period

In the utility type segment, Telecommunications & Fiber Optics is witnessing rapid growth driven by global 5G rollout, IoT connectivity expansion, and underground fiber deployment initiatives. As more telecom carriers shift from overhead to buried infrastructure, precise coordination services are required to avoid conflicts with water, energy, and gas networks—making this segment one of the fastest expanding.

  • New Construction Projects segment is expected to witness highest growth over the forecast period

New Construction Projects represent a major share of the market, as large-scale development of roads, railways, commercial sites, and industrial parks demand early-stage utility coordination for planning, permitting, and execution. Rising government investments in transportation modernization, renewable energy infrastructure, and real estate development strengthen the importance of utility coordination during the project planning lifecycle.

  • Smart City Development segment is expected to witness highest growth over the forecast period

Smart City Development stands out as a growing segment due to increasing integration of smart grids, fiber optic networks, district heating, EV charging systems, and connected public infrastructure. Coordinating these systems requires high-precision digital modeling and conflict management, placing utility coordination as a critical step in smart urban planning and implementation.

  • Engineering & Construction Firms segment is expected to witness highest growth over the forecast period

Engineering & Construction Firms represent a major end-user group as they rely heavily on utility coordination services for compliance, risk mitigation, and project efficiency. These firms benefit from avoiding costly rework, preventing utility damage, and accelerating project approvals—making coordination services a core part of pre-construction and active site management.

  • North America region is expected to witness highest growth over the forecast period

The North America region is expected to witness the highest growth over the forecast period, driven by increasing investments in large-scale infrastructure upgrades, smart city initiatives, and modernization of utility networks across the United States and Canada.

The region’s strong regulatory framework requiring detailed utility documentation and coordination prior to construction activities further fuels demand for specialized services. For instance, in May 2025, The Emirates Nuclear Energy Company (ENEC) and GE Vernova Hitachi Nuclear Energy (GVH) signed an MoU at the World Utilities Congress in Abu Dhabi to jointly assess the international deployment of BWRX-300 Small Modular Reactor (SMR) technology. This collaboration strengthens the U.S. utility coordination services market by promoting advanced nuclear solutions, enhancing grid reliability, supporting sustainable and dispatchable power, and meeting the growing energy demands of hyperscalers and technology-driven sectors.

Similarly, in April 2025, The Emirates Nuclear Energy Company (ENEC) and GE Vernova Hitachi Nuclear Energy (GVH) signed an MoU at the World Utilities Congress in Abu Dhabi to evaluate the global deployment of BWRX-300 Small Modular Reactor (SMR) technology. This partnership impacts the U.S. utility coordination services market by enhancing grid reliability and sustainable power supply while supporting the rapid expansion of fiber optic networks for 5G rollout, meeting the growing energy and connectivity demands of technology-driven sectors.

Additionally, rapid expansion of fiber optic networks for 5G rollout, underground power grid enhancements, and growing adoption of advanced digital surveying technologies contribute to accelerating market growth, positioning North America as a leading region in the utility coordination services landscape.

Utility Coordination Services Market Competitive Landscape:

The competitive landscape of the Global Utility Coordination Services Market is moderately fragmented, featuring large engineering and AEC firms, specialized geospatial/mapping providers, and regional service specialists competing on accuracy of utility data, speed of field response, technology stack (GIS, GPR, LiDAR, digital twins), regulatory compliance expertise, and local permitting relationships. Market players differentiate through integrated digital platforms, end-to-end coordination capabilities, fast mobilization for field surveys, and partnerships with utilities and municipalities to reduce project risk and delays.

Key Players:

  • Jacobs
  • AECOM
  • WSP
  • Stantec
  • Tetra Tech
  • Arcadis
  • Fugro
  • Trimble
  • Woolpert
  • RPS Group
  • GHD
  • Ramboll
  • SNC-Lavalin
  • HDR
  • Black & Veatch
  • Michael Baker International
  • Cardno
  • Leica Geosystems
  • GeoCloud / Geosense
  • LandTech

Recent Development

  • In November 2025, HE Saeed Mohammed Al Tayer, MD & CEO of DEWA, met with Chris White-Horne, Deputy CEO of the UK Space Agency, at the Dubai Airshow to discuss potential collaboration in space technology. This partnership aims to improve the efficiency, reliability, and sustainability of utility services, positively impacting the global utility coordination services market by driving innovation, enhancing service management, and supporting smarter, more integrated infrastructure solutions worldwide.


  • In March 2025, Hitachi Energy signed a multi-year strategic collaboration agreement with Amazon Web Services (AWS) to accelerate the adoption of cloud-based solutions for utility and energy-intensive companies, supporting the energy transition. Their initial focus on deploying the AI-driven Hitachi Vegetation Manager on AWS aims to reduce power outages caused by vegetation interference. This innovation enhances the global utility coordination services market by improving infrastructure reliability, operational efficiency, and proactive asset management worldwide.


Frequently Asked Questions (FAQ) :

Q1. What are the main growth-driving factors for this market?

The market is mainly driven by intense urbanization and major infrastructure projects happening worldwide . As cities grow, the underground networks of power, water, and telecom lines become increasingly complex, making professional coordination essential. Furthermore, governments globally are enforcing strict regulations to prevent accidental utility damage during construction, which forces project developers to hire specialized coordination services to ensure public safety and avoid costly project delays.

Q2. What are the main restraining factors for this market?

A primary challenge slowing market growth is the high initial cost required to adopt and integrate modern digital technologies, such as advanced Geographic Information System (GIS) mapping and real-time collaboration software. Additionally, the industry faces a potential shortage of skilled professionals who are trained in both engineering and digital utility coordination practices. Data security concerns and the lack of standardized practices across different countries also limit scalability.

Q3. Which segment is expected to witness high growth?

The Telecommunications segment is poised for the fastest growth, primarily driven by the massive global rollout of 5G infrastructure and the ongoing expansion of fiber optic broadband networks. These communication projects involve extensive underground work, requiring precise coordination services to locate existing utilities and prevent service disruptions. This need for reliable, high-speed connectivity worldwide is accelerating demand in this segment significantly.

Q4. Who are the top major players for this market?

The market is competitive, featuring a mix of large multinational firms and specialized regional engineering companies. Some of the leading players in the utility coordination space include NV5 Global, Cardno (now Stantec), and SAM, LLC. Other key companies are KCI Technologies, Mead & Hunt, and T2 Utility Engineers. These firms focus on technological innovation, such as digital mapping, to strengthen their market position.

Q5. Which country is the largest player?

The United States, within the North American region, currently holds the largest market share for utility coordination services. This dominance is due to the region's strong focus on updating and modernizing its extensive, aging infrastructure, coupled with the implementation of very stringent regulatory standards for underground utility management and damage prevention, driving constant demand for specialized coordination.

Utility Coordination Services MARKET STUDY GLOBAL MARKET ANALYSIS, INSIGHTS AND FORECAST, 2022-2029

    1. Introduction

    • 1.1. Research Scope
    • 1.2. Market Segmentation
    • 1.3. Research Methodology
    • 1.4. Definitions and Assumptions

    2. Executive Summary

      3. Market Dynamics

      • 3.1. Market Drivers
      • 3.2. Market Restraints
      • 3.3. Market Opportunities

      4. Key Insights

      • 4.1. Key Emerging Trends – For Major Countries
      • 4.2. Latest Technological Advancement
      • 4.3. Regulatory Landscape
      • 4.4. Industry SWOT Analysis
      • 4.5. Porters Five Forces Analysis

      5. Global Utility Coordination Services Market Analysis (USD Billion), Insights and Forecast, 2018-2029

      • 5.1. Key Findings / Summary
      • 5.2. Market Analysis, Insights and Forecast – By Segment 1
        • 5.2.1. Sub-Segment 1
        • 5.2.2. Sub-Segment 2
      • 5.3. Market Analysis, Insights and Forecast – By Segment 2
        • 5.3.1. Sub-Segment 1
        • 5.3.2. Sub-Segment 2
        • 5.3.3. Sub-Segment 3
        • 5.3.4. Others
      • 5.4. Market Analysis, Insights and Forecast – By Segment 3
        • 5.4.1. Sub-Segment 1
        • 5.4.2. Sub-Segment 2
        • 5.4.3. Sub-Segment 3
        • 5.4.4. Others
      • 5.5. Market Analysis, Insights and Forecast – By Region
        • 5.5.1. North America
        • 5.5.2. Latin America
        • 5.5.3. Europe
        • 5.5.4. Asia Pacific
        • 5.5.5. Middle East and Africa

      6. North America Utility Coordination Services Market Analysis (USD Billion), Insights and Forecast, 2018-2029

      • 6.1. Key Findings / Summary
      • 6.2. Market Analysis, Insights and Forecast – By Segment 1
        • 6.2.1. Sub-Segment 1
        • 6.2.2. Sub-Segment 2
      • 6.3. Market Analysis, Insights and Forecast – By Segment 2
        • 6.3.1. Sub-Segment 1
        • 6.3.2. Sub-Segment 2
        • 6.3.3. Sub-Segment 3
        • 6.3.4. Others
      • 6.4. Market Analysis, Insights and Forecast – By Segment 3
        • 6.4.1. Sub-Segment 1
        • 6.4.2. Sub-Segment 2
        • 6.4.3. Sub-Segment 3
        • 6.4.4. Others
      • 6.5. Market Analysis, Insights and Forecast – By Country
        • 6.5.1. U.S.
        • 6.5.2. Canada

      7. Latin America Utility Coordination Services Market Analysis (USD Billion), Insights and Forecast, 2018-2029

      • 7.1. Key Findings / Summary
      • 7.2. Market Analysis, Insights and Forecast – By Segment 1
        • 7.2.1. Sub-Segment 1
        • 7.2.2. Sub-Segment 2
      • 7.3. Market Analysis, Insights and Forecast – By Segment 2
        • 7.3.1. Sub-Segment 1
        • 7.3.2. Sub-Segment 2
        • 7.3.3. Sub-Segment 3
        • 7.3.4. Others
      • 7.4. Market Analysis, Insights and Forecast – By Segment 3
        • 7.4.1. Sub-Segment 1
        • 7.4.2. Sub-Segment 2
        • 7.4.3. Sub-Segment 3
        • 7.4.4. Others
      • 7.5. Insights and Forecast – By Country
        • 7.5.1. Brazil
        • 7.5.2. Mexico
        • 7.5.3. Rest of Latin America

      8. Europe Utility Coordination Services Market Analysis (USD Billion), Insights and Forecast, 2018-2029

      • 8.1. Key Findings / Summary
      • 8.2. Market Analysis, Insights and Forecast – By Segment 1
        • 8.2.1. Sub-Segment 1
        • 8.2.2. Sub-Segment 2
      • 8.3. Market Analysis, Insights and Forecast – By Segment 2
        • 8.3.1. Sub-Segment 1
        • 8.3.2. Sub-Segment 2
        • 8.3.3. Sub-Segment 3
        • 8.3.4. Others
      • 8.4. Market Analysis, Insights and Forecast – By Segment 3
        • 8.4.1. Sub-Segment 1
        • 8.4.2. Sub-Segment 2
        • 8.4.3. Sub-Segment 3
        • 8.4.4. Others
      • 8.5. Market Analysis, Insights and Forecast – By Country
        • 8.5.1. UK
        • 8.5.2. Germany
        • 8.5.3. France
        • 8.5.4. Italy
        • 8.5.5. Spain
        • 8.5.6. Russia
        • 8.5.7. Rest of Europe

      9. Asia Pacific Utility Coordination Services Market Analysis (USD Billion), Insights and Forecast, 2018-2029

      • 9.1. Key Findings / Summary
      • 9.2. Market Analysis, Insights and Forecast – By Segment 1
        • 9.2.1. Sub-Segment 1
        • 9.2.2. Sub-Segment 2
      • 9.3. Market Analysis, Insights and Forecast – By Segment 2
        • 9.3.1. Sub-Segment 1
        • 9.3.2. Sub-Segment 2
        • 9.3.3. Sub-Segment 3
        • 9.3.4. Others
      • 9.4. Market Analysis, Insights and Forecast – By Segment 3
        • 9.4.1. Sub-Segment 1
        • 9.4.2. Sub-Segment 2
        • 9.4.3. Sub-Segment 3
        • 9.4.4. Others
      • 9.5. Market Analysis, Insights and Forecast – By Country
        • 9.5.1. China
        • 9.5.2. India
        • 9.5.3. Japan
        • 9.5.4. Australia
        • 9.5.5. South East Asia
        • 9.5.6. Rest of Asia Pacific

      10. Middle East & Africa Utility Coordination Services Market Analysis (USD Billion), Insights and Forecast, 2018-2029

      • 10.1. Key Findings / Summary
      • 10.2. Market Analysis, Insights and Forecast – By Segment 1
        • 10.2.1. Sub-Segment 1
        • 10.2.2. Sub-Segment 2
      • 10.3. Market Analysis, Insights and Forecast – By Segment 2
        • 10.3.1. Sub-Segment 1
        • 10.3.2. Sub-Segment 2
        • 10.3.3. Sub-Segment 3
        • 10.3.4. Others
      • 10.4. Market Analysis, Insights and Forecast – By Segment 3
        • 10.4.1. Sub-Segment 1
        • 10.4.2. Sub-Segment 2
        • 10.4.3. Sub-Segment 3
        • 10.4.4. Others
      • 10.5. Market Analysis, Insights and Forecast – By Country
        • 10.5.1. GCC
        • 10.5.2. South Africa
        • 10.5.3. Rest of Middle East & Africa

      11. Competitive Analysis

      • 11.1. Company Market Share Analysis, 2018
      • 11.2. Key Industry Developments
      • 11.3. Company Profile
        • 11.3.1. Company 1
          • 11.3.1.1. Business Overview
          • 11.3.1.2. Segment 1 & Service Offering
          • 11.3.1.3. Overall Revenue
          • 11.3.1.4. Geographic Presence
          • 11.3.1.5. Recent Development
        *Similar details will be provided for the following companies
        • 11.3.2. Company 2
        • 11.3.3. Company 3
        • 11.3.4. Company 4
        • 11.3.5. Company 5
        • 11.3.6. Company 6
        • 11.3.7. Company 7
        • 11.3.8. Company 8
        • 11.3.9. Company 9
        • 11.3.10. Company 10
        • 11.3.11. Company 11
        • 11.3.12. Company 12
      List of Figures

      Figure 1: Global Utility Coordination Services Market Revenue Breakdown (USD Billion, %) by Region, 2022 & 2029
      Figure 2: Global Utility Coordination Services Market Value Share (%), By Segment 1, 2022 & 2029
      Figure 3: Global Utility Coordination Services Market Forecast (USD Billion), by Sub-Segment 1, 2018-2029
      Figure 4: Global Utility Coordination Services Market Forecast (USD Billion), by Sub-Segment 2, 2018-2029
      Figure 5: Global Utility Coordination Services Market Value Share (%), By Segment 2, 2022 & 2029
      Figure 6: Global Utility Coordination Services Market Forecast (USD Billion), by Sub-Segment 1, 2018-2029
      Figure 7: Global Utility Coordination Services Market Forecast (USD Billion), by Sub-Segment 2, 2018-2029
      Figure 8: Global Utility Coordination Services Market Forecast (USD Billion), by Sub-Segment 3, 2018-2029
      Figure 9: Global Utility Coordination Services Market Forecast (USD Billion), by Others, 2018-2029
      Figure 10: Global Utility Coordination Services Market Value Share (%), By Segment 3, 2022 & 2029
      Figure 11: Global Utility Coordination Services Market Forecast (USD Billion), by Sub-Segment 1, 2018-2029
      Figure 12: Global Utility Coordination Services Market Forecast (USD Billion), by Sub-Segment 2, 2018-2029
      Figure 13: Global Utility Coordination Services Market Forecast (USD Billion), by Sub-Segment 3, 2018-2029
      Figure 14: Global Utility Coordination Services Market Forecast (USD Billion), by Others, 2018-2029
      Figure 15: Global Utility Coordination Services Market Value (USD Billion), by Region, 2022 & 2029
      Figure 16: North America Utility Coordination Services Market Value Share (%), By Segment 1, 2022 & 2029
      Figure 17: North America Utility Coordination Services Market Forecast (USD Billion), by Sub-Segment 1, 2018-2029
      Figure 18: North America Utility Coordination Services Market Forecast (USD Billion), by Sub-Segment 2, 2018-2029
      Figure 19: North America Utility Coordination Services Market Value Share (%), By Segment 2, 2022 & 2029
      Figure 20: North America Utility Coordination Services Market Forecast (USD Billion), by Sub-Segment 1, 2018-2029
      Figure 21: North America Utility Coordination Services Market Forecast (USD Billion), by Sub-Segment 2, 2018-2029
      Figure 22: North America Utility Coordination Services Market Forecast (USD Billion), by Sub-Segment 3, 2018-2029
      Figure 23: North America Utility Coordination Services Market Forecast (USD Billion), by Others, 2018-2029
      Figure 24: North America Utility Coordination Services Market Value Share (%), By Segment 3, 2022 & 2029
      Figure 25: North America Utility Coordination Services Market Forecast (USD Billion), by Sub-Segment 1, 2018-2029
      Figure 26: North America Utility Coordination Services Market Forecast (USD Billion), by Sub-Segment 2, 2018-2029
      Figure 27: North America Utility Coordination Services Market Forecast (USD Billion), by Sub-Segment 3, 2018-2029
      Figure 28: North America Utility Coordination Services Market Forecast (USD Billion), by Others, 2018-2029
      Figure 29: North America Utility Coordination Services Market Forecast (USD Billion), by U.S., 2018-2029
      Figure 30: North America Utility Coordination Services Market Forecast (USD Billion), by Canada, 2018-2029
      Figure 31: Latin America Utility Coordination Services Market Value Share (%), By Segment 1, 2022 & 2029
      Figure 32: Latin America Utility Coordination Services Market Forecast (USD Billion), by Sub-Segment 1, 2018-2029
      Figure 33: Latin America Utility Coordination Services Market Forecast (USD Billion), by Sub-Segment 2, 2018-2029
      Figure 34: Latin America Utility Coordination Services Market Value Share (%), By Segment 2, 2022 & 2029
      Figure 35: Latin America Utility Coordination Services Market Forecast (USD Billion), by Sub-Segment 1, 2018-2029
      Figure 36: Latin America Utility Coordination Services Market Forecast (USD Billion), by Sub-Segment 2, 2018-2029
      Figure 37: Latin America Utility Coordination Services Market Forecast (USD Billion), by Sub-Segment 3, 2018-2029
      Figure 38: Latin America Utility Coordination Services Market Forecast (USD Billion), by Others, 2018-2029
      Figure 39: Latin America Utility Coordination Services Market Value Share (%), By Segment 3, 2022 & 2029
      Figure 40: Latin America Utility Coordination Services Market Forecast (USD Billion), by Sub-Segment 1, 2018-2029
      Figure 41: Latin America Utility Coordination Services Market Forecast (USD Billion), by Sub-Segment 2, 2018-2029
      Figure 42: Latin America Utility Coordination Services Market Forecast (USD Billion), by Sub-Segment 3, 2018-2029
      Figure 43: Latin America Utility Coordination Services Market Forecast (USD Billion), by Others, 2018-2029
      Figure 44: Latin America Utility Coordination Services Market Forecast (USD Billion), by Brazil, 2018-2029
      Figure 45: Latin America Utility Coordination Services Market Forecast (USD Billion), by Mexico, 2018-2029
      Figure 46: Latin America Utility Coordination Services Market Forecast (USD Billion), by Rest of Latin America, 2018-2029
      Figure 47: Europe Utility Coordination Services Market Value Share (%), By Segment 1, 2022 & 2029
      Figure 48: Europe Utility Coordination Services Market Forecast (USD Billion), by Sub-Segment 1, 2018-2029
      Figure 49: Europe Utility Coordination Services Market Forecast (USD Billion), by Sub-Segment 2, 2018-2029
      Figure 50: Europe Utility Coordination Services Market Value Share (%), By Segment 2, 2022 & 2029
      Figure 51: Europe Utility Coordination Services Market Forecast (USD Billion), by Sub-Segment 1, 2018-2029
      Figure 52: Europe Utility Coordination Services Market Forecast (USD Billion), by Sub-Segment 2, 2018-2029
      Figure 53: Europe Utility Coordination Services Market Forecast (USD Billion), by Sub-Segment 3, 2018-2029
      Figure 54: Europe Utility Coordination Services Market Forecast (USD Billion), by Others, 2018-2029
      Figure 55: Europe Utility Coordination Services Market Value Share (%), By Segment 3, 2022 & 2029
      Figure 56: Europe Utility Coordination Services Market Forecast (USD Billion), by Sub-Segment 1, 2018-2029
      Figure 57: Europe Utility Coordination Services Market Forecast (USD Billion), by Sub-Segment 2, 2018-2029
      Figure 58: Europe Utility Coordination Services Market Forecast (USD Billion), by Sub-Segment 3, 2018-2029
      Figure 59: Europe Utility Coordination Services Market Forecast (USD Billion), by Others, 2018-2029
      Figure 60: Europe Utility Coordination Services Market Forecast (USD Billion), by U.K., 2018-2029
      Figure 61: Europe Utility Coordination Services Market Forecast (USD Billion), by Germany, 2018-2029
      Figure 62: Europe Utility Coordination Services Market Forecast (USD Billion), by France, 2018-2029
      Figure 63: Europe Utility Coordination Services Market Forecast (USD Billion), by Italy, 2018-2029
      Figure 64: Europe Utility Coordination Services Market Forecast (USD Billion), by Spain, 2018-2029
      Figure 65: Europe Utility Coordination Services Market Forecast (USD Billion), by Russia, 2018-2029
      Figure 66: Europe Utility Coordination Services Market Forecast (USD Billion), by Rest of Europe, 2018-2029
      Figure 67: Asia Pacific Utility Coordination Services Market Value Share (%), By Segment 1, 2022 & 2029
      Figure 68: Asia Pacific Utility Coordination Services Market Forecast (USD Billion), by Sub-Segment 1, 2018-2029
      Figure 69: Asia Pacific Utility Coordination Services Market Forecast (USD Billion), by Sub-Segment 2, 2018-2029
      Figure 70: Asia Pacific Utility Coordination Services Market Value Share (%), By Segment 2, 2022 & 2029
      Figure 71: Asia Pacific Utility Coordination Services Market Forecast (USD Billion), by Sub-Segment 1, 2018-2029
      Figure 72: Asia Pacific Utility Coordination Services Market Forecast (USD Billion), by Sub-Segment 2, 2018-2029
      Figure 73: Asia Pacific Utility Coordination Services Market Forecast (USD Billion), by Sub-Segment 3, 2018-2029
      Figure 74: Asia Pacific Utility Coordination Services Market Forecast (USD Billion), by Others, 2018-2029
      Figure 75: Asia Pacific Utility Coordination Services Market Value Share (%), By Segment 3, 2022 & 2029
      Figure 76: Asia Pacific Utility Coordination Services Market Forecast (USD Billion), by Sub-Segment 1, 2018-2029
      Figure 77: Asia Pacific Utility Coordination Services Market Forecast (USD Billion), by Sub-Segment 2, 2018-2029
      Figure 78: Asia Pacific Utility Coordination Services Market Forecast (USD Billion), by Sub-Segment 3, 2018-2029
      Figure 79: Asia Pacific Utility Coordination Services Market Forecast (USD Billion), by Others, 2018-2029
      Figure 80: Asia Pacific Utility Coordination Services Market Forecast (USD Billion), by China, 2018-2029
      Figure 81: Asia Pacific Utility Coordination Services Market Forecast (USD Billion), by India, 2018-2029
      Figure 82: Asia Pacific Utility Coordination Services Market Forecast (USD Billion), by Japan, 2018-2029
      Figure 83: Asia Pacific Utility Coordination Services Market Forecast (USD Billion), by Australia, 2018-2029
      Figure 84: Asia Pacific Utility Coordination Services Market Forecast (USD Billion), by Southeast Asia, 2018-2029
      Figure 85: Asia Pacific Utility Coordination Services Market Forecast (USD Billion), by Rest of Asia Pacific, 2018-2029
      Figure 86: Middle East & Africa Utility Coordination Services Market Value Share (%), By Segment 1, 2022 & 2029
      Figure 87: Middle East & Africa Utility Coordination Services Market Forecast (USD Billion), by Sub-Segment 1, 2018-2029
      Figure 88: Middle East & Africa Utility Coordination Services Market Forecast (USD Billion), by Sub-Segment 2, 2018-2029
      Figure 89: Middle East & Africa Utility Coordination Services Market Value Share (%), By Segment 2, 2022 & 2029
      Figure 90: Middle East & Africa Utility Coordination Services Market Forecast (USD Billion), by Sub-Segment 1, 2018-2029
      Figure 91: Middle East & Africa Utility Coordination Services Market Forecast (USD Billion), by Sub-Segment 2, 2018-2029
      Figure 92: Middle East & Africa Utility Coordination Services Market Forecast (USD Billion), by Sub-Segment 3, 2018-2029
      Figure 93: Middle East & Africa Utility Coordination Services Market Forecast (USD Billion), by Others, 2018-2029
      Figure 94: Middle East & Africa Utility Coordination Services Market Value Share (%), By Segment 3, 2022 & 2029
      Figure 95: Middle East & Africa Utility Coordination Services Market Forecast (USD Billion), by Sub-Segment 1, 2018-2029
      Figure 96: Middle East & Africa Utility Coordination Services Market Forecast (USD Billion), by Sub-Segment 2, 2018-2029
      Figure 97: Middle East & Africa Utility Coordination Services Market Forecast (USD Billion), by Sub-Segment 3, 2018-2029
      Figure 98: Middle East & Africa Utility Coordination Services Market Forecast (USD Billion), by Others, 2018-2029
      Figure 99: Middle East & Africa Utility Coordination Services Market Forecast (USD Billion), by GCC, 2018-2029
      Figure 100: Middle East & Africa Utility Coordination Services Market Forecast (USD Billion), by South Africa, 2018-2029
      Figure 101: Middle East & Africa Utility Coordination Services Market Forecast (USD Billion), by Rest of Middle East & Africa, 2018-2029 
      List of Tables
      Table 1: Global Utility Coordination Services Market Revenue (USD Billion) Forecast, by Segment 1, 2018-2029
      Table 2: Global Utility Coordination Services Market Revenue (USD Billion) Forecast, by Segment 2, 2018-2029
      Table 3: Global Utility Coordination Services Market Revenue (USD Billion) Forecast, by Segment 3, 2018-2029
      Table 4: Global Utility Coordination Services Market Revenue (USD Billion) Forecast, by Region, 2018-2029
      Table 5: North America Utility Coordination Services Market Revenue (USD Billion) Forecast, by Segment 1, 2018-2029
      Table 6: North America Utility Coordination Services Market Revenue (USD Billion) Forecast, by Segment 2, 2018-2029
      Table 7: North America Utility Coordination Services Market Revenue (USD Billion) Forecast, by Segment 3, 2018-2029
      Table 8: North America Utility Coordination Services Market Revenue (USD Billion) Forecast, by Country, 2018-2029
      Table 9: Europe Utility Coordination Services Market Revenue (USD Billion) Forecast, by Segment 1, 2018-2029
      Table 10: Europe Utility Coordination Services Market Revenue (USD Billion) Forecast, by Segment 2, 2018-2029
      Table 11: Europe Utility Coordination Services Market Revenue (USD Billion) Forecast, by Segment 3, 2018-2029
      Table 12: Europe Utility Coordination Services Market Revenue (USD Billion) Forecast, by Country, 2018-2029
      Table 13: Latin America Utility Coordination Services Market Revenue (USD Billion) Forecast, by Segment 1, 2018-2029
      Table 14: Latin America Utility Coordination Services Market Revenue (USD Billion) Forecast, by Segment 2, 2018-2029
      Table 15: Latin America Utility Coordination Services Market Revenue (USD Billion) Forecast, by Segment 3, 2018-2029
      Table 16: Latin America Utility Coordination Services Market Revenue (USD Billion) Forecast, by Country, 2018-2029
      Table 17: Asia Pacific Utility Coordination Services Market Revenue (USD Billion) Forecast, by Segment 1, 2018-2029
      Table 18: Asia Pacific Utility Coordination Services Market Revenue (USD Billion) Forecast, by Segment 2, 2018-2029
      Table 19: Asia Pacific Utility Coordination Services Market Revenue (USD Billion) Forecast, by Segment 3, 2018-2029
      Table 20: Asia Pacific Utility Coordination Services Market Revenue (USD Billion) Forecast, by Country, 2018-2029
      Table 21: Middle East & Africa Utility Coordination Services Market Revenue (USD Billion) Forecast, by Segment 1, 2018-2029
      Table 22: Middle East & Africa Utility Coordination Services Market Revenue (USD Billion) Forecast, by Segment 2, 2018-2029
      Table 23: Middle East & Africa Utility Coordination Services Market Revenue (USD Billion) Forecast, by Segment 3, 2018-2029
      Table 24: Middle East & Africa Utility Coordination Services Market Revenue (USD Billion) Forecast, by Country, 2018-2029
      Research Process

      Data Library Research are conducted by industry experts who offer insight on industry structure, market segmentations technology assessment and competitive landscape (CL), and penetration, as well as on emerging trends. Their analysis is based on primary interviews (~ 80%) and secondary research (~ 20%) as well as years of professional expertise in their respective industries. Adding to this, by analysing historical trends and current market positions, our analysts predict where the market will be headed for the next five years. Furthermore, the varying trends of segment & categories geographically presented are also studied and the estimated based on the primary & secondary research.

      In this particular report from the supply side Data Library Research has conducted primary surveys (interviews) with the key level executives (VP, CEO’s, Marketing Director, Business Development Manager and SOFT) of the companies that active & prominent as well as the midsized organization

      FIGURE 1: DLR RESEARH PROCESS

      research-methodology1

      Primary Research

      Extensive primary research was conducted to gain a deeper insight of the market and industry performance. The analysis is based on both primary and secondary research as well as years of professional expertise in the respective industries.

      In addition to analysing current and historical trends, our analysts predict where the market is headed over the next five years.

      It varies by segment for these categories geographically presented in the list of market tables. Speaking about this particular report we have conducted primary surveys (interviews) with the key level executives (VP, CEO’s, Marketing Director, Business Development Manager and many more) of the major players active in the market.

      Secondary Research

      Secondary research was mainly used to collect and identify information useful for the extensive, technical, market-oriented, and Friend’s study of the Global Extra Neutral Alcohol. It was also used to obtain key information about major players, market classification and segmentation according to the industry trends, geographical markets, and developments related to the market and technology perspectives. For this study, analysts have gathered information from various credible sources, such as annual reports, sec filings, journals, white papers, SOFT presentations, and company web sites.

      Market Size Estimation

      Both, top-down and bottom-up approaches were used to estimate and validate the size of the Global market and to estimate the size of various other dependent submarkets in the overall Extra Neutral Alcohol. The key players in the market were identified through secondary research and their market contributions in the respective geographies were determined through primary and secondary research.

      Forecast Model

      research-methodology2