VCSEL Market Overview
VCSEL stands for vertical-cavity surface-emitting lasers. Infrared illuminations are made with VCSELs because they have several advantages, including low cost, high reliability, efficiency, narrow emission spectrum, and a low diverging cylindrical beam. Surveillance, imaging, covert operations, and detection are all applications for infrared illuminators in a variety of end-use sectors, including the military. The demand for VCSELs has been significantly impacted as a result of this. The global VCSEL market is expected to grow considerably in the forecast period. The growing adoption of medical applications and proximity sensing is a crucial factor that is expected to boosts the growth of the global VCSEL market over the forthcoming years. Furthermore, substantial growth in the use of VCSELs for data communication and the rising use of VCSELs in infrared illuminations are anticipated to support the expansion of the market in the coming years. In addition, the increasing focus on research and development activities is projected to propel the market growth and make various growth opportunities for the players in the coming years.
Besides this, the increase in the demand for VCSELs with technological developments in the automotive electronics sector is anticipated to escalate the market’s growth in the near future. Similarly, the development of the consumer electronics sector and the arrival of the laser-based hard disc is expected to intensify the growth of the overall market in the forthcoming years. On the downside, the limited data transmission range is projected to control the market’s growth in the forecast period. Apart from this, the increase in the number of applications and the growing demand for gallium arsenide is further estimated to boost the development of the global VCSEL market during the forecast period.
| Report Metric |
Details |
| Market size available for years |
2023–2030 |
| Base year considered |
2023 |
| Forecast period |
2024–2030 |
| Forecast unit |
Value (USD Million) |
| Segments covered |
Raw Materials, Applications, and Region |
| Regions covered |
North America (the U.S. and Canada), Europe (UK, Germany, France, Italy, Spain, Russia, Rest of Europe), Asia-Pacific (China, India, Japan, Australia, South East Asia, Rest of Asia Pacific), Latin America and the Middle East and Africa (Brazil, Saudi Arabia, UAE, Rest of LAMEA) |
| Companies covered |
IQE Public Limited Company, Finisar Corporation, Broadcom Limited, II-VI Incorporated Coherent, Inc., Panasonic Corporation, Newport Corporation, Royal Philips Electronics N.V, Princeton Optronics Inc, Lumentum Holdings, Inc. |
Covid-19 Impact on VCSEL Market
Like many other industries, COVID-19 badly knocked the electronic and semiconductor industries. This unprecedented event has impacted nearly 230 countries in just a few weeks, resulting in the forced shutdown of manufacturing and transportation activities within and across the countries. This has directly affected the overall sector's growth. It is estimated that COVID-19 to leave more than USD 30 billion impacts on the electronics and semiconductor industry. The sector is majorly affected due to transport restrictions on major electronics and semiconductor raw material providers. However, the emerging need for semiconductors in several industries will offer rapid market recovery over the future period.
VCSEL Market Segment Overview
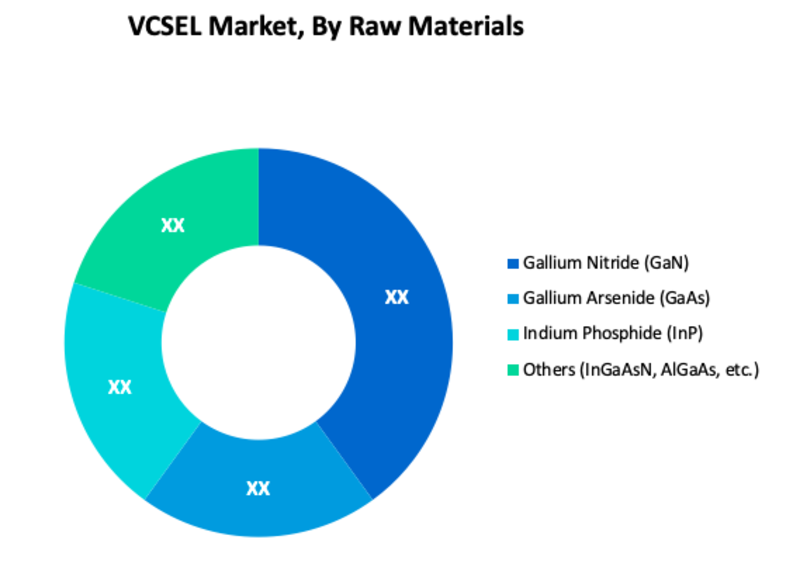
Based on Raw Materials, the Gallium arsenide (GaAs) wafer-based VCSELs held the largest share in the VCSEL market. This is due to their compatibility with cavities between 800nm and 900nm. This has allowed the raw material to gain substantial demand in the optical communications market. According to applications, Optical fiber data transmission is the major segment in the market and is anticipated to rise at a steady pace in the forecasted period. This is can be attributed to a rising network bandwidth worldwide.
VCSEL Market, By Raw Materials
· Gallium Nitride (GaN)
· Gallium Arsenide (GaAs)
· Indium Phosphide (InP)
· Others (InGaAsN, AlGaAs, etc.)
VCSEL Market, By Applications
· Optical fiber data transmission
· Analog broadband signal transmission
· Absorption Spectroscopy
· Laser printers
· Computer mice
· Biological tissue analysis
· Chip scale atomic clocks
· Others
VCSEL Market Regional Overview
Geographically, North America holds the major share in the global VCSEL market. This is due to substantial investments by the U.S. government in new VCSEL defense developments. Further, another key factor boosting the market in North America is the research undertaken by universities in this region to develop more efficient and stable laser diodes. Similarly, Europe is another key region for the VCSEL market. Moreover, the VCSEL market in the Asia Pacific is estimated to grow significantly in the forthcoming years. Many companies are often inclined to opening subsidiaries or branches in developing countries such as India to take advantage of cheap labor. Further, the speedy growth of industrial automation in Asia is increasing the demand for VCSELs in this region. In addition to this, the growing demand for computers, LED displays, and communication devices in developing APAC countries is expected to boost the VCSEL market in this region.
VCSEL Market, By Geography
· North America (US & Canada)
· Europe (UK, Germany, France, Italy, Spain, Russia & Rest of Europe)
· Asia-Pacific (Japan, China, India, Australia, & South Korea, & Rest of Asia-Pacific)
· LAMEA (Brazil, Saudi Arabia, UAE & Rest of LAMEA)
VCSEL Market Competitor overview
Some key developments and strategies adopted by manufacturers in VCSEL are highlighted below.
· In October 2021, Ouster announced that it will acquire Sense Photonics to create next generation VCSEL based LiDAR. As part of the acquisition, around 80 Sense employees will join Ouster, with Sense CEO, heading up the automotive LiDAR effort (Ouster Automotive). Ouster (OUST) went public via a SPAC merger earlier this year.
VCSEL Market, Key Players
· IQE Public Limited Company
· Finisar Corporation
· Broadcom Limited
· II-VI Incorporated
· Coherent, Inc.
· Panasonic Corporation
· Newport Corporation
· Royal Philips Electronics N.V
· Princeton Optronics Inc
· Lumentum Holdings, Inc.
Frequently Asked Questions (FAQ) :
Q1. What are the driving factors for the VCSEL market?
The growing adoption of medical applications and proximity sensing, substantial growth in the use of VCSELs for data communication, and the rising use of VCSELs in infrared illuminations are some prime factors that boost the growth of the global VCSEL market.
Q2. What are the restraining factors for the VCSEL market?
The limited data transmission range is anticipated to restrain the growth of the VCSEL market.
Q3. Which segments are covered in the VCSEL market report?
Raw Materials, Applications, and Region, these segments are covered in the VCSEL market report.
Q4. Which segment is projected to hold the largest share in the VCSEL market. ?
The Gallium arsenide (GaAs) segment is projected to hold the largest share in the VCSEL market.
Q5. Which are the prominent players in the VCSEL Market?
IQE Public Limited Company, Finisar Corporation, Broadcom Limited, II-VI Incorporated Coherent, Inc., Panasonic Corporation, Newport Corporation, Royal Philips Electronics N.V, Princeton Optronics Inc, Lumentum Holdings, Inc. are some key players in the VCSEL market.
List of Figures
Figure 1: Global VCSEL Market Revenue Breakdown (USD Billion, %) by Region, 2019 & 2027
Figure 2: Global VCSEL Market Value Share (%), By Segment 1, 2019 & 2027
Figure 3: Global VCSEL Market Forecast (USD Billion), by Sub-Segment 1, 2016-2027
Figure 4: Global VCSEL Market Forecast (USD Billion), by Sub-Segment 2, 2016-2027
Figure 5: Global VCSEL Market Value Share (%), By Segment 2, 2019 & 2027
Figure 6: Global VCSEL Market Forecast (USD Billion), by Sub-Segment 1, 2016-2027
Figure 7: Global VCSEL Market Forecast (USD Billion), by Sub-Segment 2, 2016-2027
Figure 8: Global VCSEL Market Forecast (USD Billion), by Sub-Segment 3, 2016-2027
Figure 9: Global VCSEL Market Forecast (USD Billion), by Others, 2016-2027
Figure 10: Global VCSEL Market Value Share (%), By Segment 3, 2019 & 2027
Figure 11: Global VCSEL Market Forecast (USD Billion), by Sub-Segment 1, 2016-2027
Figure 12: Global VCSEL Market Forecast (USD Billion), by Sub-Segment 2, 2016-2027
Figure 13: Global VCSEL Market Forecast (USD Billion), by Sub-Segment 3, 2016-2027
Figure 14: Global VCSEL Market Forecast (USD Billion), by Others, 2016-2027
Figure 15: Global VCSEL Market Value (USD Billion), by Region, 2019 & 2027
Figure 16: North America VCSEL Market Value Share (%), By Segment 1, 2019 & 2027
Figure 17: North America VCSEL Market Forecast (USD Billion), by Sub-Segment 1, 2016-2027
Figure 18: North America VCSEL Market Forecast (USD Billion), by Sub-Segment 2, 2016-2027
Figure 19: North America VCSEL Market Value Share (%), By Segment 2, 2019 & 2027
Figure 20: North America VCSEL Market Forecast (USD Billion), by Sub-Segment 1, 2016-2027
Figure 21: North America VCSEL Market Forecast (USD Billion), by Sub-Segment 2, 2016-2027
Figure 22: North America VCSEL Market Forecast (USD Billion), by Sub-Segment 3, 2016-2027
Figure 23: North America VCSEL Market Forecast (USD Billion), by Others, 2016-2027
Figure 24: North America VCSEL Market Value Share (%), By Segment 3, 2019 & 2027
Figure 25: North America VCSEL Market Forecast (USD Billion), by Sub-Segment 1, 2016-2027
Figure 26: North America VCSEL Market Forecast (USD Billion), by Sub-Segment 2, 2016-2027
Figure 27: North America VCSEL Market Forecast (USD Billion), by Sub-Segment 3, 2016-2027
Figure 28: North America VCSEL Market Forecast (USD Billion), by Others, 2016-2027
Figure 29: North America VCSEL Market Forecast (USD Billion), by U.S., 2016-2027
Figure 30: North America VCSEL Market Forecast (USD Billion), by Canada, 2016-2027
Figure 31: Latin America VCSEL Market Value Share (%), By Segment 1, 2019 & 2027
Figure 32: Latin America VCSEL Market Forecast (USD Billion), by Sub-Segment 1, 2016-2027
Figure 33: Latin America VCSEL Market Forecast (USD Billion), by Sub-Segment 2, 2016-2027
Figure 34: Latin America VCSEL Market Value Share (%), By Segment 2, 2019 & 2027
Figure 35: Latin America VCSEL Market Forecast (USD Billion), by Sub-Segment 1, 2016-2027
Figure 36: Latin America VCSEL Market Forecast (USD Billion), by Sub-Segment 2, 2016-2027
Figure 37: Latin America VCSEL Market Forecast (USD Billion), by Sub-Segment 3, 2016-2027
Figure 38: Latin America VCSEL Market Forecast (USD Billion), by Others, 2016-2027
Figure 39: Latin America VCSEL Market Value Share (%), By Segment 3, 2019 & 2027
Figure 40: Latin America VCSEL Market Forecast (USD Billion), by Sub-Segment 1, 2016-2027
Figure 41: Latin America VCSEL Market Forecast (USD Billion), by Sub-Segment 2, 2016-2027
Figure 42: Latin America VCSEL Market Forecast (USD Billion), by Sub-Segment 3, 2016-2027
Figure 43: Latin America VCSEL Market Forecast (USD Billion), by Others, 2016-2027
Figure 44: Latin America VCSEL Market Forecast (USD Billion), by Brazil, 2016-2027
Figure 45: Latin America VCSEL Market Forecast (USD Billion), by Mexico, 2016-2027
Figure 46: Latin America VCSEL Market Forecast (USD Billion), by Rest of Latin America, 2016-2027
Figure 47: Europe VCSEL Market Value Share (%), By Segment 1, 2019 & 2027
Figure 48: Europe VCSEL Market Forecast (USD Billion), by Sub-Segment 1, 2016-2027
Figure 49: Europe VCSEL Market Forecast (USD Billion), by Sub-Segment 2, 2016-2027
Figure 50: Europe VCSEL Market Value Share (%), By Segment 2, 2019 & 2027
Figure 51: Europe VCSEL Market Forecast (USD Billion), by Sub-Segment 1, 2016-2027
Figure 52: Europe VCSEL Market Forecast (USD Billion), by Sub-Segment 2, 2016-2027
Figure 53: Europe VCSEL Market Forecast (USD Billion), by Sub-Segment 3, 2016-2027
Figure 54: Europe VCSEL Market Forecast (USD Billion), by Others, 2016-2027
Figure 55: Europe VCSEL Market Value Share (%), By Segment 3, 2019 & 2027
Figure 56: Europe VCSEL Market Forecast (USD Billion), by Sub-Segment 1, 2016-2027
Figure 57: Europe VCSEL Market Forecast (USD Billion), by Sub-Segment 2, 2016-2027
Figure 58: Europe VCSEL Market Forecast (USD Billion), by Sub-Segment 3, 2016-2027
Figure 59: Europe VCSEL Market Forecast (USD Billion), by Others, 2016-2027
Figure 60: Europe VCSEL Market Forecast (USD Billion), by U.K., 2016-2027
Figure 61: Europe VCSEL Market Forecast (USD Billion), by Germany, 2016-2027
Figure 62: Europe VCSEL Market Forecast (USD Billion), by France, 2016-2027
Figure 63: Europe VCSEL Market Forecast (USD Billion), by Italy, 2016-2027
Figure 64: Europe VCSEL Market Forecast (USD Billion), by Spain, 2016-2027
Figure 65: Europe VCSEL Market Forecast (USD Billion), by Russia, 2016-2027
Figure 66: Europe VCSEL Market Forecast (USD Billion), by Rest of Europe, 2016-2027
Figure 67: Asia Pacific VCSEL Market Value Share (%), By Segment 1, 2019 & 2027
Figure 68: Asia Pacific VCSEL Market Forecast (USD Billion), by Sub-Segment 1, 2016-2027
Figure 69: Asia Pacific VCSEL Market Forecast (USD Billion), by Sub-Segment 2, 2016-2027
Figure 70: Asia Pacific VCSEL Market Value Share (%), By Segment 2, 2019 & 2027
Figure 71: Asia Pacific VCSEL Market Forecast (USD Billion), by Sub-Segment 1, 2016-2027
Figure 72: Asia Pacific VCSEL Market Forecast (USD Billion), by Sub-Segment 2, 2016-2027
Figure 73: Asia Pacific VCSEL Market Forecast (USD Billion), by Sub-Segment 3, 2016-2027
Figure 74: Asia Pacific VCSEL Market Forecast (USD Billion), by Others, 2016-2027
Figure 75: Asia Pacific VCSEL Market Value Share (%), By Segment 3, 2019 & 2027
Figure 76: Asia Pacific VCSEL Market Forecast (USD Billion), by Sub-Segment 1, 2016-2027
Figure 77: Asia Pacific VCSEL Market Forecast (USD Billion), by Sub-Segment 2, 2016-2027
Figure 78: Asia Pacific VCSEL Market Forecast (USD Billion), by Sub-Segment 3, 2016-2027
Figure 79: Asia Pacific VCSEL Market Forecast (USD Billion), by Others, 2016-2027
Figure 80: Asia Pacific VCSEL Market Forecast (USD Billion), by China, 2016-2027
Figure 81: Asia Pacific VCSEL Market Forecast (USD Billion), by India, 2016-2027
Figure 82: Asia Pacific VCSEL Market Forecast (USD Billion), by Japan, 2016-2027
Figure 83: Asia Pacific VCSEL Market Forecast (USD Billion), by Australia, 2016-2027
Figure 84: Asia Pacific VCSEL Market Forecast (USD Billion), by Southeast Asia, 2016-2027
Figure 85: Asia Pacific VCSEL Market Forecast (USD Billion), by Rest of Asia Pacific, 2016-2027
Figure 86: Middle East & Africa VCSEL Market Value Share (%), By Segment 1, 2019 & 2027
Figure 87: Middle East & Africa VCSEL Market Forecast (USD Billion), by Sub-Segment 1, 2016-2027
Figure 88: Middle East & Africa VCSEL Market Forecast (USD Billion), by Sub-Segment 2, 2016-2027
Figure 89: Middle East & Africa VCSEL Market Value Share (%), By Segment 2, 2019 & 2027
Figure 90: Middle East & Africa VCSEL Market Forecast (USD Billion), by Sub-Segment 1, 2016-2027
Figure 91: Middle East & Africa VCSEL Market Forecast (USD Billion), by Sub-Segment 2, 2016-2027
Figure 92: Middle East & Africa VCSEL Market Forecast (USD Billion), by Sub-Segment 3, 2016-2027
Figure 93: Middle East & Africa VCSEL Market Forecast (USD Billion), by Others, 2016-2027
Figure 94: Middle East & Africa VCSEL Market Value Share (%), By Segment 3, 2019 & 2027
Figure 95: Middle East & Africa VCSEL Market Forecast (USD Billion), by Sub-Segment 1, 2016-2027
Figure 96: Middle East & Africa VCSEL Market Forecast (USD Billion), by Sub-Segment 2, 2016-2027
Figure 97: Middle East & Africa VCSEL Market Forecast (USD Billion), by Sub-Segment 3, 2016-2027
Figure 98: Middle East & Africa VCSEL Market Forecast (USD Billion), by Others, 2016-2027
Figure 99: Middle East & Africa VCSEL Market Forecast (USD Billion), by GCC, 2016-2027
Figure 100: Middle East & Africa VCSEL Market Forecast (USD Billion), by South Africa, 2016-2027
Figure 101: Middle East & Africa VCSEL Market Forecast (USD Billion), by Rest of Middle East & Africa, 2016-2027
List of Tables
Table 1: Global VCSEL Market Revenue (USD Billion) Forecast, by Segment 1, 2016-2027
Table 2: Global VCSEL Market Revenue (USD Billion) Forecast, by Segment 2, 2016-2027
Table 3: Global VCSEL Market Revenue (USD Billion) Forecast, by Segment 3, 2016-2027
Table 4: Global VCSEL Market Revenue (USD Billion) Forecast, by Region, 2016-2027
Table 5: North America VCSEL Market Revenue (USD Billion) Forecast, by Segment 1, 2016-2027
Table 6: North America VCSEL Market Revenue (USD Billion) Forecast, by Segment 2, 2016-2027
Table 7: North America VCSEL Market Revenue (USD Billion) Forecast, by Segment 3, 2016-2027
Table 8: North America VCSEL Market Revenue (USD Billion) Forecast, by Country, 2016-2027
Table 9: Europe VCSEL Market Revenue (USD Billion) Forecast, by Segment 1, 2016-2027
Table 10: Europe VCSEL Market Revenue (USD Billion) Forecast, by Segment 2, 2016-2027
Table 11: Europe VCSEL Market Revenue (USD Billion) Forecast, by Segment 3, 2016-2027
Table 12: Europe VCSEL Market Revenue (USD Billion) Forecast, by Country, 2016-2027
Table 13: Latin America VCSEL Market Revenue (USD Billion) Forecast, by Segment 1, 2016-2027
Table 14: Latin America VCSEL Market Revenue (USD Billion) Forecast, by Segment 2, 2016-2027
Table 15: Latin America VCSEL Market Revenue (USD Billion) Forecast, by Segment 3, 2016-2027
Table 16: Latin America VCSEL Market Revenue (USD Billion) Forecast, by Country, 2016-2027
Table 17: Asia Pacific VCSEL Market Revenue (USD Billion) Forecast, by Segment 1, 2016-2027
Table 18: Asia Pacific VCSEL Market Revenue (USD Billion) Forecast, by Segment 2, 2016-2027
Table 19: Asia Pacific VCSEL Market Revenue (USD Billion) Forecast, by Segment 3, 2016-2027
Table 20: Asia Pacific VCSEL Market Revenue (USD Billion) Forecast, by Country, 2016-2027
Table 21: Middle East & Africa VCSEL Market Revenue (USD Billion) Forecast, by Segment 1, 2016-2027
Table 22: Middle East & Africa VCSEL Market Revenue (USD Billion) Forecast, by Segment 2, 2016-2027
Table 23: Middle East & Africa VCSEL Market Revenue (USD Billion) Forecast, by Segment 3, 2016-2027
Table 24: Middle East & Africa VCSEL Market Revenue (USD Billion) Forecast, by Country, 2016-2027
Research Process
Data Library Research are conducted by industry experts who offer insight on
industry structure, market segmentations technology assessment and competitive landscape (CL), and penetration, as well as on emerging trends. Their analysis is based on primary interviews (~ 80%) and secondary research (~ 20%) as well as years of professional expertise in their respective industries. Adding to this, by analysing historical trends and current market positions, our analysts predict where the market will be headed for the next five years. Furthermore, the varying trends of segment & categories geographically presented are also studied and the estimated based on the primary & secondary research.
In this particular report from the supply side Data Library Research has conducted primary surveys (interviews) with the key level executives (VP, CEO’s, Marketing Director, Business Development Manager
and SOFT) of the companies that active & prominent as well as the midsized organization
FIGURE 1: DLR RESEARH PROCESS
![research-methodology1]()
Primary Research
Extensive primary research was conducted to gain a deeper insight of the market and industry performance. The analysis is based on both primary and secondary research as well as years of professional expertise in the respective industries.
In addition to analysing current and historical trends, our analysts predict where the market is headed over the next five years.
It varies by segment for these categories geographically presented in the list of market tables. Speaking about this particular report we have conducted primary surveys (interviews) with the key level executives (VP, CEO’s, Marketing Director, Business Development Manager and many more) of the major players active in the market.
Secondary Research
Secondary research was mainly used to collect and identify information useful for the extensive, technical, market-oriented, and Friend’s study of the Global Extra Neutral Alcohol. It was also used to obtain key information about major players, market classification and segmentation according to the industry trends, geographical markets, and developments related to the market and technology perspectives. For this study, analysts have gathered information from various credible sources, such as annual reports, sec filings, journals, white papers, SOFT presentations, and company web sites.
Market Size Estimation
Both, top-down and bottom-up approaches were used to estimate and validate the size of the Global market and to estimate the size of various other dependent submarkets in the overall Extra Neutral Alcohol. The key players in the market were identified through secondary research and their market contributions in the respective geographies were determined through primary and secondary research.
Forecast Model
![research-methodology2]()