Video Conferencing Endpoint Market Overview
Managing outsourced businesses in a worldwide setting is a significant aspect that is predicted to drive the global Video Conferencing Endpoint market forward. Due to increased globalization, companies from several verticals aspire to operate from multiple offices in different parts of the world in order to take advantage of local infrastructure, expertise, and lower material procurement prices.
To ensure the effective operation of several offices around the world, organizations must maintain continual communication between headquarters and other offices operating remotely. Over the last few decades, business outsourcing has exploded. Many business owners are now eager to employ Video Conferencing Endpoint solutions in order to boost their company's efficiency and nurture real-time, face-to-face engagement from anywhere on the planet.
Organizations can encourage their employees to access data, discuss projects, exchange ideas, and solve problems by implementing video solutions. As a result of the growing requirement to cut operational expenses and time spent traveling to such sites, Video Conferencing Endpoint solutions have become increasingly popular. All these aforementioned aspects are majorly contributing to the growth of the Global Video Conferencing Endpoint Market.
| Report Metric |
Details |
| Market size available for years |
2023–2030 |
| Base year considered |
2023 |
| Forecast period |
2024–2030 |
| Forecast unit |
Value (USD Million) |
| Segments covered |
Component, End-use Industry, and Region. |
| Regions covered |
North America (the U.S. and Canada), Europe (UK, Germany, France, Italy, Spain, Russia, Rest of Europe), Asia-Pacific (China, India, Japan, Australia, South East Asia, Rest of Asia Pacific), Latin America and the Middle East and Africa (Brazil, Saudi Arabia, UAE, Rest of LAMEA) |
| Companies covered |
Adobe Systems Incorporated., Atlassian Corporation Plc., Cisco Systems, Inc., Fuze, Inc., Huawei Technologies Co., Ltd., JOYCE CR, S.R.O., Logitech International S.A., LogMeIn, Inc., Microsoft Corporation, Orange Business Services, Polycom, Inc., Vidyo, Inc.,Visual Systems Group, Inc. (VSGi), West Corporation, ZTE Corporation. |
Covid-19 Impact on Video Conferencing Endpoint Market
Like many other industries, COVID-19 badly knocked the electronic and semiconductor industries. This unprecedented event has impacted nearly 230 countries in just a few weeks, resulting in the forced shutdown of manufacturing and transportation activities within and across the countries. This has directly affected the overall sector's growth. It is estimated that COVID-19 to leave more than USD 30 billion impacts on the electronics and semiconductor industry. The sector is majorly affected due to transport restrictions on major electronics and semiconductor raw material providers. However, the emerging need for semiconductors in several industries will offer rapid market recovery over the future period.
Video Conferencing Endpoint Market Segment Overview
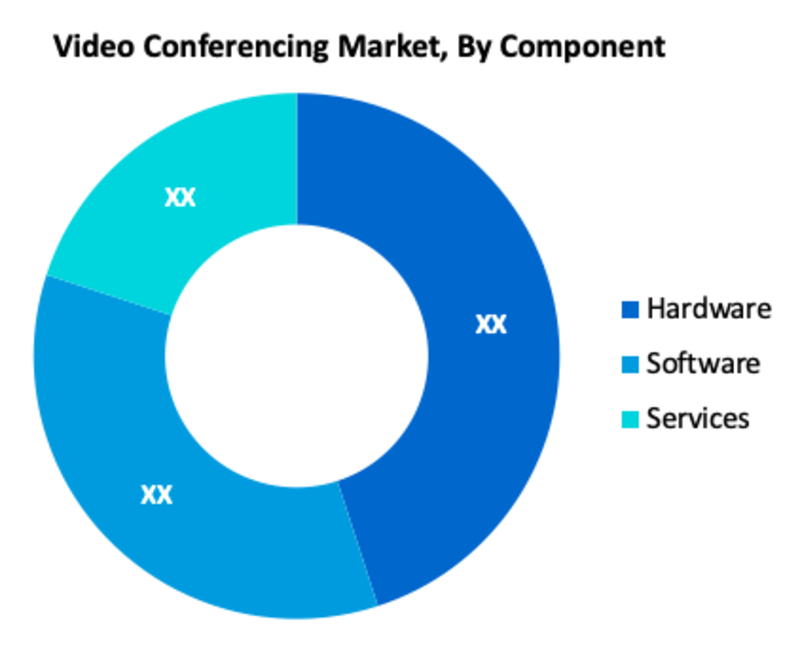
In terms of components, the Hardware segment had a higher market share, delivering the most revenue to the market. During the projected period, this segment is expected to grow at a stable CAGR. High-priced end-points, such as high-definition (HD) monitors, cameras, and microphones, as well as dedicated Video Conferencing Endpoint networks, have accounted for a significant amount of overall Video Conferencing Endpoint industry revenue. Moreover, during the projection period, the software segment is expected to grow at a substantial CAGR. Because of the growing demand for cloud-based Video Conferencing Endpoint solutions around the world, the software segment's CAGR is strong. The use of cloud-based Video Conferencing Endpoint systems is now low, but it is predicted to skyrocket in the future years.
Video Conferencing Endpoint Market, By Component
· Hardware
· Software
· Services
Video Conferencing Endpoint Market, By End-Use Industry
· Corporate Enterprise
· Healthcare
· Government & Defense
· Education
· Others
Video Conferencing Endpoint Market Regional Overview
In terms of geography, the global Video Conferencing Endpoint market is classified into North America, Europe, Asia Pacific, South America, Middle East & Africa. The Asia Pacific is one of the most prominent regions for the global Video Conferencing Endpoint market. The Asia Pacific will remain at the forefront of global demand, with the region's market predicted to increase at a faster rate than the rest of the world over the projection period. A variety of macroeconomic and industry-specific factors will continue to influence the global Video Conferencing Endpoint market.
Video Conferencing Endpoint Market, By Geography
· North America (US & Canada)
· Europe (UK, Germany, France, Italy, Spain, Russia & Rest of Europe)
· Asia-Pacific (Japan, China, India, Australia, & South Korea, & Rest of Asia-Pacific)
· LAMEA (Brazil, Saudi Arabia, UAE & Rest of LAMEA)
Video Conferencing Endpoint Market, Key Players
· Adobe Systems Incorporated.
· Atlassian Corporation Plc.
· Cisco Systems, Inc.
· Fuze, Inc.
· Huawei Technologies Co., Ltd.
· JOYCE CR, S.R.O.
· Logitech International S.A.
· LogMeIn, Inc.
· Microsoft Corporation
· Orange Business Services
· Polycom, Inc.
· Vidyo, Inc.
· Visual Systems Group, Inc. (VSGi)
· West Corporation
· ZTE Corporation.
Frequently Asked Questions (FAQ) :
Q1. What are the driving factors for the global Video Conferencing market?
Managing outsourced businesses in a worldwide setting is a significant aspect that is predicted to drive the global video conferencing market forward
Q2. Which Segments are covered in the global Video Conferencing market report?
Component, End-use Industry, and Region. these segments are covered in the global Video Conferencing market report
Q3. Which segment is projected to hold the largest share in the global Video Conferencing market?
The hardware segment is projected to hold the largest share in the global Video Conferencing market.
Q4. Which region holds the largest share in the global Video Conferencing market?
Asia Pacific holds the largest share in the global Video Conferencing market
Q5. Which are the prominent players in the global Video Conferencing market?
Adobe Systems Incorporated., Atlassian Corporation Plc., Cisco Systems, Inc., Fuze, Inc., Huawei Technologies Co., Ltd., JOYCE CR, S.R.O., Logitech International S.A., LogMeIn, Inc., Microsoft Corporation, Orange Business Services, Polycom, Inc., Vidyo, Inc., Visual Systems Group, Inc. (VSGi), West Corporation, ZTE Corporation. are some key players in the global Video Conferencing market
List of Figures
Figure 1: Global Video Conferencing Endpoint Endpoint Market Revenue Breakdown (USD Billion, %) by Region, 2019 & 2027
Figure 2: Global Video Conferencing Endpoint Endpoint Market Value Share (%), By Segment 1, 2019 & 2027
Figure 3: Global Video Conferencing Endpoint Endpoint Market Forecast (USD Billion), by Sub-Segment 1, 2016-2027
Figure 4: Global Video Conferencing Endpoint Endpoint Market Forecast (USD Billion), by Sub-Segment 2, 2016-2027
Figure 5: Global Video Conferencing Endpoint Endpoint Market Value Share (%), By Segment 2, 2019 & 2027
Figure 6: Global Video Conferencing Endpoint Endpoint Market Forecast (USD Billion), by Sub-Segment 1, 2016-2027
Figure 7: Global Video Conferencing Endpoint Endpoint Market Forecast (USD Billion), by Sub-Segment 2, 2016-2027
Figure 8: Global Video Conferencing Endpoint Endpoint Market Forecast (USD Billion), by Sub-Segment 3, 2016-2027
Figure 9: Global Video Conferencing Endpoint Endpoint Market Forecast (USD Billion), by Others, 2016-2027
Figure 10: Global Video Conferencing Endpoint Endpoint Market Value Share (%), By Segment 3, 2019 & 2027
Figure 11: Global Video Conferencing Endpoint Endpoint Market Forecast (USD Billion), by Sub-Segment 1, 2016-2027
Figure 12: Global Video Conferencing Endpoint Endpoint Market Forecast (USD Billion), by Sub-Segment 2, 2016-2027
Figure 13: Global Video Conferencing Endpoint Endpoint Market Forecast (USD Billion), by Sub-Segment 3, 2016-2027
Figure 14: Global Video Conferencing Endpoint Endpoint Market Forecast (USD Billion), by Others, 2016-2027
Figure 15: Global Video Conferencing Endpoint Endpoint Market Value (USD Billion), by Region, 2019 & 2027
Figure 16: North America Video Conferencing Endpoint Endpoint Market Value Share (%), By Segment 1, 2019 & 2027
Figure 17: North America Video Conferencing Endpoint Endpoint Market Forecast (USD Billion), by Sub-Segment 1, 2016-2027
Figure 18: North America Video Conferencing Endpoint Endpoint Market Forecast (USD Billion), by Sub-Segment 2, 2016-2027
Figure 19: North America Video Conferencing Endpoint Endpoint Market Value Share (%), By Segment 2, 2019 & 2027
Figure 20: North America Video Conferencing Endpoint Endpoint Market Forecast (USD Billion), by Sub-Segment 1, 2016-2027
Figure 21: North America Video Conferencing Endpoint Endpoint Market Forecast (USD Billion), by Sub-Segment 2, 2016-2027
Figure 22: North America Video Conferencing Endpoint Endpoint Market Forecast (USD Billion), by Sub-Segment 3, 2016-2027
Figure 23: North America Video Conferencing Endpoint Endpoint Market Forecast (USD Billion), by Others, 2016-2027
Figure 24: North America Video Conferencing Endpoint Endpoint Market Value Share (%), By Segment 3, 2019 & 2027
Figure 25: North America Video Conferencing Endpoint Endpoint Market Forecast (USD Billion), by Sub-Segment 1, 2016-2027
Figure 26: North America Video Conferencing Endpoint Endpoint Market Forecast (USD Billion), by Sub-Segment 2, 2016-2027
Figure 27: North America Video Conferencing Endpoint Endpoint Market Forecast (USD Billion), by Sub-Segment 3, 2016-2027
Figure 28: North America Video Conferencing Endpoint Endpoint Market Forecast (USD Billion), by Others, 2016-2027
Figure 29: North America Video Conferencing Endpoint Endpoint Market Forecast (USD Billion), by U.S., 2016-2027
Figure 30: North America Video Conferencing Endpoint Endpoint Market Forecast (USD Billion), by Canada, 2016-2027
Figure 31: Latin America Video Conferencing Endpoint Endpoint Market Value Share (%), By Segment 1, 2019 & 2027
Figure 32: Latin America Video Conferencing Endpoint Endpoint Market Forecast (USD Billion), by Sub-Segment 1, 2016-2027
Figure 33: Latin America Video Conferencing Endpoint Endpoint Market Forecast (USD Billion), by Sub-Segment 2, 2016-2027
Figure 34: Latin America Video Conferencing Endpoint Endpoint Market Value Share (%), By Segment 2, 2019 & 2027
Figure 35: Latin America Video Conferencing Endpoint Endpoint Market Forecast (USD Billion), by Sub-Segment 1, 2016-2027
Figure 36: Latin America Video Conferencing Endpoint Endpoint Market Forecast (USD Billion), by Sub-Segment 2, 2016-2027
Figure 37: Latin America Video Conferencing Endpoint Endpoint Market Forecast (USD Billion), by Sub-Segment 3, 2016-2027
Figure 38: Latin America Video Conferencing Endpoint Endpoint Market Forecast (USD Billion), by Others, 2016-2027
Figure 39: Latin America Video Conferencing Endpoint Endpoint Market Value Share (%), By Segment 3, 2019 & 2027
Figure 40: Latin America Video Conferencing Endpoint Endpoint Market Forecast (USD Billion), by Sub-Segment 1, 2016-2027
Figure 41: Latin America Video Conferencing Endpoint Endpoint Market Forecast (USD Billion), by Sub-Segment 2, 2016-2027
Figure 42: Latin America Video Conferencing Endpoint Endpoint Market Forecast (USD Billion), by Sub-Segment 3, 2016-2027
Figure 43: Latin America Video Conferencing Endpoint Endpoint Market Forecast (USD Billion), by Others, 2016-2027
Figure 44: Latin America Video Conferencing Endpoint Endpoint Market Forecast (USD Billion), by Brazil, 2016-2027
Figure 45: Latin America Video Conferencing Endpoint Endpoint Market Forecast (USD Billion), by Mexico, 2016-2027
Figure 46: Latin America Video Conferencing Endpoint Endpoint Market Forecast (USD Billion), by Rest of Latin America, 2016-2027
Figure 47: Europe Video Conferencing Endpoint Endpoint Market Value Share (%), By Segment 1, 2019 & 2027
Figure 48: Europe Video Conferencing Endpoint Endpoint Market Forecast (USD Billion), by Sub-Segment 1, 2016-2027
Figure 49: Europe Video Conferencing Endpoint Endpoint Market Forecast (USD Billion), by Sub-Segment 2, 2016-2027
Figure 50: Europe Video Conferencing Endpoint Endpoint Market Value Share (%), By Segment 2, 2019 & 2027
Figure 51: Europe Video Conferencing Endpoint Endpoint Market Forecast (USD Billion), by Sub-Segment 1, 2016-2027
Figure 52: Europe Video Conferencing Endpoint Endpoint Market Forecast (USD Billion), by Sub-Segment 2, 2016-2027
Figure 53: Europe Video Conferencing Endpoint Endpoint Market Forecast (USD Billion), by Sub-Segment 3, 2016-2027
Figure 54: Europe Video Conferencing Endpoint Endpoint Market Forecast (USD Billion), by Others, 2016-2027
Figure 55: Europe Video Conferencing Endpoint Endpoint Market Value Share (%), By Segment 3, 2019 & 2027
Figure 56: Europe Video Conferencing Endpoint Endpoint Market Forecast (USD Billion), by Sub-Segment 1, 2016-2027
Figure 57: Europe Video Conferencing Endpoint Endpoint Market Forecast (USD Billion), by Sub-Segment 2, 2016-2027
Figure 58: Europe Video Conferencing Endpoint Endpoint Market Forecast (USD Billion), by Sub-Segment 3, 2016-2027
Figure 59: Europe Video Conferencing Endpoint Endpoint Market Forecast (USD Billion), by Others, 2016-2027
Figure 60: Europe Video Conferencing Endpoint Endpoint Market Forecast (USD Billion), by U.K., 2016-2027
Figure 61: Europe Video Conferencing Endpoint Endpoint Market Forecast (USD Billion), by Germany, 2016-2027
Figure 62: Europe Video Conferencing Endpoint Endpoint Market Forecast (USD Billion), by France, 2016-2027
Figure 63: Europe Video Conferencing Endpoint Endpoint Market Forecast (USD Billion), by Italy, 2016-2027
Figure 64: Europe Video Conferencing Endpoint Endpoint Market Forecast (USD Billion), by Spain, 2016-2027
Figure 65: Europe Video Conferencing Endpoint Endpoint Market Forecast (USD Billion), by Russia, 2016-2027
Figure 66: Europe Video Conferencing Endpoint Endpoint Market Forecast (USD Billion), by Rest of Europe, 2016-2027
Figure 67: Asia Pacific Video Conferencing Endpoint Endpoint Market Value Share (%), By Segment 1, 2019 & 2027
Figure 68: Asia Pacific Video Conferencing Endpoint Endpoint Market Forecast (USD Billion), by Sub-Segment 1, 2016-2027
Figure 69: Asia Pacific Video Conferencing Endpoint Endpoint Market Forecast (USD Billion), by Sub-Segment 2, 2016-2027
Figure 70: Asia Pacific Video Conferencing Endpoint Endpoint Market Value Share (%), By Segment 2, 2019 & 2027
Figure 71: Asia Pacific Video Conferencing Endpoint Endpoint Market Forecast (USD Billion), by Sub-Segment 1, 2016-2027
Figure 72: Asia Pacific Video Conferencing Endpoint Endpoint Market Forecast (USD Billion), by Sub-Segment 2, 2016-2027
Figure 73: Asia Pacific Video Conferencing Endpoint Endpoint Market Forecast (USD Billion), by Sub-Segment 3, 2016-2027
Figure 74: Asia Pacific Video Conferencing Endpoint Endpoint Market Forecast (USD Billion), by Others, 2016-2027
Figure 75: Asia Pacific Video Conferencing Endpoint Endpoint Market Value Share (%), By Segment 3, 2019 & 2027
Figure 76: Asia Pacific Video Conferencing Endpoint Endpoint Market Forecast (USD Billion), by Sub-Segment 1, 2016-2027
Figure 77: Asia Pacific Video Conferencing Endpoint Endpoint Market Forecast (USD Billion), by Sub-Segment 2, 2016-2027
Figure 78: Asia Pacific Video Conferencing Endpoint Endpoint Market Forecast (USD Billion), by Sub-Segment 3, 2016-2027
Figure 79: Asia Pacific Video Conferencing Endpoint Endpoint Market Forecast (USD Billion), by Others, 2016-2027
Figure 80: Asia Pacific Video Conferencing Endpoint Endpoint Market Forecast (USD Billion), by China, 2016-2027
Figure 81: Asia Pacific Video Conferencing Endpoint Endpoint Market Forecast (USD Billion), by India, 2016-2027
Figure 82: Asia Pacific Video Conferencing Endpoint Endpoint Market Forecast (USD Billion), by Japan, 2016-2027
Figure 83: Asia Pacific Video Conferencing Endpoint Endpoint Market Forecast (USD Billion), by Australia, 2016-2027
Figure 84: Asia Pacific Video Conferencing Endpoint Endpoint Market Forecast (USD Billion), by Southeast Asia, 2016-2027
Figure 85: Asia Pacific Video Conferencing Endpoint Endpoint Market Forecast (USD Billion), by Rest of Asia Pacific, 2016-2027
Figure 86: Middle East & Africa Video Conferencing Endpoint Endpoint Market Value Share (%), By Segment 1, 2019 & 2027
Figure 87: Middle East & Africa Video Conferencing Endpoint Endpoint Market Forecast (USD Billion), by Sub-Segment 1, 2016-2027
Figure 88: Middle East & Africa Video Conferencing Endpoint Endpoint Market Forecast (USD Billion), by Sub-Segment 2, 2016-2027
Figure 89: Middle East & Africa Video Conferencing Endpoint Endpoint Market Value Share (%), By Segment 2, 2019 & 2027
Figure 90: Middle East & Africa Video Conferencing Endpoint Endpoint Market Forecast (USD Billion), by Sub-Segment 1, 2016-2027
Figure 91: Middle East & Africa Video Conferencing Endpoint Endpoint Market Forecast (USD Billion), by Sub-Segment 2, 2016-2027
Figure 92: Middle East & Africa Video Conferencing Endpoint Endpoint Market Forecast (USD Billion), by Sub-Segment 3, 2016-2027
Figure 93: Middle East & Africa Video Conferencing Endpoint Endpoint Market Forecast (USD Billion), by Others, 2016-2027
Figure 94: Middle East & Africa Video Conferencing Endpoint Endpoint Market Value Share (%), By Segment 3, 2019 & 2027
Figure 95: Middle East & Africa Video Conferencing Endpoint Endpoint Market Forecast (USD Billion), by Sub-Segment 1, 2016-2027
Figure 96: Middle East & Africa Video Conferencing Endpoint Endpoint Market Forecast (USD Billion), by Sub-Segment 2, 2016-2027
Figure 97: Middle East & Africa Video Conferencing Endpoint Endpoint Market Forecast (USD Billion), by Sub-Segment 3, 2016-2027
Figure 98: Middle East & Africa Video Conferencing Endpoint Endpoint Market Forecast (USD Billion), by Others, 2016-2027
Figure 99: Middle East & Africa Video Conferencing Endpoint Endpoint Market Forecast (USD Billion), by GCC, 2016-2027
Figure 100: Middle East & Africa Video Conferencing Endpoint Endpoint Market Forecast (USD Billion), by South Africa, 2016-2027
Figure 101: Middle East & Africa Video Conferencing Endpoint Endpoint Market Forecast (USD Billion), by Rest of Middle East & Africa, 2016-2027
List of Tables
Table 1: Global Video Conferencing Endpoint Endpoint Market Revenue (USD Billion) Forecast, by Segment 1, 2016-2027
Table 2: Global Video Conferencing Endpoint Endpoint Market Revenue (USD Billion) Forecast, by Segment 2, 2016-2027
Table 3: Global Video Conferencing Endpoint Endpoint Market Revenue (USD Billion) Forecast, by Segment 3, 2016-2027
Table 4: Global Video Conferencing Endpoint Endpoint Market Revenue (USD Billion) Forecast, by Region, 2016-2027
Table 5: North America Video Conferencing Endpoint Endpoint Market Revenue (USD Billion) Forecast, by Segment 1, 2016-2027
Table 6: North America Video Conferencing Endpoint Endpoint Market Revenue (USD Billion) Forecast, by Segment 2, 2016-2027
Table 7: North America Video Conferencing Endpoint Endpoint Market Revenue (USD Billion) Forecast, by Segment 3, 2016-2027
Table 8: North America Video Conferencing Endpoint Endpoint Market Revenue (USD Billion) Forecast, by Country, 2016-2027
Table 9: Europe Video Conferencing Endpoint Endpoint Market Revenue (USD Billion) Forecast, by Segment 1, 2016-2027
Table 10: Europe Video Conferencing Endpoint Endpoint Market Revenue (USD Billion) Forecast, by Segment 2, 2016-2027
Table 11: Europe Video Conferencing Endpoint Endpoint Market Revenue (USD Billion) Forecast, by Segment 3, 2016-2027
Table 12: Europe Video Conferencing Endpoint Endpoint Market Revenue (USD Billion) Forecast, by Country, 2016-2027
Table 13: Latin America Video Conferencing Endpoint Endpoint Market Revenue (USD Billion) Forecast, by Segment 1, 2016-2027
Table 14: Latin America Video Conferencing Endpoint Endpoint Market Revenue (USD Billion) Forecast, by Segment 2, 2016-2027
Table 15: Latin America Video Conferencing Endpoint Endpoint Market Revenue (USD Billion) Forecast, by Segment 3, 2016-2027
Table 16: Latin America Video Conferencing Endpoint Endpoint Market Revenue (USD Billion) Forecast, by Country, 2016-2027
Table 17: Asia Pacific Video Conferencing Endpoint Endpoint Market Revenue (USD Billion) Forecast, by Segment 1, 2016-2027
Table 18: Asia Pacific Video Conferencing Endpoint Endpoint Market Revenue (USD Billion) Forecast, by Segment 2, 2016-2027
Table 19: Asia Pacific Video Conferencing Endpoint Endpoint Market Revenue (USD Billion) Forecast, by Segment 3, 2016-2027
Table 20: Asia Pacific Video Conferencing Endpoint Endpoint Market Revenue (USD Billion) Forecast, by Country, 2016-2027
Table 21: Middle East & Africa Video Conferencing Endpoint Endpoint Market Revenue (USD Billion) Forecast, by Segment 1, 2016-2027
Table 22: Middle East & Africa Video Conferencing Endpoint Endpoint Market Revenue (USD Billion) Forecast, by Segment 2, 2016-2027
Table 23: Middle East & Africa Video Conferencing Endpoint Endpoint Market Revenue (USD Billion) Forecast, by Segment 3, 2016-2027
Table 24: Middle East & Africa Video Conferencing Endpoint Endpoint Market Revenue (USD Billion) Forecast, by Country, 2016-2027
Research Process
Data Library Research are conducted by industry experts who offer insight on
industry structure, market segmentations technology assessment and competitive landscape (CL), and penetration, as well as on emerging trends. Their analysis is based on primary interviews (~ 80%) and secondary research (~ 20%) as well as years of professional expertise in their respective industries. Adding to this, by analysing historical trends and current market positions, our analysts predict where the market will be headed for the next five years. Furthermore, the varying trends of segment & categories geographically presented are also studied and the estimated based on the primary & secondary research.
In this particular report from the supply side Data Library Research has conducted primary surveys (interviews) with the key level executives (VP, CEO’s, Marketing Director, Business Development Manager
and SOFT) of the companies that active & prominent as well as the midsized organization
FIGURE 1: DLR RESEARH PROCESS

Primary Research
Extensive primary research was conducted to gain a deeper insight of the market and industry performance. The analysis is based on both primary and secondary research as well as years of professional expertise in the respective industries.
In addition to analysing current and historical trends, our analysts predict where the market is headed over the next five years.
It varies by segment for these categories geographically presented in the list of market tables. Speaking about this particular report we have conducted primary surveys (interviews) with the key level executives (VP, CEO’s, Marketing Director, Business Development Manager and many more) of the major players active in the market.
Secondary Research
Secondary research was mainly used to collect and identify information useful for the extensive, technical, market-oriented, and Friend’s study of the Global Extra Neutral Alcohol. It was also used to obtain key information about major players, market classification and segmentation according to the industry trends, geographical markets, and developments related to the market and technology perspectives. For this study, analysts have gathered information from various credible sources, such as annual reports, sec filings, journals, white papers, SOFT presentations, and company web sites.
Market Size Estimation
Both, top-down and bottom-up approaches were used to estimate and validate the size of the Global market and to estimate the size of various other dependent submarkets in the overall Extra Neutral Alcohol. The key players in the market were identified through secondary research and their market contributions in the respective geographies were determined through primary and secondary research.
Forecast Model
