Get Complete Analysis Of The Report - Download Updated Free Sample PDF
The Global Virtual Drug Discovery Service Market involves companies that provide advanced computational and AI-driven services to pharmaceutical and biotech firms worldwide. These services, such as virtual screening and molecular modeling, help identify and optimize potential new drug candidates faster and more cost-effectively than traditional lab-based methods. Essentially, it is the outsourcing of early-stage drug R&D using cutting-edge digital technology.
Key factors fueling this growth include the integration of AI and machine learning, which enables faster and more accurate predictions of drug efficacy and safety, reducing reliance on traditional animal testing. Virtual platforms offer high-throughput screening and in-silico modeling, decreasing both time and costs associated with early-stage drug development.
The global Virtual Drug Discovery Service market is experiencing transformative advancements in 2025, primarily driven by the integration of artificial intelligence (AI) and machine learning technologies. These innovations are revolutionizing various stages of drug discovery, including target identification, lead optimization, and clinical trial design. For instance, AI is facilitating the rapid design and optimization of peptide-based therapeutics, expediting the transition from concept to candidate selection. The adoption of Software-as-a-Service (SaaS) platforms in drug discovery is also on the rise, offering scalable and cost-effective solutions for computational modeling, data analysis, and collaboration. These cloud-based platforms are enhancing accessibility for smaller biotech firms and fostering innovation through shared resources and expertise.
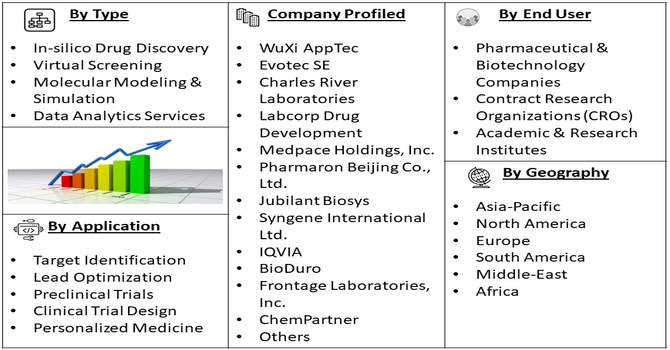
Segmentation: Global Virtual Drug Discovery Service Market is segmented By Service Type (In-silico Drug Discovery, Virtual Screening, Molecular Modeling & Simulation, and Data Analytics Services), Technology (Artificial Intelligence (AI) & Machine Learning (ML), Cloud Computing, Big Data Analytics, and Quantum Computing), Application (Target Identification, Lead Optimization, Preclinical Trials, Clinical Trial Design, and Personalized Medicine), End-User (Pharmaceutical & Biotechnology Companies, Contract Research Organizations (CROs), and Academic & Research Institutes), and Geography (North America, Europe, Asia-Pacific, Middle East and Africa, and South America). The report provides the value (in USD million) for the above segments.
For Detailed Market Segmentation - Get a Free Sample PDF
Market Drivers:
The adoption of AI and ML technologies is transforming drug discovery by enabling rapid and accurate predictions of drug-target interactions, toxicity, and efficacy. These technologies reduce the reliance on traditional laboratory experiments, lower costs, shorten development timelines, and improve the success rate of identifying viable drug candidates. For instance, in May 2024, Google DeepMind introduced the third version of its AlphaFold AI model, designed to accelerate drug discovery and improve disease targeting. This upgraded version enables researchers at DeepMind and Isomorphic Labs to accurately predict the behavior of all molecules, including human DNA. The launch marks a major advancement in the integration of Artificial Intelligence (AI) and Machine Learning (ML) within life sciences, significantly enhancing the capabilities of virtual drug discovery. It is expected to drive growth in the global virtual drug discovery service market by streamlining research and reducing development timelines.
The pharmaceutical industry faces increasing pressure to bring drugs to market faster and at lower costs. Virtual drug discovery services, including in-silico modeling, virtual screening, and molecular simulations, allow companies to accelerate early-stage drug development, optimize resources, and minimize the financial and time burdens associated with conventional experimental approaches.
In June 2025, NVIDIA announced a collaboration with Novo Nordisk to advance drug discovery using innovative AI applications. The partnership supported Novo Nordisk’s use of the Gefion sovereign AI supercomputer through an agreement with DCAI. Together, they developed customized AI models for early research and clinical development, leveraging advanced simulations and physical AI technologies. This collaboration strengthened the global virtual drug discovery service market by enhancing AI-driven research capabilities and accelerating drug development.
Market Restraints:
The integration of artificial intelligence (AI) in drug discovery raises concerns regarding data privacy, algorithm transparency, and ethical considerations. The absence of standardized regulations and guidelines for AI applications in drug development can lead to inconsistencies in data handling and decision-making processes, potentially delaying the adoption of virtual drug discovery services. To address these challenges, there is an increasing push for the development of clear regulatory frameworks and ethical standards governing AI use in drug discovery. Establishing guidelines around data governance, model validation, and transparency will be crucial in building trust among stakeholders, including researchers, pharmaceutical companies, and regulatory bodies. As these frameworks evolve, they are expected to reduce barriers to adoption and foster wider acceptance of virtual drug discovery services, ultimately accelerating innovation while ensuring responsible use of AI technologies.
The Global Virtual Drug Discovery Service Market is a significant socio-economic force, primarily by addressing the formidable economic challenge of escalating pharmaceutical Research and Development (R&D) costs and lengthy timelines. Economically, the adoption of virtual services, heavily leveraging Artificial Intelligence (AI) and computational drug discovery, drastically reduces the failure rate of early-stage candidates, cutting down pre-clinical costs and accelerating the time-to-market for new therapies, thereby improving the Return on Investment (ROI) for biopharma companies. Socially, this efficiency translates directly into a public health benefit: the rapid, cost-effective identification of novel molecules, particularly for chronic and rare diseases like oncology and neurological disorders, allows life-saving or life-improving medicines to reach patients faster, ultimately lowering the disease burden and increasing overall global health equity and life expectancy.
Segmental Analysis:
In-silico drug discovery is a computational approach that simulates biological processes to identify and optimize potential drug candidates. It significantly reduces the time and cost of early-stage drug development by predicting drug-target interactions, assessing toxicity, and prioritizing compounds for further testing. The integration of AI and machine learning enhances accuracy and allows rapid iteration, making it the fastest-growing service type in the market.
As pharmaceutical companies face increasing pressure to accelerate pipelines and reduce R&D expenses, in-silico drug discovery is emerging as a key strategic tool. Its ability to virtually screen large compound libraries and model complex biological systems enables researchers to make informed decisions earlier in the development process. Moreover, its scalability and adaptability across therapeutic areas make it highly attractive for both large firms and startups. With continued advancements in computing power and AI algorithms, the adoption of in-silico methods is expected to surge, further propelling growth in the global virtual drug discovery service market.
AI and ML technologies are transforming drug discovery by enabling predictive modeling, virtual screening, and lead optimization. These technologies can analyze large datasets, identify patterns, and forecast biological responses, which accelerates target identification and reduces reliance on traditional lab experiments. Their adoption improves efficiency, accuracy, and success rates in drug development. For instance, in April 2024, Xaira Therapeutics, an AI-driven drug discovery and development firm, secured over USD 1 million in a joint funding round led by ARCH Venture Partners and Foresite Labs. The company leverages machine learning, data generation technologies, and therapeutic development strategies to address drug targets that have historically been difficult to treat.
Target identification is a crucial step in the drug discovery process that involves pinpointing biological molecules responsible for disease progression. Virtual drug discovery platforms leverage computational tools and AI to identify and validate potential targets quickly and accurately, facilitating the development of more effective therapies and reducing the probability of late-stage failures. Advancements in bioinformatics, genomics, and AI-driven data analysis have significantly enhanced the precision of target identification in virtual drug discovery. By analyzing vast datasets from clinical studies, genetic profiles, and biological pathways, these platforms can uncover novel targets that may be overlooked by traditional methods. This not only accelerates early-stage research but also improves the likelihood of clinical success by focusing efforts on highly relevant and actionable biological mechanisms, ultimately strengthening the overall efficiency and impact of drug development pipelines.
Pharmaceutical and biotechnology companies are the primary users of virtual drug discovery services. These organizations leverage computational models and AI-driven platforms to streamline research and development, minimize costs, accelerate timelines, and enhance the probability of developing successful drug candidates. Their substantial R&D investments make them the largest contributor to market growth.
The North America region is expected to witness the highest growth in the Global Virtual Drug Discovery Service market over the forecast period. This growth is driven by the presence of major pharmaceutical and biotechnology companies, advanced technological infrastructure, and substantial investments in research and development. The region benefits from the early adoption of artificial intelligence (AI), machine learning (ML), and cloud-based platforms, which enhance drug discovery efficiency and reduce development timelines.
Additionally, supportive regulatory frameworks, including encouragement from the U.S. FDA for computational modeling and AI-driven drug development, are accelerating market adoption. For instance, in May 2023, Google launched two AI-driven solutions to support biotech and pharmaceutical companies in accelerating drug discovery and advancing precision medicine. These tools are designed to reduce the time and cost typically associated with bringing new therapies to market. Early adopters include industry leaders such as Cerevel Therapeutics, Pfizer, and Colossal Biosciences. This initiative reflects the growing demand for more cost-effective and time-efficient drug development processes, significantly boosting the global virtual drug discovery service market by enhancing research productivity and innovation. The combination of technological advancements, well-established healthcare infrastructure, and strong financial backing positions North America as the leading region for virtual drug discovery services, offering significant opportunities for innovation and market expansion.
| Report Matrics | Details |
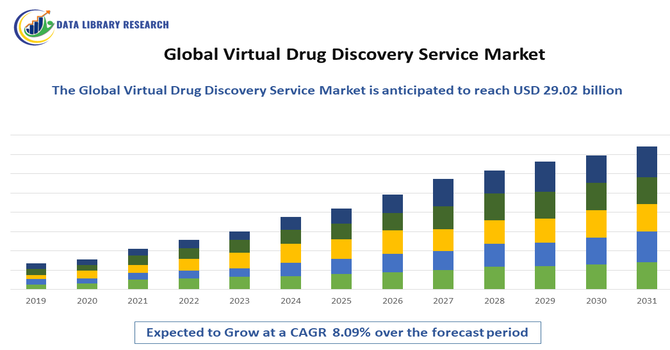
| Market Size Value | USD 29.02 billion |
| Growth Rate | CAGR of 7.9% |
| Forecast | 2026-2033 |
| Historical data | 2021-2024 |
| Base Year | 2025 |
| Report Coverage | Forecasted revenue, company rating, competitive environment, growth drivers, and trends |
| Segment Coverage | Type, Application, End-User, Geography |
| Regional Scope | North America, Europe, Asia Pacific, Middle East |
| Customized scope | Free customization of reports (With 3 months Analysis Support ) |
| To Learn More About This Report | Request a Free Sample Copy |
The Global Virtual Drug Discovery Service Market is characterized by a dynamic competitive landscape, featuring a diverse array of companies leveraging artificial intelligence (AI), machine learning (ML), and cloud computing technologies to innovate in drug discovery processes. These companies range from established pharmaceutical firms to specialized biotechnology startups, all aiming to enhance the efficiency and effectiveness of drug development.
Key Players in the Market:
Recent Development:
Q1. What the main growth driving factors for this market?
The global virtual drug discovery service market has been propelled by rising R&D costs and pressure to shorten drug development timelines. Advances in AI, machine learning, and high‑performance computing enable in silico screening, target prediction, and molecular modeling more efficiently. The shift toward precision medicine and personalized therapies further fuels demand for virtual platforms. Also, increasing collaborations between pharma and tech firms and growth in biotech startups create a robust ecosystem for service adoption.
Q2. What are the main restraining factors for this market?
Key constraints include lack of standardized regulatory guidance for AI‑driven discovery workflows, which hinders trust and broad adoption. Integration challenges with traditional experimental pipelines, data silos, and interoperability issues also slow uptake. Furthermore, the scarcity of skilled computational biologists and high upfront investment in AI infrastructure pose considerable barriers.
Q3. Which segment is expected to witness high growth?
The in silico services or virtual screening / computational modeling segment is anticipated to grow fastest, powered by continuous improvements in algorithm accuracy and computational capacity. Generative AI models for novel molecule design and predictive toxicology are emerging strong sub‑segments. Also, AI‑based target identification and optimization modules are gaining traction.
Q4. Who are the top major players for this market?
Leading players in this space include Schrödinger, Certara, IBM Watson Health, Charles River Laboratories, WuXi AppTec, and Evotec. These companies offer platforms combining AI, molecular modeling, and drug discovery services, often partnering with pharma clients to accelerate pipelines.
Q5. Which country is the largest player?
The United States dominates the global virtual drug discovery services market, owing to high pharmaceutical R&D spending, abundant computational infrastructure, and regulatory flexibility. North America holds the largest regional share (~40 %+) in related informatics markets, with the U.S. leading in both service provision and platform development.
Data Library Research are conducted by industry experts who offer insight on industry structure, market segmentations technology assessment and competitive landscape (CL), and penetration, as well as on emerging trends. Their analysis is based on primary interviews (~ 80%) and secondary research (~ 20%) as well as years of professional expertise in their respective industries. Adding to this, by analysing historical trends and current market positions, our analysts predict where the market will be headed for the next five years. Furthermore, the varying trends of segment & categories geographically presented are also studied and the estimated based on the primary & secondary research.
In this particular report from the supply side Data Library Research has conducted primary surveys (interviews) with the key level executives (VP, CEO’s, Marketing Director, Business Development Manager and SOFT) of the companies that active & prominent as well as the midsized organization
FIGURE 1: DLR RESEARH PROCESS
Extensive primary research was conducted to gain a deeper insight of the market and industry performance. The analysis is based on both primary and secondary research as well as years of professional expertise in the respective industries.
In addition to analysing current and historical trends, our analysts predict where the market is headed over the next five years.
It varies by segment for these categories geographically presented in the list of market tables. Speaking about this particular report we have conducted primary surveys (interviews) with the key level executives (VP, CEO’s, Marketing Director, Business Development Manager and many more) of the major players active in the market.
Secondary ResearchSecondary research was mainly used to collect and identify information useful for the extensive, technical, market-oriented, and Friend’s study of the Global Extra Neutral Alcohol. It was also used to obtain key information about major players, market classification and segmentation according to the industry trends, geographical markets, and developments related to the market and technology perspectives. For this study, analysts have gathered information from various credible sources, such as annual reports, sec filings, journals, white papers, SOFT presentations, and company web sites.
Market Size EstimationBoth, top-down and bottom-up approaches were used to estimate and validate the size of the Global market and to estimate the size of various other dependent submarkets in the overall Extra Neutral Alcohol. The key players in the market were identified through secondary research and their market contributions in the respective geographies were determined through primary and secondary research.
Forecast Model