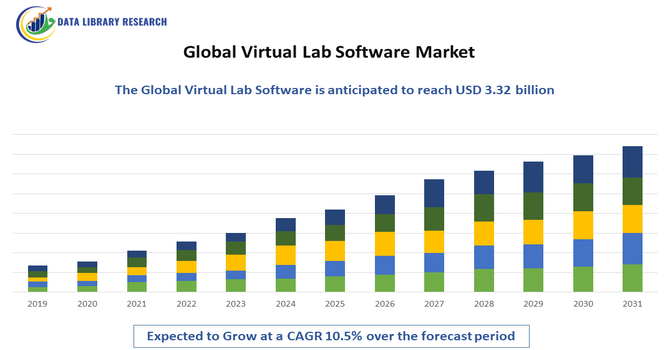
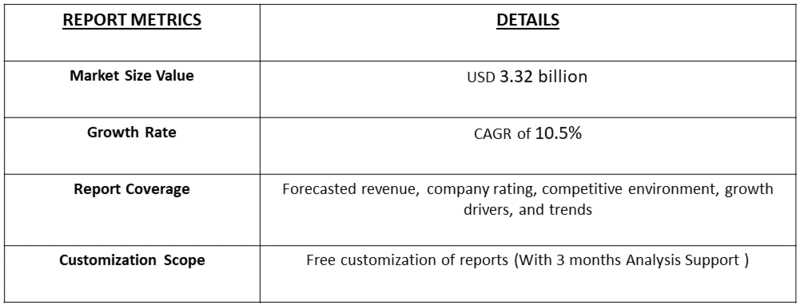
The projected value of the Virtual Lab Software Market in 2025 is approximately USD 1.71 billion and projected to grow at a CAGR of 10.5% (2025-2032), reaching USD 3.32 billion in the year 2032.
Get Complete Analysis Of The Report - Download Free Sample PDF
A Virtual Training Lab is a cloud-based platform offering a safe, interactive, and simulated digital workspace for hands-on education. Unlike traditional learning, it allows trainees to practice real-world skills and experiment without impacting live systems. Ideal for fields like cybersecurity, it enables users to tackle complex scenarios such as ransomware attacks or hardware failures. Key features include intuitive design, virtual sandboxes, instructor access, automated feedback, and robust security. Virtual training labs enhance productivity, reduce costs, and provide invaluable practical experience, transforming how professionals and students learn and develop critical competencies.
A significant market trend for virtual lab software is its increasing integration into STEM education curricula. Historically, providing robust practical learning scenarios presented substantial logistical and financial challenges for academic institutions.
The proliferation of Information and Communication Technologies (ICTs) and decreasing hardware costs over the past two decades has catalysed the development and adoption of non-traditional experimentation platforms. These advancements have enabled the creation of sophisticated virtual environments, offering enhanced adaptability and engagement for both educators and students. Consequently, the market is witnessing a paradigm shift, with virtual labs becoming instrumental in expanding access to complex experimental methodologies and driving pedagogical innovation on a global scale.
Segmentation:
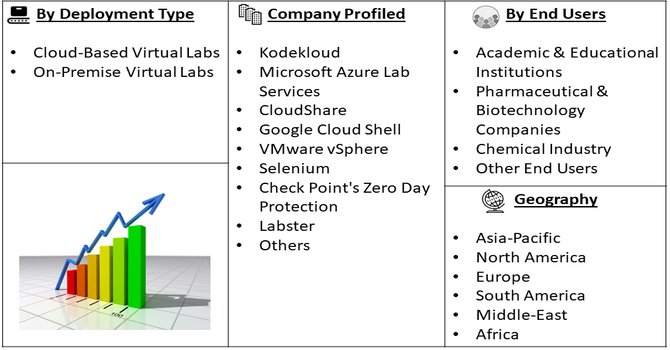
The virtual lab software market is segmented by Deployment Type (Cloud-Based Virtual Labs, and On-Premise Virtual Labs), End Users (Academic & Educational Institutions, Pharmaceutical & Biotechnology Companies, Chemical Industry and Other End Users), and Geography (North America, Europe, Asia-Pacific, Middle East and Africa, and South America). The report provides the value (in USD million) for the above segments.
For Detailed Market Segmentation - Get a Free Sample PDF
Market Drivers:
A significant catalyst for the adoption of digital pathology and AI-driven solutions is the evolving regulatory landscape and improved reimbursement mechanisms. The U.S. regulatory framework, guided by the FDA, CMS/CLIA, and CAP, is actively establishing standards that ensure the safety and reliability of digital pathology technologies. Crucially, policies allowing remote diagnostic reviews under CMS/CLIA, coupled with the introduction of new digital pathology Current Procedural Terminology (CPT) codes, are directly addressing previous barriers to widespread adoption. This regulatory clarity and the facilitation of reimbursement processes for digital pathology services are creating a more viable and attractive market, encouraging investment and accelerating the integration of advanced digital and AI-driven diagnostic tools into mainstream pathology workflows.
Another key driver in this market is the accelerating shift toward experiential learning models that directly bridge academic preparation and workforce readiness. Initiatives like Italy’s School–Work Alternation (SWA) highlight how structured practical experiences significantly boost students' perceived employability, agency, and career clarity. This trend underscores a broader demand for educational solutions that integrate real-world skills and mentorship into curricula.
EdTech platforms—particularly virtual labs and simulated training environments—are positioned to meet this need by offering scalable, immersive, and choice-driven practical learning experiences. The evidence shows that when learners exercise personal agency in their practical training, engagement and perceived utility rise markedly. For providers, this creates opportunities to develop solutions that support educational institutions in delivering high-impact, industry-aligned experiential learning, ultimately closing the gap between theoretical knowledge and applicable skills demanded by today’s job market.
Market Restraints:
A major challenge facing the widespread adoption of virtual lab software is its significant hardware requirements, particularly the need for ample RAM to ensure smooth performance. When memory is insufficient, systems resort to disk paging—a process that drastically slows down operations and disrupts the user experience. This creates a notable barrier, as organizations must invest in powerful, and often costly, IT infrastructure to support these platforms effectively. For schools, training centers, or businesses with limited budgets, these expenses can be prohibitive. Additionally, maintaining and scaling such technical environments demands specialized expertise, further increasing the total cost of ownership. These performance and financial constraints can limit accessibility, especially for smaller or resource-constrained institutions looking to implement virtual lab solutions.
The Virtual Lab Software Market has profound socioeconomic effects, democratizing STEM education by providing affordable, accessible tools that bridge gaps in underserved regions, fostering skill development and economic mobility. It drives job creation in tech sectors while reducing operational costs for institutions, enhancing efficiency and innovation, though it exacerbates the digital divide for those without reliable internet.
Initially, COVID-19 surged demand for virtual labs as lockdowns forced remote learning, accelerating market growth and enabling educational continuity for millions, though it highlighted infrastructure inequalities. As the world recovered, virtual labs integrated into mainstream education, sustaining market expansion through hybrid models and corporate training, fostering resilience and long-term socioeconomic benefits.
Moreover global wars, like ongoing conflicts, disrupt supply chains and funding for tech development, potentially slowing market penetration in affected areas. Yet, they also boost demand for remote, secure virtual solutions in stable regions, aiding knowledge transfer and economic stability amid geopolitical uncertainties.
Segmental Analysis
Cloud-based virtual lab software is experiencing rapid growth as on-demand or scheduled provisioning of preconfigured virtual machines becomes standard. This model enables educators to run classes, professional training, hackathons, and hands-on labs without investing in local infrastructure, while enterprises scale labs for global teams with predictable costs.
Cloud-type platforms offer rapid provisioning, multi-tenant governance, and pay-as-you-go pricing, improving time-to-value and total cost of ownership. Vendors are enhancing orchestration, automation, identity controls, and security to support widespread delivery and collaboration across borders. The trend extends from education to research, industry, and government, fueling continuous upskilling and rapid experimentation. Challenges remain around data privacy, regulatory compliance, and performance at scale, but innovations in AI-accelerated simulations and secure data handling are reinforcing the market’s growth trajectory.
Pharma and biotech are turning more to digital R&D labs and Lab as a Service to speed up discovery and development across regions. By collaborating with regulators, universities, and industry partners, these programs help shorten approval cycles and improve knowledge sharing, while deepening sponsor relationships and accelerating results. The offering blends domain know how with automation and data tools to support precision medicine, including GMO/genetic testing and microbiology labs, all backed by customized LIMS solutions to meet international standards. New capabilities are also emerging, such as voice-assisted labs, IoT-based Smart iConnect for real time asset monitoring, and Digital Twin technology for inventory, process orchestration, and experiment planning. Benefits include greater efficiency, better traceability, and stronger audit readiness, along with easier scaling and cost control.
This segment’s growth is driven by cost pressures, the demand for faster time to market, and global collaboration, including outsourcing to CROs. Key challenges remain around data privacy and cybersecurity, demanding robust governance. Overall, the market is set for sustained expansion as digital and automation capabilities mature across drug discovery and development.
North America is becoming a leading hub for virtual lab software as schools and organizations increasingly adopt these flexible, easy-to-access learning tools. Virtual labs let students perform experiments and simulations safely from anywhere, helping them connect theory with hands-on practice. For instance, Brock University uses a combined platform where students access Mac-based labs through Splashtop and Windows applications via Windows Virtual Desktop. This setup lets students participate in a wide range of lab activities without being on campus. Students benefit by gaining practical skills and better preparing for their future careers. As education keeps evolving, North American institutions are embracing virtual labs more widely, driving the growth of this market. This trend reflects a broader shift toward technology-driven, accessible education that meets the needs of today’s digital learners and sets a foundation for long-term academic and professional success.
To Learn More About This Report - Request a Free Sample Copy
The virtual lab software market is characterized by a diverse and increasingly competitive landscape, with a mix of established educational technology providers, specialized simulation companies, and cloud service providers. Key players often focus on specific niches, such as life sciences, engineering, or general science education, offering solutions ranging from fully immersive 3D environments to simpler browser-based simulations. Large educational institutions are also developing their own internal platforms or partnering with technology providers, while cloud giants like AWS and Microsoft Azure are increasingly offering infrastructure and services that underpin these virtual environments. This competitive environment fosters innovation, driving the development of more realistic simulations, better integration with learning management systems, and enhanced accessibility for a wider range of academic disciplines and student populations.
The following are companies that are providing services in this market
Recent Developments:
Q1. What are the main growth-driving factors for this market?
The main growth drivers for the virtual lab software market include the inherent flexibility and accessibility they offer, the ability to provide risk-free learning environments, and their crucial role in bridging theoretical knowledge with practical application in an increasingly digital educational landscape.
Q2. What are the main restraining factors for this market?
The primary restraining factors for this market are the potential for high initial investment costs, the requirement for robust IT infrastructure to support the software, and the ongoing challenge of ensuring the fidelity and practical efficacy of the simulations offered.
Q3. Which segment is expected to witness high growth?
The higher education segment, encompassing universities and colleges, along with research institutions, is expected to witness high growth, particularly within STEM fields, due to the escalating demand for advanced and accessible practical learning experiences.
Q4. Who are the top major players for this market?
While not explicitly detailed in the provided text, the major players for this market are anticipated to include companies that offer comprehensive remote access platforms, specialized simulation providers, and major cloud infrastructure providers such as Google, AWS and Microsoft.
Q5. Which country is the largest player?
North America, with the United States due to the presence of top major players lile Google and Microsoft and advancement in research and development is a significant contributor and identified as a key region in the virtual lab software market.
Data Library Research are conducted by industry experts who offer insight on industry structure, market segmentations technology assessment and competitive landscape (CL), and penetration, as well as on emerging trends. Their analysis is based on primary interviews (~ 80%) and secondary research (~ 20%) as well as years of professional expertise in their respective industries. Adding to this, by analysing historical trends and current market positions, our analysts predict where the market will be headed for the next five years. Furthermore, the varying trends of segment & categories geographically presented are also studied and the estimated based on the primary & secondary research.
In this particular report from the supply side Data Library Research has conducted primary surveys (interviews) with the key level executives (VP, CEO’s, Marketing Director, Business Development Manager and SOFT) of the companies that active & prominent as well as the midsized organization
FIGURE 1: DLR RESEARH PROCESS
Extensive primary research was conducted to gain a deeper insight of the market and industry performance. The analysis is based on both primary and secondary research as well as years of professional expertise in the respective industries.
In addition to analysing current and historical trends, our analysts predict where the market is headed over the next five years.
It varies by segment for these categories geographically presented in the list of market tables. Speaking about this particular report we have conducted primary surveys (interviews) with the key level executives (VP, CEO’s, Marketing Director, Business Development Manager and many more) of the major players active in the market.
Secondary ResearchSecondary research was mainly used to collect and identify information useful for the extensive, technical, market-oriented, and Friend’s study of the Global Extra Neutral Alcohol. It was also used to obtain key information about major players, market classification and segmentation according to the industry trends, geographical markets, and developments related to the market and technology perspectives. For this study, analysts have gathered information from various credible sources, such as annual reports, sec filings, journals, white papers, SOFT presentations, and company web sites.
Market Size EstimationBoth, top-down and bottom-up approaches were used to estimate and validate the size of the Global market and to estimate the size of various other dependent submarkets in the overall Extra Neutral Alcohol. The key players in the market were identified through secondary research and their market contributions in the respective geographies were determined through primary and secondary research.
Forecast Model