Virtual Reality (VR) Bridge Simulator Market Overview and Analysis

  • Virtual Reality (VR) Bridge Simulator Market Revenue was valued at USD 278 Million in 2025 and is estimated to reach USD 2.2 Billion by 2035, growing at a CAGR of 10.98% from 2025-2032.

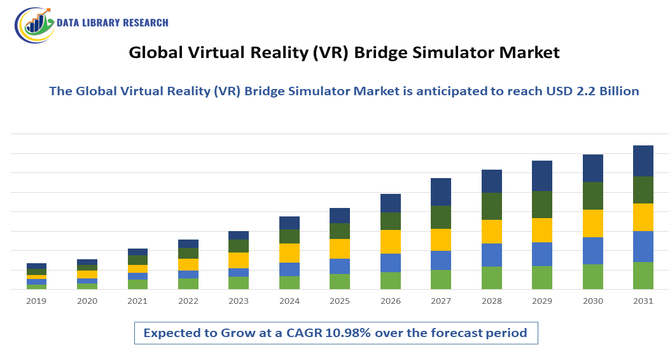
The Global Virtual Reality (VR) Bridge Simulator Market refers to the industry focused on the development, manufacturing, and deployment of VR-based simulation systems designed to train ship bridge crews. These simulators replicate real-life maritime navigation and operational scenarios using immersive VR technology, enhancing skills in ship handling, safety procedures, and emergency response. Growing demand for cost-effective, safe, and realistic training solutions in the shipping, defense, and maritime sectors drives market growth. The market includes various types of simulators, software, and training services, catering to commercial shipping companies, naval forces, and maritime training institutes worldwide. Increasing adoption of advanced VR technology and stringent safety regulations further propel this market’s expansion.

Virtual Reality (VR) Bridge Simulator Market Latest Trends

The Virtual Reality (VR) Bridge Simulator market is experiencing significant growth driven by several key trends. The integration of Artificial Intelligence (AI) and Machine Learning (ML) into VR simulators is enhancing training effectiveness by enabling adaptive learning and real-time performance analysis, leading to more personalized and efficient training experiences. Advancements in immersive technologies, such as improved VR hardware and haptic feedback systems, are making training environments more realistic and engaging, thereby improving skill acquisition. The adoption of cloud-based VR simulators is increasing, allowing for remote training sessions and reducing the need for extensive physical infrastructure, thus expanding accessibility and reducing costs. Additionally, the rise of multi-crew training scenarios is promoting collaborative learning and better preparation for real-world operations. These trends are collectively driving the expansion of the VR Bridge Simulator market, particularly in maritime and defense sectors.

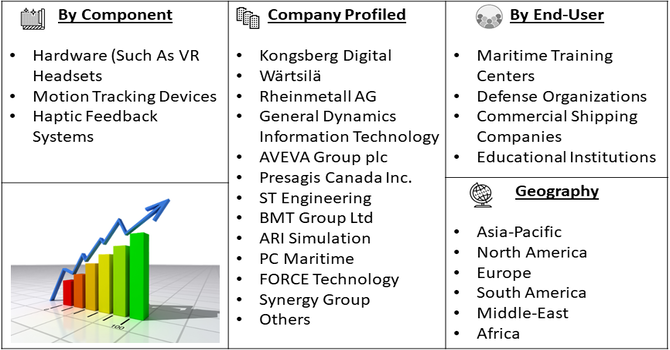
Segmentation: The Global Virtual Reality (VR) Bridge Simulator Market is segmented by Component (Hardware (Such As VR Headsets, Motion Tracking Devices, and Haptic Feedback Systems) and Software (Simulation Programs and Training Modules)), Deployment (On-Premises and Cloud-Based Solutions), End-Users (Maritime Training Centers, Defense Organizations, Commercial Shipping Companies, and Educational Institutions), and Geography (North America, Europe, Asia-Pacific, Latin America, Middle East & Africa). The report provides the value (in USD million) for the above segments.

Market Drivers:

  • Growing Demand for Enhanced Maritime Training

The increasing need for highly effective and immersive training solutions in the maritime industry is a major driver for the VR bridge simulator market. Traditional training methods often lack realism, which can limit skill development and safety preparedness. VR bridge simulators provide a safe, controlled, and realistic environment for trainees to practice navigation, emergency handling, and decision-making without risks. This technology enables comprehensive training for various sea conditions and complex scenarios, leading to better-prepared professionals. With growing regulatory requirements and emphasis on safety, maritime companies and training centers are increasingly adopting VR bridge simulators to improve crew competence and reduce accidents, thereby boosting market growth worldwide.

  • Technological Advancements and Cost Efficiency

The advancements in VR technology, such as improved graphics, motion tracking, and haptic feedback, have significantly enhanced the realism and effectiveness of VR bridge simulators. These innovations make simulators more accessible and user-friendly, attracting a wider range of users, from large shipping corporations to smaller maritime training institutes.

Additionally, the cost of VR hardware and software has decreased over time, making these simulators more affordable compared to traditional full-scale bridge simulators. For instance, in July 2024, MediSim VR, a healthcare simulation technology company, announced the opening of Chennai's first Center of Excellence (CoE) VR lab. The new, state-of-the-art facility is located at Sri Ramachandra Institute of Higher Education and Research (SRIHER). It provides medical students nationwide with access to immersive and interactive virtual reality training. This CoE aims to advance medical education through cutting-edge simulation technology. Cloud-based deployment options further reduce upfront investments and enable remote training capabilities, expanding the market by meeting the demands of geographically dispersed users and reducing operational costs for training organizations.

Market Restraints:

  • High Initial Investment and Technical Challenges

The key restraints for the VR bridge simulator market is the high initial cost associated with purchasing and setting up advanced VR systems. Despite decreasing prices, comprehensive VR simulators with high-quality hardware and sophisticated software can still be expensive, especially for smaller maritime training centers or organizations with limited budgets. Additionally, technical challenges such as hardware compatibility, software integration, and the need for continuous updates to reflect real-world maritime environments can hinder adoption. Some users may also face a learning curve in adapting to VR technology, which can delay training processes. These factors collectively slow down the widespread acceptance of VR bridge simulators in certain regions or among smaller enterprises.

Socio Economic Impact on Virtual Reality (VR) Bridge Simulator Market

The Global Virtual Reality (VR) Bridge Simulator Market has significant socio-economic impacts by enhancing maritime safety and training efficiency, which reduces accidents and environmental hazards at sea. By providing realistic and risk-free training environments, VR simulators improve the skills and preparedness of seafarers, leading to safer shipping operations and protecting valuable marine ecosystems. Economically, these simulators lower training costs over time and increase workforce productivity by accelerating learning and reducing the need for expensive, on-water training. Additionally, the market fosters job creation in tech development, maritime education, and simulation services, contributing to economic growth in related sectors while supporting global trade and logistics by improving maritime workforce competency.

Segmental Analysis:

  • Haptic Feedback Systems Segment is Expected to Witness Significant Growth over the Forecast Period

The haptic feedback systems segment is expected to experience significant growth during the forecast period due to its ability to provide realistic touch sensations in VR bridge simulators. These systems enhance training by allowing users to feel physical interactions, such as resistance and vibrations, making the simulations more immersive and effective. As maritime training increasingly focuses on replicating real-world conditions, haptic technology helps trainees develop critical skills with greater accuracy and confidence. Additionally, advancements in sensor and actuator technologies are making haptic systems more affordable and reliable, driving adoption. This segment’s growth is also supported by rising demand for high-fidelity simulation experiences that improve decision-making and operational safety in maritime navigation and bridge management.

  • Cloud-Based Solutions Segment is Expected to Witness Significant Growth over the Forecast Period

Cloud-based solutions for VR bridge simulators are poised for strong growth, driven by the need for flexible, scalable, and cost-effective training platforms. Cloud technology enables remote access to simulators and training modules, allowing maritime personnel to train from various locations without the constraints of physical simulators. This flexibility supports ongoing skill development and certification, especially for global shipping companies with dispersed workforces. Additionally, cloud-based platforms facilitate easy updates and integration of new scenarios, ensuring that training remains current with evolving maritime regulations and technologies. The growing adoption of cloud infrastructure in maritime education enhances collaboration, data analytics, and resource management, making training more efficient and accessible worldwide.

  • Commercial Shipping Companies Segment is Expected to Witness Significant Growth over the Forecast Period

Commercial shipping companies are expected to drive significant growth in the VR bridge simulator market as they prioritize crew safety and operational efficiency. These companies increasingly invest in advanced training technologies to meet strict international maritime safety regulations and reduce the risk of accidents at sea. VR bridge simulators offer a safe, cost-effective way to train crew members in handling complex navigation and emergency scenarios without real-world risks. Moreover, the growing global trade volume demands well-trained crews to manage larger fleets and sophisticated vessels, further boosting simulator adoption. By incorporating VR training, commercial shipping companies enhance workforce readiness, reduce insurance costs, and improve overall operational performance, making this segment a key market driver.

  • North America Region is Expected to Witness Significant Growth over the Forecast Period

The North America region is anticipated to witness significant growth in the VR bridge simulator market owing to its advanced maritime infrastructure and focus on innovative training solutions. The presence of major shipping ports, naval bases, and maritime training centers fuels demand for cutting-edge simulation technology.

Additionally, stringent safety regulations and government support for maritime education promote the adoption of VR simulators. For instance, in April 2022, Wärtsilä Voyage introduced "Smart Realities," an extended reality (XR) training and assessment solution. This new system is cost-effective, easily scalable, and fully immersive for marine applications like ship handling and engineering. It allows mariners to safely develop their skills and experience highly realistic, true-to-life scenarios. Smart Realities provides a virtual, risk-free environment for advanced professional development. The region’s strong technology ecosystem, including VR hardware and software developers, accelerates innovation and deployment of sophisticated training tools. Furthermore, North America’s emphasis on reducing environmental impact and improving maritime safety aligns with the benefits offered by VR bridge simulators, positioning the region as a key growth market in the global industry.

Virtual Reality (VR) Bridge Simulator Market Competitive Landscape

The competitive landscape of the Global Virtual Reality (VR) Bridge Simulator Market is characterized by the presence of several key players focusing on technological innovation, strategic partnerships, and regional expansion to strengthen their market position. Companies such as Kongsberg Digital, Wärtsilä, VSTEP, and FORCE Technology lead the market by developing advanced VR-based simulators that offer realistic and immersive training experiences for maritime professionals. These players are investing in research and development to integrate cutting-edge technologies like artificial intelligence, haptic feedback systems, and cloud-based solutions into their simulator offerings. Strategic collaborations, such as Kongsberg Digital's partnership with The Nautical Institute to establish a full-mission ship bridge simulator training academy in Mumbai, India, are expanding their global footprint and enhancing training accessibility. Additionally, the market is witnessing the emergence of regional players aiming to cater to specific geographical needs, thereby intensifying competition and driving innovation within the industry.

The 20 major players for above market are:

  • Kongsberg Digital
  • Wärtsilä
  • Rheinmetall AG
  • General Dynamics Information Technology
  • AVEVA Group plc
  • Presagis Canada Inc.
  • ST Engineering
  • BMT Group Ltd
  • ARI Simulation
  • PC Maritime
  • FORCE Technology
  • Synergy Group
  • Morild Interaktiv AS
  • Kilo Solutions
  • Capital Group
  • Rolls-Royce Marine
  • Thales Group
  • L3 Technologies
  • VSTEP
  • Transas (now part of Wärtsilä)


Recent News:

  • In April 2025, Wolters Kluwer and Laerdal Medical integrated conversational AI into their VR nursing simulation platform. This upgrade allows students to speak naturally with virtual patients, enhancing communication training and realism. The move strengthens clinical judgment skills and better prepares nursing students for real-world practice.


  • In April 2025, The Glimpse Group subsidiary, Brightline Interactive, delivered its initial Immersive Simulator System to the U.S. Navy. This new system utilizes spatial computing to offer advanced, highly realistic simulation capabilities for military training. It successfully bridged the gap between real and virtual worlds, offering a cost-effective training solution. The delivery marked a key milestone in using immersive technology to enhance naval operations' effectiveness and safety.


Frequently Asked Questions (FAQ) :

Q1. What are the main growth driving factors for this market?

The growth of the Global VR Bridge Simulator market is fundamentally driven by the rising emphasis on safety, operational efficiency, and the need for highly skilled personnel in the maritime industry. VR bridge simulators offer a cost-effective and risk-free environment for training ship operators and naval forces in complex scenarios like navigation, weather monitoring, and emergency response. Furthermore, stringent regulations from maritime legislative bodies mandating proficient training, coupled with continuous technological advancements in VR and related hardware, such as Head-Mounted Displays (HMDs), are propelling market adoption. The shift toward advanced training solutions that reduce real-life risks is a major catalyst.

Q2. What are the main restraining factors for this market?

The primary factor hindering the market's growth is the high initial cost associated with acquiring, installing, and maintaining full-scale VR bridge simulator systems. This substantial upfront investment, which includes complex hardware and specialized software, can be particularly prohibitive for smaller training institutions or maritime operators. Other restraining factors include the lengthy and complex procurement and certification cycles required for high-fidelity simulation systems, and the challenge of keeping simulators updated due to the rapid obsolescence of digital hardware and frequent software updates in modern vessels.

Q3. Which segment is expected to witness high growth?

While specific market reports on the VR Bridge Simulator market often focus on different segmentations, the Asia-Pacific region is consistently predicted to register the highest Compound Annual Growth Rate (CAGR). This high growth is attributed to the expansion of the maritime industry, a surge in sea trade, and increasing government investments in defense and naval training across countries like China, India, and South Korea. Additionally, the growing adoption of simulation techniques in educational institutes for various marine skills training contributes significantly to this regional growth.

Q4. Who are the top major players for this market?

The VR Bridge Simulator market is part of the broader simulators and maritime training ecosystem, featuring several specialized and diversified technology companies. Top players include established names in the simulation and defense sectors. Key companies that frequently appear in market analyses related to ship bridge simulators and related training solutions are Kongsberg Digital, Wärtsilä, CAE Inc., L3Harris Technologies Inc., and VSTEP B.V. These companies provide comprehensive simulation solutions, including VR technology, for navigation, engine room operations, and cargo handling training.

Q5. Which country is the largest player?

Based on market analysis for the broader ship and maritime simulator market, North America is often cited as the region that holds the largest market share in terms of revenue. Within this region, the United States is typically the dominant country player. This leading position is primarily due to the significant presence of major technology and defense companies, high defense and naval spending, and the early and robust adoption of advanced training technologies and regulatory standards that mandate the use of high-fidelity simulation solutions.

Virtual Reality (VR) Bridge Simulator MARKET STUDY GLOBAL MARKET ANALYSIS, INSIGHTS AND FORECAST, 2023-2029

    1. Introduction

    • 1.1. Research Scope
    • 1.2. Market Segmentation
    • 1.3. Research Methodology
    • 1.4. Definitions and Assumptions

    2. Executive Summary

      3. Market Dynamics

      • 3.1. Market Drivers
      • 3.2. Market Restraints
      • 3.3. Market Opportunities

      4. Key Insights

      • 4.1. Key Emerging Trends – For Major Countries
      • 4.2. Latest Technological Advancement
      • 4.3. Regulatory Landscape
      • 4.4. Industry SWOT Analysis
      • 4.5. Porters Five Forces Analysis

      5. Global Virtual Reality (VR) Bridge Simulator Market Analysis (USD Billion), Insights and Forecast, 2018-2029

      • 5.1. Key Findings / Summary
      • 5.2. Market Analysis, Insights and Forecast – By Segment 1
        • 5.2.1. Sub-Segment 1
        • 5.2.2. Sub-Segment 2
      • 5.3. Market Analysis, Insights and Forecast – By Segment 2
        • 5.3.1. Sub-Segment 1
        • 5.3.2. Sub-Segment 2
        • 5.3.3. Sub-Segment 3
        • 5.3.4. Others
      • 5.4. Market Analysis, Insights and Forecast – By Segment 3
        • 5.4.1. Sub-Segment 1
        • 5.4.2. Sub-Segment 2
        • 5.4.3. Sub-Segment 3
        • 5.4.4. Others
      • 5.5. Market Analysis, Insights and Forecast – By Region
        • 5.5.1. North America
        • 5.5.2. Latin America
        • 5.5.3. Europe
        • 5.5.4. Asia Pacific
        • 5.5.5. Middle East and Africa

      6. North America Virtual Reality (VR) Bridge Simulator Market Analysis (USD Billion), Insights and Forecast, 2018-2029

      • 6.1. Key Findings / Summary
      • 6.2. Market Analysis, Insights and Forecast – By Segment 1
        • 6.2.1. Sub-Segment 1
        • 6.2.2. Sub-Segment 2
      • 6.3. Market Analysis, Insights and Forecast – By Segment 2
        • 6.3.1. Sub-Segment 1
        • 6.3.2. Sub-Segment 2
        • 6.3.3. Sub-Segment 3
        • 6.3.4. Others
      • 6.4. Market Analysis, Insights and Forecast – By Segment 3
        • 6.4.1. Sub-Segment 1
        • 6.4.2. Sub-Segment 2
        • 6.4.3. Sub-Segment 3
        • 6.4.4. Others
      • 6.5. Market Analysis, Insights and Forecast – By Country
        • 6.5.1. U.S.
        • 6.5.2. Canada

      7. Latin America Virtual Reality (VR) Bridge Simulator Market Analysis (USD Billion), Insights and Forecast, 2018-2029

      • 7.1. Key Findings / Summary
      • 7.2. Market Analysis, Insights and Forecast – By Segment 1
        • 7.2.1. Sub-Segment 1
        • 7.2.2. Sub-Segment 2
      • 7.3. Market Analysis, Insights and Forecast – By Segment 2
        • 7.3.1. Sub-Segment 1
        • 7.3.2. Sub-Segment 2
        • 7.3.3. Sub-Segment 3
        • 7.3.4. Others
      • 7.4. Market Analysis, Insights and Forecast – By Segment 3
        • 7.4.1. Sub-Segment 1
        • 7.4.2. Sub-Segment 2
        • 7.4.3. Sub-Segment 3
        • 7.4.4. Others
      • 7.5. Insights and Forecast – By Country
        • 7.5.1. Brazil
        • 7.5.2. Mexico
        • 7.5.3. Rest of Latin America

      8. Europe Virtual Reality (VR) Bridge Simulator Market Analysis (USD Billion), Insights and Forecast, 2018-2029

      • 8.1. Key Findings / Summary
      • 8.2. Market Analysis, Insights and Forecast – By Segment 1
        • 8.2.1. Sub-Segment 1
        • 8.2.2. Sub-Segment 2
      • 8.3. Market Analysis, Insights and Forecast – By Segment 2
        • 8.3.1. Sub-Segment 1
        • 8.3.2. Sub-Segment 2
        • 8.3.3. Sub-Segment 3
        • 8.3.4. Others
      • 8.4. Market Analysis, Insights and Forecast – By Segment 3
        • 8.4.1. Sub-Segment 1
        • 8.4.2. Sub-Segment 2
        • 8.4.3. Sub-Segment 3
        • 8.4.4. Others
      • 8.5. Market Analysis, Insights and Forecast – By Country
        • 8.5.1. UK
        • 8.5.2. Germany
        • 8.5.3. France
        • 8.5.4. Italy
        • 8.5.5. Spain
        • 8.5.6. Russia
        • 8.5.7. Rest of Europe

      9. Asia Pacific Virtual Reality (VR) Bridge Simulator Market Analysis (USD Billion), Insights and Forecast, 2018-2029

      • 9.1. Key Findings / Summary
      • 9.2. Market Analysis, Insights and Forecast – By Segment 1
        • 9.2.1. Sub-Segment 1
        • 9.2.2. Sub-Segment 2
      • 9.3. Market Analysis, Insights and Forecast – By Segment 2
        • 9.3.1. Sub-Segment 1
        • 9.3.2. Sub-Segment 2
        • 9.3.3. Sub-Segment 3
        • 9.3.4. Others
      • 9.4. Market Analysis, Insights and Forecast – By Segment 3
        • 9.4.1. Sub-Segment 1
        • 9.4.2. Sub-Segment 2
        • 9.4.3. Sub-Segment 3
        • 9.4.4. Others
      • 9.5. Market Analysis, Insights and Forecast – By Country
        • 9.5.1. China
        • 9.5.2. India
        • 9.5.3. Japan
        • 9.5.4. Australia
        • 9.5.5. South East Asia
        • 9.5.6. Rest of Asia Pacific

      10. Middle East & Africa Virtual Reality (VR) Bridge Simulator Market Analysis (USD Billion), Insights and Forecast, 2018-2029

      • 10.1. Key Findings / Summary
      • 10.2. Market Analysis, Insights and Forecast – By Segment 1
        • 10.2.1. Sub-Segment 1
        • 10.2.2. Sub-Segment 2
      • 10.3. Market Analysis, Insights and Forecast – By Segment 2
        • 10.3.1. Sub-Segment 1
        • 10.3.2. Sub-Segment 2
        • 10.3.3. Sub-Segment 3
        • 10.3.4. Others
      • 10.4. Market Analysis, Insights and Forecast – By Segment 3
        • 10.4.1. Sub-Segment 1
        • 10.4.2. Sub-Segment 2
        • 10.4.3. Sub-Segment 3
        • 10.4.4. Others
      • 10.5. Market Analysis, Insights and Forecast – By Country
        • 10.5.1. GCC
        • 10.5.2. South Africa
        • 10.5.3. Rest of Middle East & Africa

      11. Competitive Analysis

      • 11.1. Company Market Share Analysis, 2018
      • 11.2. Key Industry Developments
      • 11.3. Company Profile
        • 11.3.1. Company 1
          • 11.3.1.1. Business Overview
          • 11.3.1.2. Segment 1 & Service Offering
          • 11.3.1.3. Overall Revenue
          • 11.3.1.4. Geographic Presence
          • 11.3.1.5. Recent Development
        *Similar details will be provided for the following companies
        • 11.3.2. Company 2
        • 11.3.3. Company 3
        • 11.3.4. Company 4
        • 11.3.5. Company 5
        • 11.3.6. Company 6
        • 11.3.7. Company 7
        • 11.3.8. Company 8
        • 11.3.9. Company 9
        • 11.3.10. Company 10
        • 11.3.11. Company 11
        • 11.3.12. Company 12
      List of Figures

      Figure 1: Global Virtual Reality (VR) Bridge Simulator Market Revenue Breakdown (USD Billion, %) by Region, 2023 & 2029
      Figure 2: Global Virtual Reality (VR) Bridge Simulator Market Value Share (%), By Segment 1, 2023 & 2029
      Figure 3: Global Virtual Reality (VR) Bridge Simulator Market Forecast (USD Billion), by Sub-Segment 1, 2018-2029
      Figure 4: Global Virtual Reality (VR) Bridge Simulator Market Forecast (USD Billion), by Sub-Segment 2, 2018-2029
      Figure 5: Global Virtual Reality (VR) Bridge Simulator Market Value Share (%), By Segment 2, 2023 & 2029
      Figure 6: Global Virtual Reality (VR) Bridge Simulator Market Forecast (USD Billion), by Sub-Segment 1, 2018-2029
      Figure 7: Global Virtual Reality (VR) Bridge Simulator Market Forecast (USD Billion), by Sub-Segment 2, 2018-2029
      Figure 8: Global Virtual Reality (VR) Bridge Simulator Market Forecast (USD Billion), by Sub-Segment 3, 2018-2029
      Figure 9: Global Virtual Reality (VR) Bridge Simulator Market Forecast (USD Billion), by Others, 2018-2029
      Figure 10: Global Virtual Reality (VR) Bridge Simulator Market Value Share (%), By Segment 3, 2023 & 2029
      Figure 11: Global Virtual Reality (VR) Bridge Simulator Market Forecast (USD Billion), by Sub-Segment 1, 2018-2029
      Figure 12: Global Virtual Reality (VR) Bridge Simulator Market Forecast (USD Billion), by Sub-Segment 2, 2018-2029
      Figure 13: Global Virtual Reality (VR) Bridge Simulator Market Forecast (USD Billion), by Sub-Segment 3, 2018-2029
      Figure 14: Global Virtual Reality (VR) Bridge Simulator Market Forecast (USD Billion), by Others, 2018-2029
      Figure 15: Global Virtual Reality (VR) Bridge Simulator Market Value (USD Billion), by Region, 2023 & 2029
      Figure 16: North America Virtual Reality (VR) Bridge Simulator Market Value Share (%), By Segment 1, 2023 & 2029
      Figure 17: North America Virtual Reality (VR) Bridge Simulator Market Forecast (USD Billion), by Sub-Segment 1, 2018-2029
      Figure 18: North America Virtual Reality (VR) Bridge Simulator Market Forecast (USD Billion), by Sub-Segment 2, 2018-2029
      Figure 19: North America Virtual Reality (VR) Bridge Simulator Market Value Share (%), By Segment 2, 2023 & 2029
      Figure 20: North America Virtual Reality (VR) Bridge Simulator Market Forecast (USD Billion), by Sub-Segment 1, 2018-2029
      Figure 21: North America Virtual Reality (VR) Bridge Simulator Market Forecast (USD Billion), by Sub-Segment 2, 2018-2029
      Figure 22: North America Virtual Reality (VR) Bridge Simulator Market Forecast (USD Billion), by Sub-Segment 3, 2018-2029
      Figure 23: North America Virtual Reality (VR) Bridge Simulator Market Forecast (USD Billion), by Others, 2018-2029
      Figure 24: North America Virtual Reality (VR) Bridge Simulator Market Value Share (%), By Segment 3, 2023 & 2029
      Figure 25: North America Virtual Reality (VR) Bridge Simulator Market Forecast (USD Billion), by Sub-Segment 1, 2018-2029
      Figure 26: North America Virtual Reality (VR) Bridge Simulator Market Forecast (USD Billion), by Sub-Segment 2, 2018-2029
      Figure 27: North America Virtual Reality (VR) Bridge Simulator Market Forecast (USD Billion), by Sub-Segment 3, 2018-2029
      Figure 28: North America Virtual Reality (VR) Bridge Simulator Market Forecast (USD Billion), by Others, 2018-2029
      Figure 29: North America Virtual Reality (VR) Bridge Simulator Market Forecast (USD Billion), by U.S., 2018-2029
      Figure 30: North America Virtual Reality (VR) Bridge Simulator Market Forecast (USD Billion), by Canada, 2018-2029
      Figure 31: Latin America Virtual Reality (VR) Bridge Simulator Market Value Share (%), By Segment 1, 2023 & 2029
      Figure 32: Latin America Virtual Reality (VR) Bridge Simulator Market Forecast (USD Billion), by Sub-Segment 1, 2018-2029
      Figure 33: Latin America Virtual Reality (VR) Bridge Simulator Market Forecast (USD Billion), by Sub-Segment 2, 2018-2029
      Figure 34: Latin America Virtual Reality (VR) Bridge Simulator Market Value Share (%), By Segment 2, 2023 & 2029
      Figure 35: Latin America Virtual Reality (VR) Bridge Simulator Market Forecast (USD Billion), by Sub-Segment 1, 2018-2029
      Figure 36: Latin America Virtual Reality (VR) Bridge Simulator Market Forecast (USD Billion), by Sub-Segment 2, 2018-2029
      Figure 37: Latin America Virtual Reality (VR) Bridge Simulator Market Forecast (USD Billion), by Sub-Segment 3, 2018-2029
      Figure 38: Latin America Virtual Reality (VR) Bridge Simulator Market Forecast (USD Billion), by Others, 2018-2029
      Figure 39: Latin America Virtual Reality (VR) Bridge Simulator Market Value Share (%), By Segment 3, 2023 & 2029
      Figure 40: Latin America Virtual Reality (VR) Bridge Simulator Market Forecast (USD Billion), by Sub-Segment 1, 2018-2029
      Figure 41: Latin America Virtual Reality (VR) Bridge Simulator Market Forecast (USD Billion), by Sub-Segment 2, 2018-2029
      Figure 42: Latin America Virtual Reality (VR) Bridge Simulator Market Forecast (USD Billion), by Sub-Segment 3, 2018-2029
      Figure 43: Latin America Virtual Reality (VR) Bridge Simulator Market Forecast (USD Billion), by Others, 2018-2029
      Figure 44: Latin America Virtual Reality (VR) Bridge Simulator Market Forecast (USD Billion), by Brazil, 2018-2029
      Figure 45: Latin America Virtual Reality (VR) Bridge Simulator Market Forecast (USD Billion), by Mexico, 2018-2029
      Figure 46: Latin America Virtual Reality (VR) Bridge Simulator Market Forecast (USD Billion), by Rest of Latin America, 2018-2029
      Figure 47: Europe Virtual Reality (VR) Bridge Simulator Market Value Share (%), By Segment 1, 2023 & 2029
      Figure 48: Europe Virtual Reality (VR) Bridge Simulator Market Forecast (USD Billion), by Sub-Segment 1, 2018-2029
      Figure 49: Europe Virtual Reality (VR) Bridge Simulator Market Forecast (USD Billion), by Sub-Segment 2, 2018-2029
      Figure 50: Europe Virtual Reality (VR) Bridge Simulator Market Value Share (%), By Segment 2, 2023 & 2029
      Figure 51: Europe Virtual Reality (VR) Bridge Simulator Market Forecast (USD Billion), by Sub-Segment 1, 2018-2029
      Figure 52: Europe Virtual Reality (VR) Bridge Simulator Market Forecast (USD Billion), by Sub-Segment 2, 2018-2029
      Figure 53: Europe Virtual Reality (VR) Bridge Simulator Market Forecast (USD Billion), by Sub-Segment 3, 2018-2029
      Figure 54: Europe Virtual Reality (VR) Bridge Simulator Market Forecast (USD Billion), by Others, 2018-2029
      Figure 55: Europe Virtual Reality (VR) Bridge Simulator Market Value Share (%), By Segment 3, 2023 & 2029
      Figure 56: Europe Virtual Reality (VR) Bridge Simulator Market Forecast (USD Billion), by Sub-Segment 1, 2018-2029
      Figure 57: Europe Virtual Reality (VR) Bridge Simulator Market Forecast (USD Billion), by Sub-Segment 2, 2018-2029
      Figure 58: Europe Virtual Reality (VR) Bridge Simulator Market Forecast (USD Billion), by Sub-Segment 3, 2018-2029
      Figure 59: Europe Virtual Reality (VR) Bridge Simulator Market Forecast (USD Billion), by Others, 2018-2029
      Figure 60: Europe Virtual Reality (VR) Bridge Simulator Market Forecast (USD Billion), by U.K., 2018-2029
      Figure 61: Europe Virtual Reality (VR) Bridge Simulator Market Forecast (USD Billion), by Germany, 2018-2029
      Figure 62: Europe Virtual Reality (VR) Bridge Simulator Market Forecast (USD Billion), by France, 2018-2029
      Figure 63: Europe Virtual Reality (VR) Bridge Simulator Market Forecast (USD Billion), by Italy, 2018-2029
      Figure 64: Europe Virtual Reality (VR) Bridge Simulator Market Forecast (USD Billion), by Spain, 2018-2029
      Figure 65: Europe Virtual Reality (VR) Bridge Simulator Market Forecast (USD Billion), by Russia, 2018-2029
      Figure 66: Europe Virtual Reality (VR) Bridge Simulator Market Forecast (USD Billion), by Rest of Europe, 2018-2029
      Figure 67: Asia Pacific Virtual Reality (VR) Bridge Simulator Market Value Share (%), By Segment 1, 2023 & 2029
      Figure 68: Asia Pacific Virtual Reality (VR) Bridge Simulator Market Forecast (USD Billion), by Sub-Segment 1, 2018-2029
      Figure 69: Asia Pacific Virtual Reality (VR) Bridge Simulator Market Forecast (USD Billion), by Sub-Segment 2, 2018-2029
      Figure 70: Asia Pacific Virtual Reality (VR) Bridge Simulator Market Value Share (%), By Segment 2, 2023 & 2029
      Figure 71: Asia Pacific Virtual Reality (VR) Bridge Simulator Market Forecast (USD Billion), by Sub-Segment 1, 2018-2029
      Figure 72: Asia Pacific Virtual Reality (VR) Bridge Simulator Market Forecast (USD Billion), by Sub-Segment 2, 2018-2029
      Figure 73: Asia Pacific Virtual Reality (VR) Bridge Simulator Market Forecast (USD Billion), by Sub-Segment 3, 2018-2029
      Figure 74: Asia Pacific Virtual Reality (VR) Bridge Simulator Market Forecast (USD Billion), by Others, 2018-2029
      Figure 75: Asia Pacific Virtual Reality (VR) Bridge Simulator Market Value Share (%), By Segment 3, 2023 & 2029
      Figure 76: Asia Pacific Virtual Reality (VR) Bridge Simulator Market Forecast (USD Billion), by Sub-Segment 1, 2018-2029
      Figure 77: Asia Pacific Virtual Reality (VR) Bridge Simulator Market Forecast (USD Billion), by Sub-Segment 2, 2018-2029
      Figure 78: Asia Pacific Virtual Reality (VR) Bridge Simulator Market Forecast (USD Billion), by Sub-Segment 3, 2018-2029
      Figure 79: Asia Pacific Virtual Reality (VR) Bridge Simulator Market Forecast (USD Billion), by Others, 2018-2029
      Figure 80: Asia Pacific Virtual Reality (VR) Bridge Simulator Market Forecast (USD Billion), by China, 2018-2029
      Figure 81: Asia Pacific Virtual Reality (VR) Bridge Simulator Market Forecast (USD Billion), by India, 2018-2029
      Figure 82: Asia Pacific Virtual Reality (VR) Bridge Simulator Market Forecast (USD Billion), by Japan, 2018-2029
      Figure 83: Asia Pacific Virtual Reality (VR) Bridge Simulator Market Forecast (USD Billion), by Australia, 2018-2029
      Figure 84: Asia Pacific Virtual Reality (VR) Bridge Simulator Market Forecast (USD Billion), by Southeast Asia, 2018-2029
      Figure 85: Asia Pacific Virtual Reality (VR) Bridge Simulator Market Forecast (USD Billion), by Rest of Asia Pacific, 2018-2029
      Figure 86: Middle East & Africa Virtual Reality (VR) Bridge Simulator Market Value Share (%), By Segment 1, 2023 & 2029
      Figure 87: Middle East & Africa Virtual Reality (VR) Bridge Simulator Market Forecast (USD Billion), by Sub-Segment 1, 2018-2029
      Figure 88: Middle East & Africa Virtual Reality (VR) Bridge Simulator Market Forecast (USD Billion), by Sub-Segment 2, 2018-2029
      Figure 89: Middle East & Africa Virtual Reality (VR) Bridge Simulator Market Value Share (%), By Segment 2, 2023 & 2029
      Figure 90: Middle East & Africa Virtual Reality (VR) Bridge Simulator Market Forecast (USD Billion), by Sub-Segment 1, 2018-2029
      Figure 91: Middle East & Africa Virtual Reality (VR) Bridge Simulator Market Forecast (USD Billion), by Sub-Segment 2, 2018-2029
      Figure 92: Middle East & Africa Virtual Reality (VR) Bridge Simulator Market Forecast (USD Billion), by Sub-Segment 3, 2018-2029
      Figure 93: Middle East & Africa Virtual Reality (VR) Bridge Simulator Market Forecast (USD Billion), by Others, 2018-2029
      Figure 94: Middle East & Africa Virtual Reality (VR) Bridge Simulator Market Value Share (%), By Segment 3, 2023 & 2029
      Figure 95: Middle East & Africa Virtual Reality (VR) Bridge Simulator Market Forecast (USD Billion), by Sub-Segment 1, 2018-2029
      Figure 96: Middle East & Africa Virtual Reality (VR) Bridge Simulator Market Forecast (USD Billion), by Sub-Segment 2, 2018-2029
      Figure 97: Middle East & Africa Virtual Reality (VR) Bridge Simulator Market Forecast (USD Billion), by Sub-Segment 3, 2018-2029
      Figure 98: Middle East & Africa Virtual Reality (VR) Bridge Simulator Market Forecast (USD Billion), by Others, 2018-2029
      Figure 99: Middle East & Africa Virtual Reality (VR) Bridge Simulator Market Forecast (USD Billion), by GCC, 2018-2029
      Figure 100: Middle East & Africa Virtual Reality (VR) Bridge Simulator Market Forecast (USD Billion), by South Africa, 2018-2029
      Figure 101: Middle East & Africa Virtual Reality (VR) Bridge Simulator Market Forecast (USD Billion), by Rest of Middle East & Africa, 2018-2029 
      List of Tables
      Table 1: Global Virtual Reality (VR) Bridge Simulator Market Revenue (USD Billion) Forecast, by Segment 1, 2018-2029
      Table 2: Global Virtual Reality (VR) Bridge Simulator Market Revenue (USD Billion) Forecast, by Segment 2, 2018-2029
      Table 3: Global Virtual Reality (VR) Bridge Simulator Market Revenue (USD Billion) Forecast, by Segment 3, 2018-2029
      Table 4: Global Virtual Reality (VR) Bridge Simulator Market Revenue (USD Billion) Forecast, by Region, 2018-2029
      Table 5: North America Virtual Reality (VR) Bridge Simulator Market Revenue (USD Billion) Forecast, by Segment 1, 2018-2029
      Table 6: North America Virtual Reality (VR) Bridge Simulator Market Revenue (USD Billion) Forecast, by Segment 2, 2018-2029
      Table 7: North America Virtual Reality (VR) Bridge Simulator Market Revenue (USD Billion) Forecast, by Segment 3, 2018-2029
      Table 8: North America Virtual Reality (VR) Bridge Simulator Market Revenue (USD Billion) Forecast, by Country, 2018-2029
      Table 9: Europe Virtual Reality (VR) Bridge Simulator Market Revenue (USD Billion) Forecast, by Segment 1, 2018-2029
      Table 10: Europe Virtual Reality (VR) Bridge Simulator Market Revenue (USD Billion) Forecast, by Segment 2, 2018-2029
      Table 11: Europe Virtual Reality (VR) Bridge Simulator Market Revenue (USD Billion) Forecast, by Segment 3, 2018-2029
      Table 12: Europe Virtual Reality (VR) Bridge Simulator Market Revenue (USD Billion) Forecast, by Country, 2018-2029
      Table 13: Latin America Virtual Reality (VR) Bridge Simulator Market Revenue (USD Billion) Forecast, by Segment 1, 2018-2029
      Table 14: Latin America Virtual Reality (VR) Bridge Simulator Market Revenue (USD Billion) Forecast, by Segment 2, 2018-2029
      Table 15: Latin America Virtual Reality (VR) Bridge Simulator Market Revenue (USD Billion) Forecast, by Segment 3, 2018-2029
      Table 16: Latin America Virtual Reality (VR) Bridge Simulator Market Revenue (USD Billion) Forecast, by Country, 2018-2029
      Table 17: Asia Pacific Virtual Reality (VR) Bridge Simulator Market Revenue (USD Billion) Forecast, by Segment 1, 2018-2029
      Table 18: Asia Pacific Virtual Reality (VR) Bridge Simulator Market Revenue (USD Billion) Forecast, by Segment 2, 2018-2029
      Table 19: Asia Pacific Virtual Reality (VR) Bridge Simulator Market Revenue (USD Billion) Forecast, by Segment 3, 2018-2029
      Table 20: Asia Pacific Virtual Reality (VR) Bridge Simulator Market Revenue (USD Billion) Forecast, by Country, 2018-2029
      Table 21: Middle East & Africa Virtual Reality (VR) Bridge Simulator Market Revenue (USD Billion) Forecast, by Segment 1, 2018-2029
      Table 22: Middle East & Africa Virtual Reality (VR) Bridge Simulator Market Revenue (USD Billion) Forecast, by Segment 2, 2018-2029
      Table 23: Middle East & Africa Virtual Reality (VR) Bridge Simulator Market Revenue (USD Billion) Forecast, by Segment 3, 2018-2029
      Table 24: Middle East & Africa Virtual Reality (VR) Bridge Simulator Market Revenue (USD Billion) Forecast, by Country, 2018-2029
      Research Process

      Data Library Research are conducted by industry experts who offer insight on industry structure, market segmentations technology assessment and competitive landscape (CL), and penetration, as well as on emerging trends. Their analysis is based on primary interviews (~ 80%) and secondary research (~ 20%) as well as years of professional expertise in their respective industries. Adding to this, by analysing historical trends and current market positions, our analysts predict where the market will be headed for the next five years. Furthermore, the varying trends of segment & categories geographically presented are also studied and the estimated based on the primary & secondary research.

      In this particular report from the supply side Data Library Research has conducted primary surveys (interviews) with the key level executives (VP, CEO’s, Marketing Director, Business Development Manager and SOFT) of the companies that active & prominent as well as the midsized organization

      FIGURE 1: DLR RESEARH PROCESS

      research-methodology1

      Primary Research

      Extensive primary research was conducted to gain a deeper insight of the market and industry performance. The analysis is based on both primary and secondary research as well as years of professional expertise in the respective industries.

      In addition to analysing current and historical trends, our analysts predict where the market is headed over the next five years.

      It varies by segment for these categories geographically presented in the list of market tables. Speaking about this particular report we have conducted primary surveys (interviews) with the key level executives (VP, CEO’s, Marketing Director, Business Development Manager and many more) of the major players active in the market.

      Secondary Research

      Secondary research was mainly used to collect and identify information useful for the extensive, technical, market-oriented, and Friend’s study of the Global Extra Neutral Alcohol. It was also used to obtain key information about major players, market classification and segmentation according to the industry trends, geographical markets, and developments related to the market and technology perspectives. For this study, analysts have gathered information from various credible sources, such as annual reports, sec filings, journals, white papers, SOFT presentations, and company web sites.

      Market Size Estimation

      Both, top-down and bottom-up approaches were used to estimate and validate the size of the Global market and to estimate the size of various other dependent submarkets in the overall Extra Neutral Alcohol. The key players in the market were identified through secondary research and their market contributions in the respective geographies were determined through primary and secondary research.

      Forecast Model

      research-methodology2

      Happy to Assist You

      If you have a question?

      info@datalibraryresearch.com

      IND : +91 955 279 0357

      Browse Related Reports