Get Complete Analysis Of The Report - Download Updated Free Sample PDF
The Global Wi-Fi Filters Market refers to the international industry focused on the development, production, and distribution of Wi-Fi filters—electronic components used in wireless communication devices to eliminate interference and ensure signal clarity by allowing only specific frequency bands to pass through. Driven by the rapid expansion of wireless networks, increasing demand for high-speed internet connectivity, and the proliferation of smart devices, this market spans applications in consumer electronics, automotive, telecommunications, and industrial sectors. Key trends include the adoption of advanced filter technologies such as surface acoustic wave (SAW) and bulk acoustic wave (BAW) filters, along with growing investments in 5G infrastructure and IoT ecosystems.
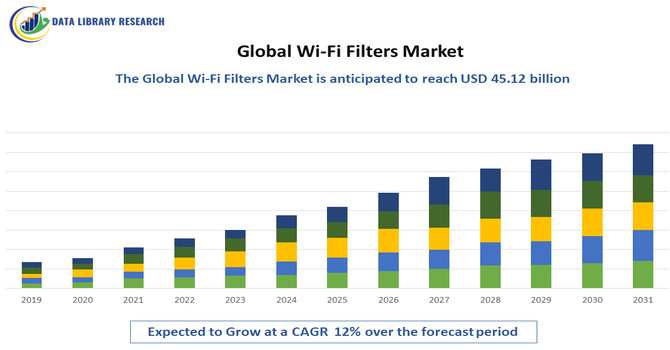
The Global Wi-Fi Filters Market is witnessing significant growth fueled by the rising adoption of smart devices, increased internet penetration, and the global rollout of advanced wireless communication technologies like 5G and Wi-Fi 6/6E. There is a notable shift toward miniaturized, high-performance filter components such as bulk acoustic wave (BAW) and surface acoustic wave (SAW) filters, which are essential for handling high-frequency signals with greater efficiency. Additionally, the integration of Wi-Fi filters in emerging applications like autonomous vehicles, smart homes, and industrial IoT is creating new growth avenues. Technological innovation, coupled with rising consumer expectations for seamless connectivity, is driving constant R&D investment in the sector.
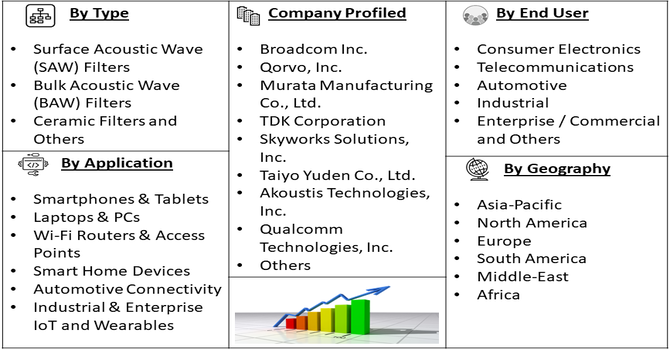
Segmentation: The Global Wi-Fi Filters Market Filter Type (Surface Acoustic Wave (SAW) Filters, Bulk Acoustic Wave (BAW) Filters, Ceramic Filters and Others (e.g., LC Filters, MEMS-based Filters)), Frequency Band (2.4 GHz, 5 GHz, 6 GHz and Multi-band (Dual/Triple Band)), Technology Standard (Wi-Fi 4 (802.11n), Wi-Fi 5 (802.11ac), Wi-Fi 6 / 6E (802.11ax), Wi-Fi 7 (802.11be) and Future Wi-Fi/6G-Ready Devices), Application (Smartphones & Tablets, Laptops & PCs, Wi-Fi Routers & Access Points, Smart Home Devices, Automotive Connectivity, Industrial & Enterprise IoT and Wearables), End User (Consumer Electronics, Telecommunications, Automotive, Industrial, Enterprise / Commercial and Others (Healthcare, Defense, etc.)) and Geography (North America, Europe, Asia-Pacific, Middle East and Africa, and South America). The report provides the value (in USD million) for the above segments.
For Detailed Market Segmentation - Get a Free Sample PDF
Market Drivers:
The rapid deployment of Wi-Fi 6, 6E, and emerging Wi-Fi 7 standards is a major driver for the Global Wi-Fi Filters Market. These advanced standards demand more sophisticated filtering solutions to manage increased data rates, higher frequency bands (including 6 GHz), and improved spectral efficiency. Wi-Fi 6E and 7 introduce broader bandwidths and additional channels, which require precise filtering to avoid interference and maintain performance. As device manufacturers race to integrate the latest Wi-Fi standards into smartphones, routers, laptops, and smart home devices, the need for high-performance RF filters—especially bulk acoustic wave (BAW) and surface acoustic wave (SAW) types—continues to surge. This trend is significantly boosting demand across both consumer and enterprise-grade wireless communication equipment.
The growing proliferation of IoT devices and smart home technologies is another strong driver of the Wi-Fi filters market. With the increasing number of connected devices—such as smart thermostats, cameras, speakers, lighting systems, and appliances—there is heightened demand for stable, interference-free wireless communication. Wi-Fi filters play a crucial role in ensuring efficient signal transmission by isolating desired frequency bands and minimizing noise and interference. The widespread adoption of Wi-Fi-enabled IoT devices in residential, industrial, and commercial environments places greater importance on advanced filtering solutions that can handle high device densities and complex wireless environments. This expanding ecosystem directly contributes to the growing need for reliable and efficient Wi-Fi filters in the global market.
Market Restraints:
Despite robust growth, the Wi-Fi filters market faces significant restraints due to the complexity involved in filter design and integration, especially for compact and multi-band devices. Designing filters that meet stringent performance requirements—such as low insertion loss, high out-of-band rejection, and minimal power consumption—within the space and cost constraints of modern devices is a major engineering challenge. Furthermore, integrating RF filters with SoCs, power amplifiers, and antennas in small form factors requires precision and compatibility across components. These complexities can slow down product development cycles and increase manufacturing costs, particularly for smaller manufacturers lacking advanced design and fabrication capabilities. As a result, the entry barrier remains high, potentially limiting innovation and competitiveness in certain segments of the market.
The expansion of the Wi-Fi filters market has broad socio-economic implications, as it supports the digital transformation of societies by enabling reliable and faster wireless communication. Enhanced connectivity contributes to economic development by improving access to information, education, healthcare, and remote work opportunities, especially in developing regions. Furthermore, as smart infrastructure becomes more prevalent, Wi-Fi filters play a crucial role in enabling efficient urban planning and energy management. However, the global supply chain disruptions and regional disparities in tech access can impact equitable benefits, underscoring the need for inclusive digital policies.
Segmental Analysis:
The ceramic filters segment is projected to experience the highest growth in the Global Wi-Fi Filters Market due to their compact size, cost-efficiency, and robust performance in high-frequency environments. These filters offer excellent temperature stability and durability, making them ideal for consumer electronics, industrial IoT, and telecom applications. With the growing demand for miniaturized components in smartphones, routers, and smart home devices, ceramic filters are increasingly preferred for their ability to deliver precise signal filtering within limited space. Furthermore, advancements in multilayer ceramic filter design have improved their capability to support multiple bands and high data rates. These advantages, along with increased adoption in Asia-Pacific manufacturing hubs, are expected to drive significant growth throughout the forecast period.
The multi-band segment, particularly dual- and triple-band filters, is anticipated to grow at the fastest rate as devices increasingly require support for multiple frequency bands, including 2.4 GHz, 5 GHz, and 6 GHz. This demand is driven by the proliferation of advanced Wi-Fi standards like Wi-Fi 6E and Wi-Fi 7, which operate across broader and overlapping frequency spectrums. Multi-band filters provide improved spectrum efficiency, reduced component count, and better integration for devices like smartphones, smart TVs, and routers. As end-users expect seamless connectivity and fast data transfer across all connected devices, manufacturers are incorporating multi-band filtering to enhance performance while saving space and cost. This segment is thus gaining rapid traction across both consumer electronics and enterprise networking applications.
Wi-Fi 6 and Wi-Fi 6E (802.11ax) are expected to lead growth within the technology segment of the Wi-Fi filters market due to their enhanced speed, capacity, and spectrum efficiency. Wi-Fi 6E extends Wi-Fi 6 capabilities into the 6 GHz band, which requires highly specialized RF filters to manage interference and maintain signal integrity. As global deployment of Wi-Fi 6/6E accelerates—driven by increased demand for low-latency connectivity in homes, enterprises, and industrial environments—the need for compatible high-performance filters rises sharply. Device manufacturers are rapidly adopting these standards in smartphones, laptops, routers, and IoT systems. As a result, the Wi-Fi 6/6E segment is poised for strong and sustained growth during the forecast period, propelled by technological evolution and market demand.
The telecommunications segment is set to experience the highest growth in the Global Wi-Fi Filters Market, fueled by rising investments in network infrastructure and rapid deployment of next-generation Wi-Fi and 5G technologies. Telecom providers are increasingly integrating Wi-Fi with cellular networks to enhance coverage, offload traffic, and support seamless connectivity. This convergence of technologies demands high-performance filters that can isolate and manage multiple frequency bands while minimizing interference. Additionally, the rollout of public and enterprise Wi-Fi networks—particularly in smart cities and remote areas—requires robust filtering solutions to maintain high-speed, uninterrupted service. As telecom companies scale up their infrastructure to support more users and devices, the demand for efficient, scalable Wi-Fi filtering components is expected to grow substantially.
Smartphones and tablets are projected to be the fastest-growing application segment in the Wi-Fi filters market, driven by the explosive demand for mobile connectivity, streaming, gaming, and real-time communication. These devices require compact, energy-efficient filters that support multiple Wi-Fi standards and bands, including the latest Wi-Fi 6E and Wi-Fi 7. As consumer expectations for speed, battery life, and reliability rise, manufacturers are incorporating advanced RF filter technologies like BAW and SAW to optimize wireless performance. Furthermore, increasing smartphone penetration in emerging markets and the regular upgrade cycles in developed economies contribute to the volume demand. As new models are released with enhanced wireless capabilities, the smartphone and tablet segment will continue to be a dominant growth driver in this market.
North America is expected to witness the highest growth in the Global Wi-Fi Filters Market, driven by strong demand for high-speed internet, rapid deployment of Wi-Fi 6E and 7 technologies, and extensive adoption of connected devices. The region benefits from robust infrastructure, advanced telecom ecosystems, and high penetration of smart homes, enterprise networks, and industrial IoT.
Major technology firms and chipset manufacturers based in the U.S. are at the forefront of integrating cutting-edge RF filtering solutions into their devices. For instance, in July 2021, Johanson Technology introduced two cost-effective ceramic band pass filters targeting Wi-Fi 6E applications to meet rising demand for low-latency, high-speed wireless connectivity. The filters operated in the 5.1–5.8 GHz and 6.1–7.125 GHz ranges, designed specifically for IEEE 802.11ax standards. Packaged in compact EIA 1210 form factor, they delivered strong coexistence performance with up to 32 dB rejection. These products supported enhanced Wi-Fi performance across next-generation routers and access points.
Similarly, in September 2025, DNSFilter marked its 10th anniversary during Cybersecurity Awareness Month, highlighting its rapid rise in the protective DNS space. Founded by Ken Carnesi to address shortcomings in existing DNS solutions, the company grew from a three-person team into an industry leader. It expanded its workforce by 4800% and gained the trust of over 43,000 organizations globally. This growth reflected the increasing demand for secure, reliable DNS filtering alongside advancements in Wi-Fi technologies. @@@@ Additionally, government initiatives to expand broadband access and develop 5G/Wi-Fi hybrid networks further support growth. With growing consumer reliance on wireless communication and continuous innovation, North America remains a key driver of technological advancement and market expansion for Wi-Fi filters.
| Report Matrics | Details |
| Market Size Value | USD 45.12 billion |
| Growth Rate | CAGR of 12% |
| Forecast | 2026-2033 |
| Historical data | 2021-2024 |
| Base Year | 2025 |
| Report Coverage | Forecasted revenue, company rating, competitive environment, growth drivers, and trends |
| Segment Coverage | Type, Application, End-User, Geography |
| Regional Scope | North America, Europe, Asia Pacific, Middle East |
| Customized scope | Free customization of reports (With 3 months Analysis Support ) |
| To Learn More About This Report | Request a Free Sample Copy |
The competitive landscape of the Global Wi-Fi Filters Market is marked by the presence of major players such as Broadcom Inc., Murata Manufacturing Co., Qorvo Inc., Skyworks Solutions Inc., and TDK Corporation. These companies are investing heavily in research and development to enhance product performance and reduce size and power consumption. Strategic collaborations, mergers, and acquisitions are common as firms seek to expand market share and technological capabilities. Additionally, emerging players in Asia-Pacific, particularly China and South Korea, are intensifying competition through cost-effective manufacturing and rapid innovation, making the market highly dynamic and innovation-driven.
Key Players
Recent Development
Q1. What the main growth driving factors for this market?
The main growth drivers for the Global Wi-Fi Filters Market are fundamentally linked to the pervasive and escalating demand for robust, high-performance wireless connectivity. The exponential rise in the adoption of Internet of Things (IoT) devices across consumer, commercial, and industrial sectors necessitates high-quality filtering components to manage the increasingly dense radio frequency (RF) spectrum. Furthermore, the rapid global rollout and adoption of newer Wi-Fi standards, specifically Wi-Fi 6/6E and the emerging Wi-Fi 7, are key accelerators.
Q2. What are the main restraining factors for this market?
The primary restraining factors for the Wi-Fi Filters Market revolve around technical challenges and cost pressures. A significant technical hurdle is managing co-channel interference and contention loss in dense deployment environments where numerous devices compete for the same spectrum. While filters mitigate external interference, complexity within the Wi-Fi ecosystem itself remains a challenge. Secondly, the high initial and replacement costs associated with sophisticated, high-performance filters (especially in newer technologies like BAW, which are critical for band-edge performance) can deter adoption, particularly for small and medium enterprises (SMEs) or in cost-sensitive consumer products.
Q3. Which segment is expected to witness high growth?
The Services segment within the broader Wi-Fi as a Service (WaaS) model is anticipated to witness exceptionally high growth. This includes professional and managed services for Wi-Fi network planning, design, deployment, monitoring, and maintenance. As Wi-Fi networks become more complex, especially with high-density and multi-technology environments, businesses are increasingly outsourcing the management to specialized third-party providers.
Q4. Who are the top major players for this market?
The top major players in the Global Wi-Fi Filters Market are generally comprised of large semiconductor companies that design and manufacture the critical filter and radio-frequency (RF) components, as well as the networking equipment providers that integrate them. Key semiconductor and component leaders include Broadcom Inc., Qualcomm Technologies Inc., and MediaTek Inc., which are central to developing chipsets for the newest Wi-Fi standards. Leading networking and enterprise equipment companies that rely on and drive demand for these advanced filters include Cisco Systems Inc. (including its enterprise segment, HPE Aruba Networking), Huawei Technologies Co. Ltd., Juniper Networks Inc., and Fortinet.
Q5. Which country is the largest player?
The United States and the encompassing North America region are frequently cited as the largest current players. This dominance is attributed to high consumer adoption rates of new technologies, substantial corporate and government investment in cutting-edge IT and wireless infrastructure, and the presence of many of the world's leading technology and networking companies (like Cisco, Qualcomm, and Broadcom) headquartered in the region.
Data Library Research are conducted by industry experts who offer insight on industry structure, market segmentations technology assessment and competitive landscape (CL), and penetration, as well as on emerging trends. Their analysis is based on primary interviews (~ 80%) and secondary research (~ 20%) as well as years of professional expertise in their respective industries. Adding to this, by analysing historical trends and current market positions, our analysts predict where the market will be headed for the next five years. Furthermore, the varying trends of segment & categories geographically presented are also studied and the estimated based on the primary & secondary research.
In this particular report from the supply side Data Library Research has conducted primary surveys (interviews) with the key level executives (VP, CEO’s, Marketing Director, Business Development Manager and SOFT) of the companies that active & prominent as well as the midsized organization
FIGURE 1: DLR RESEARH PROCESS
Extensive primary research was conducted to gain a deeper insight of the market and industry performance. The analysis is based on both primary and secondary research as well as years of professional expertise in the respective industries.
In addition to analysing current and historical trends, our analysts predict where the market is headed over the next five years.
It varies by segment for these categories geographically presented in the list of market tables. Speaking about this particular report we have conducted primary surveys (interviews) with the key level executives (VP, CEO’s, Marketing Director, Business Development Manager and many more) of the major players active in the market.
Secondary ResearchSecondary research was mainly used to collect and identify information useful for the extensive, technical, market-oriented, and Friend’s study of the Global Extra Neutral Alcohol. It was also used to obtain key information about major players, market classification and segmentation according to the industry trends, geographical markets, and developments related to the market and technology perspectives. For this study, analysts have gathered information from various credible sources, such as annual reports, sec filings, journals, white papers, SOFT presentations, and company web sites.
Market Size EstimationBoth, top-down and bottom-up approaches were used to estimate and validate the size of the Global market and to estimate the size of various other dependent submarkets in the overall Extra Neutral Alcohol. The key players in the market were identified through secondary research and their market contributions in the respective geographies were determined through primary and secondary research.
Forecast Model