Wood Pulp Market Overview
The global Wood Pulp Market was estimated at $166.6 billion in 2021 and is expected to rise at a CAGR of 3.61% from 2023 to 2030, reaching $250.1 billion by 2030.
Wood pulp is wood that has been crushed to fine pulp for use in the production of the newspaper and other low-cost materials, as well as hardboard. Chemical pulping and mechanical pulping are the two methods for producing wood pulp. Wood pulp is a versatile resource that may be used to make a range of items. Tissue, printing and writing papers, board, and specialty papers are the four most prevalent uses for wood pulp. The global Wood Pulp Market is expected to rise at a significant rate in the forthcoming years over the stated period.
The expansion of the global Wood Pulp market is boosted by the increased use of pulp in the paper production industry. The use of timber pulp in the creation of furniture and soft pieces for the residential sector is propelling the market's expansion. Furthermore, during the projected period, an increase in global demand for tissue paper, which is mostly used in kitchens, toilets, and households, is expected to boost market expansion.
On the downside, strict environmental restrictions governing deforestation are expected to have a negative impact on the growth of the wood pulp market in the coming years.
| Report Metric |
Details |
| Market size available for years |
2023–2030 |
| Base year considered |
2023 |
| Forecast period |
2024–2030 |
| Forecast unit |
Value (USD Million) |
| Segments covered |
Type, End-use Industry, and Region. |
| Regions covered |
North America (the U.S. and Canada), Europe (UK, Germany, France, Italy, Spain, Russia, Rest of Europe), Asia-Pacific (China, India, Japan, Australia, South East Asia, Rest of Asia Pacific), Latin America and the Middle East and Africa (Brazil, Saudi Arabia, UAE, Rest of LAMEA) |
| Companies covered |
International Paper, Metsä Group, Nippon Paper, Oji Holdings Corporation, Sappi, Sonoco Products, Stora Enso, Svenska Cellulosa Aktiebolaget, UPM-Kymmene Corporation, WestRock. |
Covid-19 Impact on Wood Pulp Market
The ongoing COVID-19 pandemic conditions have severely affected every sector around the world. Whereas, the chemicals and materials sectors were moderately affected during the pandemic. This is primarily due to the uncut demand for chemicals for healthcare, life science, and cleaning agents. However, other elements of chemical and material sectors such as paints, industrial oil, construction materials are facing diminution in demand. Strict lockdown resulted in a nearly 50-60% reduction in supply for raw materials, which directly affected the manufacturing process. Further, halt on many end-use industries directly affected the chemical demand all around the world.
Wood Pulp Market Segment Overview
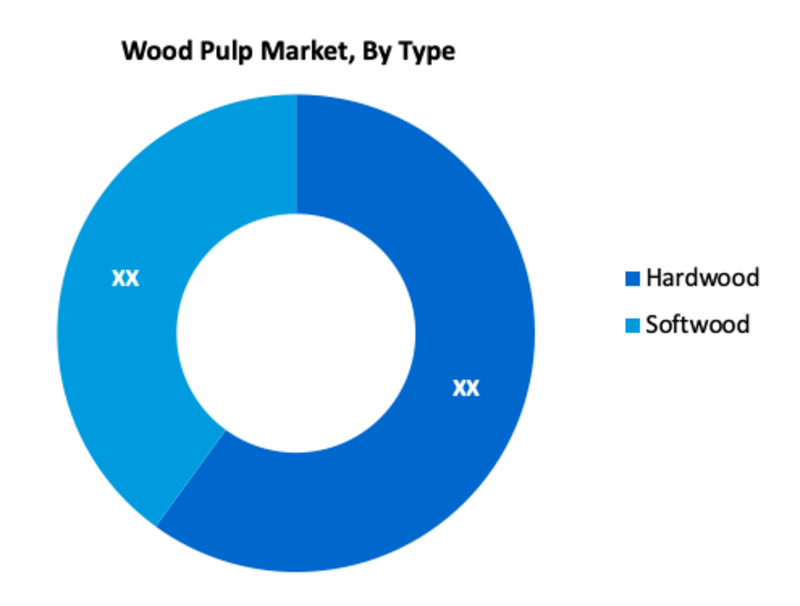
Based on Type, Hardwood is a noteworthy segment in the global Wood Pulp Market. Also, the Softwood segment has larger progress in the market. Overall, hardwoods contain more cellulose and extractives, and less lignin, than softwoods; as well, they usually have a higher initial brightness. For pulp purposes, softwood fibers are, on average, more than three times the length of those contained in hardwoods. And since increasing fiber length usually translates into more inter-fiber bonding, softwood pulps impart greater strength to the products into which they are made, than do hardwood pulps manufactured by the same process.
Furthermore, By End-Use Industry, in 2020, the packaging segment held the highest share of the wood pulp market. The usage of wood pulp in the creation of various types of packaging materials for use in various end-use industries is driving the global wood pulp market.
Wood Pulp Market, By Type
· Hardwood
· Softwood
Wood Pulp Market, By End-Use Industry
- Packaging
- Food & Beverages
- Pharmaceutical
- Personal Care & Cosmetics
- Automotive
- Others
- Paper
- Newspaper
- Books and Magazine
- Tissues
- Others
- Others
Wood Pulp Market Regional Overview
Region-wise, the Asia-Pacific region accounted for a huge share in the global wood pulp market in 2020. Factors such as growing population, increasing disposable income, the need for paper-based print media are estimated to boost the growth of the market in this region. Furthermore, the wood pulp market in North America and Europe is expected to rise at a higher CAGR in the estimated period. This is because of the tremendous expansion of various industries in these regions.
Wood Pulp Market, By Geography
· North America (US & Canada)
· Europe (UK, Germany, France, Italy, Spain, Russia & Rest of Europe)
· Asia-Pacific (Japan, China, India, Australia, & South Korea, & Rest of Asia-Pacific)
· LAMEA (Brazil, Saudi Arabia, UAE & Rest of LAMEA)
Wood Pulp Market, Key Players
· International Paper
· Metsä Group
· Nippon Paper
· Oji Holdings Corporation
· Sappi
· Sonoco Products
· Stora Enso
· Svenska Cellulosa Aktiebolaget
· UPM-Kymmene Corporation
· WestRock
Frequently Asked Questions (FAQ) :
Q1. What are the driving factors for the global Wood Pulp market?
The expansion of the global Wood Pulp market is boosted by the increased use of pulp in the paper production industry.
Q2. Which Segments are covered in the global Wood Pulp market report?
Type, End-use Industry, and Region. these segments are covered in the global Wood Pulp market report.
Q3. Which segment is projected to hold the largest share in the global Wood Pulp market?
The hardwood segment is projected to hold the largest share in the global Wood Pulp market.
Q4. Which region holds the largest share in the global Wood Pulp market?
Asia-Pacific held the largest share in the global Wood Pulp market
Q5. Which are the prominent players in the global Wood Pulp market?
International Paper, Metsä Group, Nippon Paper, Oji Holdings Corporation, Sappi, Sonoco Products, Stora Enso, Svenska Cellulosa Aktiebolaget, UPM-Kymmene Corporation, WestRock. are some key players in the global Wood Pulp market.
List of Figures
Figure 1: Global Wood Pulp Market Revenue Breakdown (USD Billion, %) by Region, 2023 & 2030
Figure 2: Global Market Value Share (%), By Segment 1, 2023 & 2030
Figure 3: Global Market Forecast (USD Billion), by Sub-Segment 1, 2021-2030
Figure 4: Global Market Forecast (USD Billion), by Sub-Segment 2, 2021-2030
Figure 5: Global Market Value Share (%), By Segment 2, 2023 & 2030
Figure 6: Global Market Forecast (USD Billion), by Sub-Segment 1, 2021-2030
Figure 7: Global Market Forecast (USD Billion), by Sub-Segment 2, 2021-2030
Figure 8: Global Market Forecast (USD Billion), by Sub-Segment 3, 2021-2030
Figure 9: Global Wood Pulp Market Forecast (USD Billion), by Others, 2021-2030
Figure 10: Global Market Value Share (%), By Segment 3, 2023 & 2030
Figure 11: Global Market Forecast (USD Billion), by Sub-Segment 1, 2021-2030
Figure 12: Global Market Forecast (USD Billion), by Sub-Segment 2, 2021-2030
Figure 13: Global Market Forecast (USD Billion), by Sub-Segment 3, 2021-2030
Figure 14: Global Market Forecast (USD Billion), by Others, 2021-2030
Figure 15: Global Market Value (USD Billion), by Region, 2023 & 2030
Figure 16: North America Wood Pulp Market Value Share (%), By Segment 1, 2023 & 2030
Figure 17: North America Market Forecast (USD Billion), by Sub-Segment 1, 2021-2030
Figure 18: North America Market Forecast (USD Billion), by Sub-Segment 2, 2021-2030
Figure 19: North America Market Value Share (%), By Segment 2, 2023 & 2030
Figure 20: North America Market Forecast (USD Billion), by Sub-Segment 1, 2021-2030
Figure 21: North America Market Forecast (USD Billion), by Sub-Segment 2, 2021-2030
Figure 22: North America Market Forecast (USD Billion), by Sub-Segment 3, 2021-2030
Figure 23: North America Market Forecast (USD Billion), by Others, 2021-2030
Figure 24: North America Market Value Share (%), By Segment 3, 2023 & 2030
Figure 25: North America Market Forecast (USD Billion), by Sub-Segment 1, 2021-2030
Figure 26: North America Market Forecast (USD Billion), by Sub-Segment 2, 2021-2030
Figure 27: North America Market Forecast (USD Billion), by Sub-Segment 3, 2021-2030
Figure 28: North America Market Forecast (USD Billion), by Others, 2021-2030
Figure 29: North America Market Forecast (USD Billion), by U.S., 2021-2030
Figure 30: North America Market Forecast (USD Billion), by Canada, 2021-2030
Figure 31: Latin America Wood Pulp Market Value Share (%), By Segment 1, 2023 & 2030
Figure 32: Latin America Market Forecast (USD Billion), by Sub-Segment 1, 2021-2030
Figure 33: Latin America Market Forecast (USD Billion), by Sub-Segment 2, 2021-2030
Figure 34: Latin America Market Value Share (%), By Segment 2, 2023 & 2030
Figure 35: Latin America Market Forecast (USD Billion), by Sub-Segment 1, 2021-2030
Figure 36: Latin America Market Forecast (USD Billion), by Sub-Segment 2, 2021-2030
Figure 37: Latin America Market Forecast (USD Billion), by Sub-Segment 3, 2021-2030
Figure 38: Latin America Market Forecast (USD Billion), by Others, 2021-2030
Figure 39: Latin America Market Value Share (%), By Segment 3, 2023 & 2030
Figure 40: Latin America Market Forecast (USD Billion), by Sub-Segment 1, 2021-2030
Figure 41: Latin America Market Forecast (USD Billion), by Sub-Segment 2, 2021-2030
Figure 42: Latin America Market Forecast (USD Billion), by Sub-Segment 3, 2021-2030
Figure 43: Latin America Market Forecast (USD Billion), by Others, 2021-2030
Figure 44: Latin America Market Forecast (USD Billion), by Brazil, 2021-2030
Figure 45: Latin America Market Forecast (USD Billion), by Mexico, 2021-2030
Figure 46: Latin America Market Forecast (USD Billion), by Rest of Latin America, 2021-2030
Figure 47: Europe Wood Pulp Market Value Share (%), By Segment 1, 2023 & 2030
Figure 48: Europe Market Forecast (USD Billion), by Sub-Segment 1, 2021-2030
Figure 49: Europe Market Forecast (USD Billion), by Sub-Segment 2, 2021-2030
Figure 50: Europe Market Value Share (%), By Segment 2, 2023 & 2030
Figure 51: Europe Market Forecast (USD Billion), by Sub-Segment 1, 2021-2030
Figure 52: Europe Market Forecast (USD Billion), by Sub-Segment 2, 2021-2030
Figure 53: Europe Market Forecast (USD Billion), by Sub-Segment 3, 2021-2030
Figure 54: Europe Market Forecast (USD Billion), by Others, 2021-2030
Figure 55: Europe Market Value Share (%), By Segment 3, 2023 & 2030
Figure 56: Europe Market Forecast (USD Billion), by Sub-Segment 1, 2021-2030
Figure 57: Europe Market Forecast (USD Billion), by Sub-Segment 2, 2021-2030
Figure 58: Europe Market Forecast (USD Billion), by Sub-Segment 3, 2021-2030
Figure 59: Europe Market Forecast (USD Billion), by Others, 2021-2030
Figure 60: Europe Market Forecast (USD Billion), by U.K., 2021-2030
Figure 61: Europe Market Forecast (USD Billion), by Germany, 2021-2030
Figure 62: Europe Market Forecast (USD Billion), by France, 2021-2030
Figure 63: Europe Market Forecast (USD Billion), by Italy, 2021-2030
Figure 64: Europe Market Forecast (USD Billion), by Spain, 2021-2030
Figure 65: Europe Market Forecast (USD Billion), by Russia, 2021-2030
Figure 66: Europe Market Forecast (USD Billion), by Rest of Europe, 2021-2030
Figure 67: Asia Pacific Wood Pulp Market Value Share (%), By Segment 1, 2023 & 2030
Figure 68: Asia Pacific Market Forecast (USD Billion), by Sub-Segment 1, 2021-2030
Figure 69: Asia Pacific Market Forecast (USD Billion), by Sub-Segment 2, 2021-2030
Figure 70: Asia Pacific Market Value Share (%), By Segment 2, 2023 & 2030
Figure 71: Asia Pacific Market Forecast (USD Billion), by Sub-Segment 1, 2021-2030
Figure 72: Asia Pacific Market Forecast (USD Billion), by Sub-Segment 2, 2021-2030
Figure 73: Asia Pacific Market Forecast (USD Billion), by Sub-Segment 3, 2021-2030
Figure 74: Asia Pacific Market Forecast (USD Billion), by Others, 2021-2030
Figure 75: Asia Pacific Market Value Share (%), By Segment 3, 2023 & 2030
Figure 76: Asia Pacific Market Forecast (USD Billion), by Sub-Segment 1, 2021-2030
Figure 77: Asia Pacific Market Forecast (USD Billion), by Sub-Segment 2, 2021-2030
Figure 78: Asia Pacific Market Forecast (USD Billion), by Sub-Segment 3, 2021-2030
Figure 79: Asia Pacific Market Forecast (USD Billion), by Others, 2021-2030
Figure 80: Asia Pacific Market Forecast (USD Billion), by China, 2021-2030
Figure 81: Asia Pacific Market Forecast (USD Billion), by India, 2021-2030
Figure 82: Asia Pacific Market Forecast (USD Billion), by Japan, 2021-2030
Figure 83: Asia Pacific Market Forecast (USD Billion), by Australia, 2021-2030
Figure 84: Asia Pacific Market Forecast (USD Billion), by Southeast Asia, 2021-2030
Figure 85: Asia Pacific Market Forecast (USD Billion), by Rest of Asia Pacific, 2021-2030
Figure 86: Middle East & Africa Wood Pulp Market Value Share (%), By Segment 1, 2023 & 2030
Figure 87: Middle East & Africa Market Forecast (USD Billion), by Sub-Segment 1, 2021-2030
Figure 88: Middle East & Africa Market Forecast (USD Billion), by Sub-Segment 2, 2021-2030
Figure 89: Middle East & Africa Market Value Share (%), By Segment 2, 2023 & 2030
Figure 90: Middle East & Africa Market Forecast (USD Billion), by Sub-Segment 1, 2021-2030
Figure 91: Middle East & Africa Market Forecast (USD Billion), by Sub-Segment 2, 2021-2030
Figure 92: Middle East & Africa Market Forecast (USD Billion), by Sub-Segment 3, 2021-2030
Figure 93: Middle East & Africa Market Forecast (USD Billion), by Others, 2021-2030
Figure 94: Middle East & Africa Market Value Share (%), By Segment 3, 2023 & 2030
Figure 95: Middle East & Africa Market Forecast (USD Billion), by Sub-Segment 1, 2021-2030
Figure 96: Middle East & Africa Market Forecast (USD Billion), by Sub-Segment 2, 2021-2030
Figure 97: Middle East & Africa Market Forecast (USD Billion), by Sub-Segment 3, 2021-2030
Figure 98: Middle East & Africa Market Forecast (USD Billion), by Others, 2021-2030
Figure 99: Middle East & Africa Market Forecast (USD Billion), by GCC, 2021-2030
Figure 100: Middle East & Africa Market Forecast (USD Billion), by South Africa, 2021-2030
Figure 101: Middle East & Africa Market Forecast (USD Billion), by Rest of Middle East & Africa, 2021-2030
List of Tables
Table 1: Global Wood Pulp Market Revenue (USD Billion) Forecast, by Segment 1, 2021-2030
Table 2: Global Market Revenue (USD Billion) Forecast, by Segment 2, 2021-2030
Table 3: Global Market Revenue (USD Billion) Forecast, by Segment 3, 2021-2030
Table 4: Global Market Revenue (USD Billion) Forecast, by Region, 2021-2030
Table 5: North America Wood Pulp Market Revenue (USD Billion) Forecast, by Segment 1, 2021-2030
Table 6: North America Market Revenue (USD Billion) Forecast, by Segment 2, 2021-2030
Table 7: North America Market Revenue (USD Billion) Forecast, by Segment 3, 2021-2030
Table 8: North America Market Revenue (USD Billion) Forecast, by Country, 2021-2030
Table 9: Europe Wood Pulp Market Revenue (USD Billion) Forecast, by Segment 1, 2021-2030
Table 10: Europe Market Revenue (USD Billion) Forecast, by Segment 2, 2021-2030
Table 11: Europe Market Revenue (USD Billion) Forecast, by Segment 3, 2021-2030
Table 12: Europe Market Revenue (USD Billion) Forecast, by Country, 2021-2030
Table 13: Latin America Wood Pulp Market Revenue (USD Billion) Forecast, by Segment 1, 2021-2030
Table 14: Latin America Market Revenue (USD Billion) Forecast, by Segment 2, 2021-2030
Table 15: Latin America Market Revenue (USD Billion) Forecast, by Segment 3, 2021-2030
Table 16: Latin America Market Revenue (USD Billion) Forecast, by Country, 2021-2030
Table 17: Asia Pacific Wood Pulp Market Revenue (USD Billion) Forecast, by Segment 1, 2021-2030
Table 18: Asia Pacific Market Revenue (USD Billion) Forecast, by Segment 2, 2021-2030
Table 19: Asia Pacific Market Revenue (USD Billion) Forecast, by Segment 3, 2021-2030
Table 20: Asia Pacific Market Revenue (USD Billion) Forecast, by Country, 2021-2030
Table 21: Middle East & Africa Wood Pulp Market Revenue (USD Billion) Forecast, by Segment 1, 2021-2030
Table 22: Middle East & Africa Market Revenue (USD Billion) Forecast, by Segment 2, 2021-2030
Table 23: Middle East & Africa Market Revenue (USD Billion) Forecast, by Segment 3, 2021-2030
Table 24: Middle East & Africa Market Revenue (USD Billion) Forecast, by Country, 2021-2030
Research Process
Data Library Research are conducted by industry experts who offer insight on
industry structure, market segmentations technology assessment and competitive landscape (CL), and penetration, as well as on emerging trends. Their analysis is based on primary interviews (~ 80%) and secondary research (~ 20%) as well as years of professional expertise in their respective industries. Adding to this, by analysing historical trends and current market positions, our analysts predict where the market will be headed for the next five years. Furthermore, the varying trends of segment & categories geographically presented are also studied and the estimated based on the primary & secondary research.
In this particular report from the supply side Data Library Research has conducted primary surveys (interviews) with the key level executives (VP, CEO’s, Marketing Director, Business Development Manager
and SOFT) of the companies that active & prominent as well as the midsized organization
FIGURE 1: DLR RESEARH PROCESS

Primary Research
Extensive primary research was conducted to gain a deeper insight of the market and industry performance. The analysis is based on both primary and secondary research as well as years of professional expertise in the respective industries.
In addition to analysing current and historical trends, our analysts predict where the market is headed over the next five years.
It varies by segment for these categories geographically presented in the list of market tables. Speaking about this particular report we have conducted primary surveys (interviews) with the key level executives (VP, CEO’s, Marketing Director, Business Development Manager and many more) of the major players active in the market.
Secondary Research
Secondary research was mainly used to collect and identify information useful for the extensive, technical, market-oriented, and Friend’s study of the Global Extra Neutral Alcohol. It was also used to obtain key information about major players, market classification and segmentation according to the industry trends, geographical markets, and developments related to the market and technology perspectives. For this study, analysts have gathered information from various credible sources, such as annual reports, sec filings, journals, white papers, SOFT presentations, and company web sites.
Market Size Estimation
Both, top-down and bottom-up approaches were used to estimate and validate the size of the Global market and to estimate the size of various other dependent submarkets in the overall Extra Neutral Alcohol. The key players in the market were identified through secondary research and their market contributions in the respective geographies were determined through primary and secondary research.
Forecast Model
