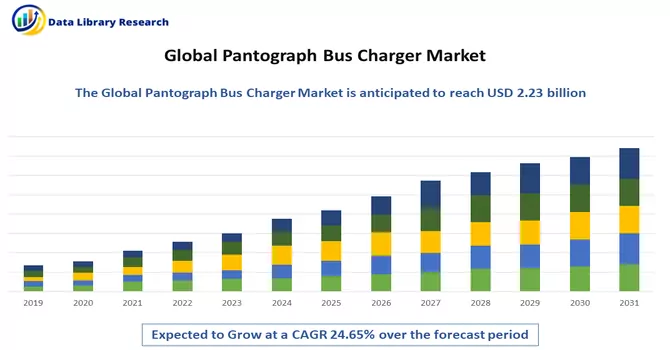
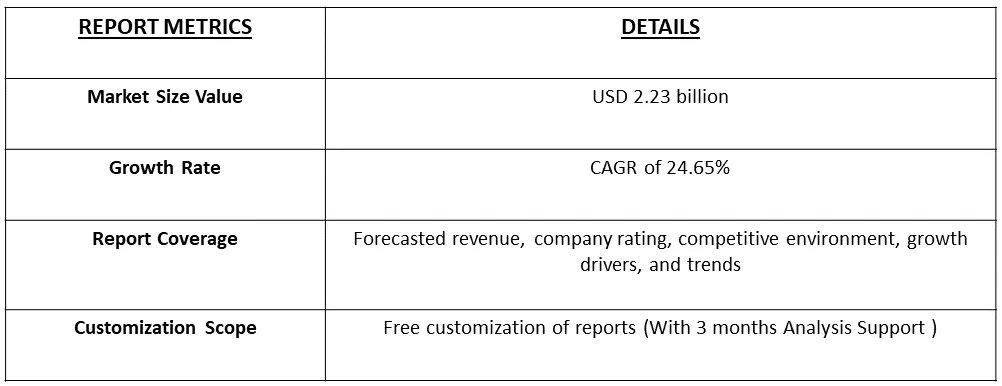
The studied market is anticipated to achieve a valuation of USD 2.23 billion by 2023, the Bus Pantograph Charger Market is poised for substantial growth, projected to register a compelling Compound Annual Growth Rate (CAGR) of 24.65% from 2023 to 2030.
Get Complete Analysis Of The Report - Download Free Sample PDF
The market for pantograph bus chargers encompasses the entire spectrum of activities related to the creation, deployment, and maintenance of charging infrastructure tailored for electric buses utilizing pantograph charging systems. These charging systems feature overhead mechanisms with a mechanical arm, known as a pantograph, which extends to establish a connection with the electric bus, facilitating efficient and rapid charging during scheduled stops. This technology has found widespread application in the public transportation sector.
The escalating global focus on sustainable and environmentally friendly urban transportation has been a catalyst for the electrification of public transit systems. Pantograph bus chargers emerge as pivotal components in facilitating the adoption of electric buses, contributing to the reduction of reliance on traditional fossil fuels and mitigating the carbon footprint associated with public transportation. Government initiatives worldwide, aimed at curbing air pollution and promoting sustainable transportation practices, have been instrumental in propelling the adoption of electric buses and the requisite charging infrastructure.
Various incentive programs, subsidies, and regulatory measures have been implemented to encourage public transit agencies and municipalities to invest in pantograph bus chargers as integral components of their overarching electric mobility strategies. This strategic approach aligns with broader sustainability goals and reinforces the commitment to environmentally conscious urban transportation solutions. Thus, the Bus Pantograph Charger Market is on a trajectory of robust growth, fueled by the global shift towards sustainable transportation practices, government initiatives, and the increasing adoption of electric buses in public transit systems. As technology continues to evolve and awareness of environmental considerations grows, the market is poised to play a pivotal role in shaping the future of urban mobility.
A notable trend within the pantograph bus charger market is the advancement and implementation of high-power charging solutions. Ongoing innovations in charging technology are geared towards minimizing the charging duration for electric buses, thereby elevating the operational efficiency of public transit systems. An emerging practice involves the integration of pantograph bus chargers with smart grid systems. This integration facilitates superior energy distribution management, the optimization of charging schedules, and enhanced coordination with overall grid operations. Such integration contributes significantly to the development of a more sustainable and resilient energy infrastructure.
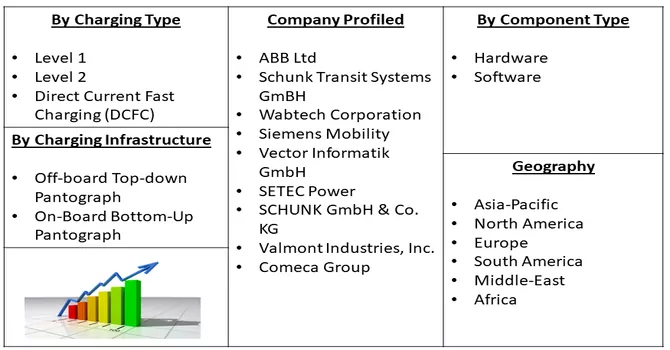
Market Segmentation: The Pantograph Bus Charger Manufacturers and the Market is Segmented by Charging Type (Level 1, Level 2, and Direct Current Fast Charging (DCFC)), Component Type (Hardware and Software), Charging Infrastructure (Off-board Top-down Pantograph and On-Board Bottom-Up Pantograph), and Geography (North America, Europe, Asia-Pacific, South America, and Middle East and Africa). The market size and forecasts for the Bus Pantograph Charger Market are Provided in value (USD million) for all the above segments.
For Detailed Market Segmentation - Download Free Sample PDF
Market Drivers:
Government Support and Incentives
The pivotal role of government initiatives and incentives in propelling the uptake of pantograph bus chargers cannot be overstated. Governments and local authorities across the globe are steadfast in their commitment to curbing greenhouse gas emissions and advocating for sustainable transportation practices. To bolster this commitment, they provide financial incentives, grants, and subsidies to public transit agencies and municipalities, encouraging investments in electric buses and associated charging infrastructure, which includes pantograph bus chargers. These incentives play a crucial role in significantly mitigating the initial capital costs and operational expenses associated with the transition to electric buses, creating an environment conducive to the flourishing growth of the pantograph bus charger market.
Moreover, in November 2021, the Department of Transport and Road Infrastructure Development in Moscow, in collaboration with the FSUE NAMI State Research Center, initiated a groundbreaking pilot project. This involved the installation of an avant-garde charging station featuring a pantograph for buses at the Mosgortrans urban surface public transport operator's subsidiary. As part of this initiative, two electric buses were retrofitted with specialized contact rails designed for the new charging infrastructure. These innovative pantographs are slated for testing and evaluation, with the trial period expected to conclude by the end of 2022.
Expansion of Electric Bus Fleets
The prominent catalyst propelling the pantograph bus charger market is the escalating adoption and worldwide expansion of electric bus fleets. In pursuit of environmental objectives and the reduction of air pollution, transit agencies and municipalities are actively shifting their bus fleets away from traditional internal combustion engine (ICE) buses toward electric buses. The increasing demand for electric buses inherently underscores the necessity for swift and efficient charging solutions, such as pantograph bus chargers. The ongoing expansion of electric bus fleets generates a direct and sustained demand for the implementation of charging infrastructure, thereby bolstering the growth trajectory of the pantograph bus charger market.
Market Restraints:
High Initial Capital Costs and Infrastructure and Grid Challenges:
One of the significant challenges facing the pantograph bus charger market is the high initial costs associated with setting up the charging infrastructure. Designing, manufacturing, and deploying overhead pantograph charging systems involve substantial expenses. Public transit agencies and municipalities, often constrained by budget limitations, may find it challenging to make substantial upfront investments. This limitation hampers the widespread adoption of pantograph bus chargers. Furthermore, infrastructure challenges, including constraints in electrical grid capacity, act as a barrier to the seamless deployment of pantograph bus chargers. Upgrading existing infrastructure or installing new electrical systems for high-power charging can be complex and time-consuming. Additionally, in areas where the grid capacity is insufficient, deploying pantograph chargers may require significant investments in grid upgrades, potentially causing delays in implementation.
The pandemic-induced disruptions significantly impacted project timelines and construction activities, resulting in delays in the rollout of pantograph bus chargers. Lockdowns, social distancing protocols, and workforce limitations hampered construction and installation processes, impeding the scheduled expansion of charging infrastructure. Numerous municipalities and public transit agencies grappled with financial constraints and budgetary pressures during the pandemic, as reduced revenues and increased spending on health and safety measures took a toll. This financial strain adversely affected the capacity of transit agencies to invest in new technologies, including pantograph bus chargers, resulting in a deceleration of procurement and deployment plans.
Segmentation Analysis :
Hardware and Software Segmental Analysis Market is Expected to Witness Significant Growth Over the Forecast Period
At the heart of the charging infrastructure are the essential hardware components, with the pantograph charging system serving as the key element. This system incorporates the overhead structure equipped with a pantograph arm, strategically designed to extend and connect with electric buses for the purpose of charging. The meticulous attention to the design, construction, and materials of the pantograph system is critical to guarantee robust and dependable charging operations. The structural integrity and quality of materials employed play a pivotal role in ensuring the reliability and durability of the entire charging mechanism. Complementing this hardware is the charging management software, often regarded as the operational brain of the system. This sophisticated software is responsible for overseeing the entire charging process, intricately managing power flow, and optimizing charging schedules. Its role becomes particularly crucial in scenarios where multiple buses share the same charging station. The software's primary function lies in ensuring the efficient utilization of electrical infrastructure, contributing to the seamless and coordinated charging of multiple buses while maintaining operational efficiency. This synergy between hardware and software is fundamental to the overall effectiveness and reliability of pantograph bus charging systems.
On-Board Bottom-Up Pantograph Segment is Expected to Witness Significant growth Over the Forecast Period
The On-Board Bottom-Up Pantograph is an innovative charging system designed for electric buses, representing a notable advancement in electric vehicle technology. Unlike traditional overhead pantographs, the on-board bottom-up pantograph is integrated directly onto the electric bus itself. This charging mechanism features a retractable arm that extends from the bottom of the bus to connect with a charging station. The primary advantage of the on-board bottom-up pantograph lies in its flexibility and ease of integration into existing urban infrastructure. Since the charging mechanism is part of the bus, it eliminates the need for dedicated overhead charging infrastructure along the entire route. This adaptability makes it particularly suitable for diverse urban landscapes where retrofitting extensive overhead infrastructure might be challenging. Furthermore, the on-board bottom-up pantograph provides efficient and rapid charging during scheduled stops, contributing to the seamless integration of electric buses into existing public transit systems. The retractable design minimizes visual and physical obstructions, addressing concerns related to aesthetics and urban planning. Thus, the segment is expected to witness significant growth over the forecast period.
North America Region is Expected to Witness Significant growth Over the Forecast Period
Government initiatives across different levels—federal, state, and municipal—are pivotal in shaping the trajectory of the pantograph bus charger industry in North America. The availability of funding programs, grants, and incentives serves as a crucial driver, motivating transit agencies to invest in electric buses and the necessary charging infrastructure. These initiatives are strategically designed to achieve multiple objectives, including emissions reduction, enhancement of air quality, and the promotion of cleaner transportation solutions.
Stringent environmental regulations and sustainability goals set at both federal and state levels are key catalysts propelling the adoption of electric buses and, by extension, the deployment of pantograph bus chargers. In alignment with broader commitments to reduce carbon emissions, transit agencies in North America are strategically adjusting their approaches to meet environmental targets outlined in regulatory frameworks. For instance, a noteworthy development in April 2022 was the announcement by Transports Metropolitans de Barcelona (TMB) regarding the initiation of a tender process to acquire up to 83 battery-powered electric buses. These buses are slated to replace diesel-powered vehicles that have reached the end of their operational lifespan in 2023. The tender is structured into three lots, with two lots comprising standard-size buses (12m) featuring night load capabilities per pantograph. The contract, initially for 45 units, has the potential for expansion to 63. The third lot includes 20 articulated units (18m in length) designed for overnight pantograph charging or other innovative technologies. This initiative by TMB illustrates a tangible commitment to transitioning towards cleaner and more sustainable modes of public transportation, echoing the broader trend driven by governmental support and regulatory frameworks in North America. The collective impact of these efforts is not only contributing to environmental goals but also stimulating the growth and evolution of the pantograph bus charger industry in the region.
Get Complete Analysis Of The Report - Download Free Sample PDF
The market for bus pantograph chargers demonstrates a moderate level of consolidation, featuring numerous global and regional players. Major industry participants employ key strategies such as product innovation, joint ventures, acquisitions of smaller enterprises, and frequent product launches to maintain their competitive edge. These strategies are instrumental in enhancing market presence and catering to evolving industry demands. Product innovation stands out as a cornerstone strategy, with companies investing in research and development to introduce cutting-edge solutions and stay ahead in a dynamic market. Joint ventures and acquisitions of smaller players are additional approaches employed by major players to expand their market reach and consolidate their position in the industry. The significance of government initiatives cannot be overstated, as various governments worldwide are actively supporting the growth of the bus pantograph charger market. These initiatives encompass funding programs, grants, and policy frameworks aimed at encouraging the adoption of electric buses and related charging infrastructure, thus fostering market development.
Some of the key market players working in this market segment are:
Recent Developments:
1) In August 2022, First Bus, a British transportation company, placed an order for 193 electric buses valued at GBP 81 million (approximately USD 96.4 million) from Wrightbus, a Northern Irish bus manufacturer. Notably, the order specifies DC charging power at 150 kW, with the added option of pantograph-assisted opportunity charging at 450 kW.
2) In May 2022, the San Diego Metropolitan System initiated the construction of an overhead electric bus charging system with an investment of USD 8.5 million. This system is designed to simultaneously charge 24 battery-electric buses. The expandable overhead gantry charging system allows for the addition of more charging capacity in the future. For this project, MTS (Metropolitan Transit System) has opted for the installation of the Schunk SLS 301 series Depot Charging Pantograph, known for providing a faster and safer hands-free electric vehicle charging experience.
Q1. What was the Pantograph Bus Charger Market size in 2023?
As per Data Library Research Pantograph Bus Charger Market is anticipated to achieve a valuation of USD 2.23 billion by 2023.
Q2. At what CAGR is the Pantograph Bus Charger Market projected to grow within the forecast period?
Pantograph Bus Charger Market is expected to grow at a Compound Annual Growth Rate (CAGR) of 24.65% over the forecast period.
Q3. What are the factors driving the Pantograph Bus Charger Market?
Key factors that are driving the growth include the Government Support and Incentives and Expansion of Electric Bus Fleets.
Q4. Which Region is expected to hold the highest Market share?
North America region is expected to hold the highest Market share.
Data Library Research are conducted by industry experts who offer insight on industry structure, market segmentations technology assessment and competitive landscape (CL), and penetration, as well as on emerging trends. Their analysis is based on primary interviews (~ 80%) and secondary research (~ 20%) as well as years of professional expertise in their respective industries. Adding to this, by analysing historical trends and current market positions, our analysts predict where the market will be headed for the next five years. Furthermore, the varying trends of segment & categories geographically presented are also studied and the estimated based on the primary & secondary research.
In this particular report from the supply side Data Library Research has conducted primary surveys (interviews) with the key level executives (VP, CEO’s, Marketing Director, Business Development Manager and SOFT) of the companies that active & prominent as well as the midsized organization
FIGURE 1: DLR RESEARH PROCESS
Extensive primary research was conducted to gain a deeper insight of the market and industry performance. The analysis is based on both primary and secondary research as well as years of professional expertise in the respective industries.
In addition to analysing current and historical trends, our analysts predict where the market is headed over the next five years.
It varies by segment for these categories geographically presented in the list of market tables. Speaking about this particular report we have conducted primary surveys (interviews) with the key level executives (VP, CEO’s, Marketing Director, Business Development Manager and many more) of the major players active in the market.
Secondary ResearchSecondary research was mainly used to collect and identify information useful for the extensive, technical, market-oriented, and Friend’s study of the Global Extra Neutral Alcohol. It was also used to obtain key information about major players, market classification and segmentation according to the industry trends, geographical markets, and developments related to the market and technology perspectives. For this study, analysts have gathered information from various credible sources, such as annual reports, sec filings, journals, white papers, SOFT presentations, and company web sites.
Market Size EstimationBoth, top-down and bottom-up approaches were used to estimate and validate the size of the Global market and to estimate the size of various other dependent submarkets in the overall Extra Neutral Alcohol. The key players in the market were identified through secondary research and their market contributions in the respective geographies were determined through primary and secondary research.
Forecast Model